22email: chiara.feruglio@cea.fr 33institutetext: Dipartimento di Fisica, Università Roma Tre, via della Vasca Navale 84, 00146 Roma, Italy 44institutetext: ASI Science Data Center, via G. Galilei, 00044 Frascati, Italy 55institutetext: INAF - Osservatorio Astronomico di Bologna, via Ranzani 1, 40127 Bologna, Italy 66institutetext: Max Planck Institut für extraterrestrische Physik, Giessenbachstrasse 1, D-85748 Garching, Germany 77institutetext: Dip. di Astronomia, Universitá di Padova, vicolo dell’ Osservatorio 3, 35122 Padova, Italy 88institutetext: Ohio State University, 140 West 18th Avenue, Columbus, OH 43210, USA 99institutetext: INAF - Osservatorio Astronomico di Arcetri, Largo E. Fermi 5, 50125 Firenze, Italy 1010institutetext: Dipartimento di Astronomia, Universitá di Bologna, via Ranzani 1, 40127 Bologna, Italy
The XMM-Newton survey of the ELAIS-S1 field II: optical identifications and multiwavelength catalogue of X-ray sources ††thanks: Based on observations collected at the European Southern Observatory, Prog.ID 073.A-0446(B), 075.A-0428(B) ,076.A-0225(A), 077.A-0800(A) and 078.A-0795(B). Based also on observations made with XMM-Newton, an ESA science mission, and with Chandra X-ray Observatory.
We present the optical identifications and a multi-band catalogue of a sample of 478 X-ray sources detected in the XMM–Newton and Chandra surveys of the central 0.6 deg2 of the ELAIS-S1 field. The most likely optical/infrared counterpart of each X-ray source was identified using the chance coincidence probability in the R and IRAC 3.6 bands. This method was complemented by the precise positions obtained through Chandra observations. We were able to associate a counterpart to each X-ray source in the catalogue. Approximately 94% of them are detected in the R band, while the remaining are blank fields in the optical down to R24.5, but have a near-infrared counterpart detected by IRAC within 6″ from the XMM–Newton centroid. The multi-band catalogue, produced using the positions of the identified optical counterparts, contains photometry in ten photometric bands, from B to the MIPS 24 band. The spectroscopic follow-up allowed us to determine the redshift and classification for 237 sources ( of the sample) brighter than . The spectroscopic redshifts were complemented by reliable photometric redshifts for 68 sources. We classified 47% of the sources with spectroscopic redshift as broad-line active galactic nuclei (BL AGNs) with z, while sources without broad-lines (NOT BL AGNs) are about 46 of the spectroscopic sample and are found up to . The remaining fraction is represented by extended X-ray sources and stars. We spectroscopically identified 11 type 2 QSOs among the sources with F(2-10 keV)/F(R) 8, with redshift between 0.9 and 2.6, high 2-10 keV luminosity (log43.8 erg s-1 ) and hard X-ray colors suggesting large absorbing columns at the rest frame (log up to 23.6 cm-2). BL AGNs show on average blue optical-to-near-infrared colors, softer X-ray colors and X-ray-to-optical colors typical of optically selected AGNs. Conversely, narrow-line sources show redder optical colors, harder X-ray flux ratio and span a wider range of X-ray-to-optical colors. On average the Spectral Energy Distributions (SEDs) of high-luminosity BL AGNs resemble the power-law typical of unobscured AGNs. The SEDs of NOT BL AGNs are dominated by the galaxy emission in the optical/near-infrared, and show a rise in the mid-infrared which suggests the presence of an obscured active nucleus. We study the infrared-to-optical colors and near-infrared SEDs to infer the properties of the AGN host galaxies.
Key Words.:
galaxies: active – surveys – X-ray: background – galaxies – general1 Introduction
One of the primary goals of observational cosmology is the determination of the census of the Active Galactic Nuclei population in the Universe, along with their cosmic evolution and the assembly of super-massive black-holes (SMBHs) in galaxy nuclei. Several theoretical and observational results indicate that the assembly of SMBHs is tightly linked to the evolution of the galaxy bulge component. The discovery of SMBHs in the center of most nearby bulge-dominated galaxies and the correlation existing between the black-hole mass and the bulge properties (the relation, Gebhardt et al. (2000), Ferrarese & Merritt (2000)) suggest that the assembly of bulge masses is tied to the evolution of the accretion processes in AGNs. In such scenario, the details of the co-evolution of black-holes and their host galaxies depend on feedback mechanisms between the AGNs and their host galaxies (e.g. Granato et al. (2001, 2004), Di Matteo et al. (2005), Menci et al. (2006), Croton et al. (2006)). Luminous AGNs are more efficient in inhibiting the star-formation in their host galaxies, heating the interstellar matter through winds, shocks, and high energy radiation, thus making their colors redder. In this picture, the AGN phase should precede the phase when a galaxy is caught in a passive phase. Indeed, Pozzi et al. (2007) and Mignoli et al. (2004) using Spitzer photometry found that a sample of highly obscured (log cm-2) QSOs at z=1-2 are hosted by red passive galaxies, suggesting a later stage in their evolution. Spectroscopy of type 2 QSOs with the Infrared Spectrograph (IRS) onboard Spitzer finds similar results (Weedman et al. (2006), Houck et al. (2005)). This would suggest that the red colors of the IR selected heavily obscured AGNs (N cm-2) may be associated to a passive host galaxy. The study of the optical and infrared colors of AGN host galaxies can therefore put constraints on AGN feedback mechanisms and on their relative time-scales. This study is of course easier in the cases where the nuclear light does not over-shine the stellar light, i.e. in optically obscured AGNs.
Hard X-ray surveys performed by Chandra and XMM–Newton in 2-10 keV band are the primary and most efficient tool to detect unobscured and moderately obscured (NH up to a few 1023 cm-2) AGNs up to high redshift, as they are less affected by dust and gas obscuration, compared to optical surveys and soft X-ray surveys. In particular, deep pencil-beam surveys and shallower, large area surveys have been recently used to select and study the hard X-ray population, which dominates the cosmic X-ray background (see Brandt & Hasinger (2005) and references therein). These surveys are particularly efficient in selecting optically obscured AGNs, which show X-ray-to-optical colors (F(2-10 keV)/F(R) 111, hereafter X/O) larger than 10, and are usually missed by optical selection (see e.g. Fiore et al. (2003), Cocchia et al. (2007), Caccianiga et al. (2007)). The majority of these sources are thought to be obscured QSO at z1, but many of them remain spectroscopically unidentified due to the faintness of their optical counterparts, which makes them difficult to access even with 10 m class telescopes. Several studies suggest that the amount of obscuration decreases with increasing intrinsic luminosity (e.g., La Franca et al. (2005),Ueda et al. (2003)). However, even the 2-10 keV selection becomes highly incomplete in selecting highly obscured and Compton-thick AGNs, with logNH.
The XMM–Newton survey of ELAIS-S1 is a large-area, medium depth survey, and therefore is particularly suited to select a large number of luminous AGNs. The ELAIS-S1 field covers an area of about 4 deg2 in the southern hemisphere, and includes the minimum in the Galactic 100 m emission in that hemisphere (0.37 MJy/sr, Schlegel et al. (1998)). A central 0.6 deg2 contiguous area (centered at 00 34 40.4, -43 28 44.6) has been surveyed with XMM–Newton for a total of 400 ks. The regions with highest XMM sensitivity (65% of the full XMM area) were target of 6 Chandra pointings (two of them centered on the same coordinates) with the aim of obtaining precise positions for the X-ray sources. The field has a multi-band photometric coverage from the optical B band to the mid-infrared Spitzer bands. A spectroscopic follow-up has been performed with VIMOS/VLT, FORS2/VLT and EFOSC/ESO3.6m for redshift determination and classification of the sources.
This paper presents the optical identifications and a multi-band catalogue of the X-ray sample described in Puccetti et al. (2006), along with the optical spectroscopy (redshift and source classification) for a sub-sample of sources, and an analysis of their multiwavelength properties. In this paper we concentrate on two main issues: 1) the identifications of a sizable sample of high luminosity, optically obscured QSOs; 2) the study of the optical and infrared properties of the host galaxies of the highly obscured AGNs.
The paper is organized as follows: Section 2 presents the sample, the multi-band photometry and optical spectroscopy. Section 3 discusses source identification and presents the multi-band catalogue. Section 4 presents our results, redshifts, source classification and an analysis of the spectral energy distributions. In Section 5 we present our conclusions. Magnitudes are given in Vega system unless otherwise stated. A km s-1 Mpc-1, =0.3, cosmology is adopted throughout.
2 Observations and data analysis
2.1 XMM–Newton data
XMM–Newton surveyed the central 0.6 deg2 of the ELAIS-S1 field down to flux limits of 2.510-15 in the 2-10 keV band (hard band, H) and 5.510-16 in the 0.5-2 keV band (soft band, S) (Puccetti et al., 2006). A total of 478 sources were detected: 395 in the soft band, and 205 in the hard band. Among these, Puccetti et al. (2006) identified 7 extended sources, probably groups or clusters.
2.2 Chandra X-ray data
Chandra observations, whose angular resolution can reach 0.5″ on axis, allow us to significantly improve the identification of the optical counterpart. Chandra observations were devised to cover the areas with the highest XMM–Newton sensitivity. The five Chandra pointings have exposure times 32150 s, 37081 s, 40256 s, 23974 s, 29948 s, and are slightly overlapping. The background in the non averlapping areas is rather stable ranging from and counts/s/pixel or counts/30 ksec over an area of 2 arcsec radius. We are therefore never background limited for point source detection. Assuming 5 counts for the faintest detection (which corresponds to a probability of being a background fluctuation given the above background between and ) results in a 0.5-7 keV and 0.5-2 keV flux limits of and erg cm-2 s-1 (for a power law spectrum with ).
The five fields were astrometrically corrected by matching the positions of bright X-ray sources (AGNs) with that of point-like optical counterparts. The systematic shifts between the X-ray and the optical positions were always smaller than a few arcsec. The residual systematic shift is arcsec in all five cases.
Source detection was performed on each single event file in the full 0.5-7 keV energy band using the PWDetect code, developed at INAF - Osservatorio Astronomico di Palermo (see Damiani et al. (1997) and Puccetti et al. (2006) for more details on the detection algorithm). The significance threshold for each field was chosen in order to get entries with more than 4-5 counts.
The main technical goal of this paper is the identification of the counterparts of the XMM X-ray sources. Chandra data are used here only to help the identification process. Therefore, the main concern about the Chandra data analysis is the quality of the positions. Position uncertainties are proportional to the size of the Chandra point spread function at the off-axis angle where the source is detected and proportional to the inverse of the square root of the source counts. Typical 1 uncertainties ranges from 0.1 arcsec (limited by the accuracy of the astrometric correction of the Chandra fields) to a 1-2 arcsec for faint, off-axis sources. This is always better than the XMM position accuracy. When available, we therefore always used Chandra positions to help and/or confirm the identification of the counterparts of the XMM sources.
296 XMM sources are present in the area covered by Chandra pointings. 239 of these are detected also by Chandra (80%). This is consistent with the Chandra slightly shallower flux limit. The Chandra detections starts to drop strongly below erg cm-2 s-1, and are correspondingly largely incomplete below this flux limit. In summary we have rather accurate Chandra positions for 50% of the XMM source sample.
 |
2.3 Optical/IR photometry
ELAIS-S1 is the main southern field of the Spitzer Wide-area Infra-Red Extragalactic survey (SWIRE, Lonsdale et al. (2003), Lonsdale et al. (2004)). The field was observed by Spitzer in December 2004, with the Infrared Array Camera (IRAC) in the near-Infrared and the Multiple Imaging Photometer (MIPS) in the mid-Infrared, down to flux limits 4.1 Jy at 3.6 and 0.4 mJy at 24 (5). The absolute flux uncertainty is about 10% , as described in the SWIRE data release (Surace & SWIRE, 2004).
The ELAIS-S1 field is covered also with BVR band photometry from the ESO-Spitzer Imaging Extragalactic WFI survey (ESIS, Berta et al. (2006)), performed with the ESO Wide Field Imager.
The field was observed between July 2004 and October 2005 with VIMOS/VLT (LeFevre et al., 2003) to obtain photometry in the R band down to R 24.5, with integration time of 180 seconds. The pointings were devised to obtain the most complete coverage possible of the area covered by XMM observations, filling the gaps between the VIMOS quadrants.
The XMM ELAIS-S1 field was observed with SOFI/NTT in J and Ks bands, down to J=21 and Ks=19.5 (Vega) within the framework of the ESO Large Program 170.A-0143.
The R and Ks frames were co-added spearately in each of the two photometric bands using the SWarp software (Bertin, 2003). Individual R and Ks frames were resampled to a pixel scale of 0.29″/px and rescaled to the same photometric zero-point before co-adding. A mosaic was created for each photometric band averaging the VIMOS or SOFI frames. Source detection and photometry were performed in the R-band using SExtractor (Bertin & Arnouts, 1996). Photometry in the Ks band was obtained for the sources detected in the R band. Photometric zero-points relative to Vega were calculated for the R-band using the photometric observations reported by La Franca et al. (2004). Photometric zero-points for the J and Ks band are from Dias et al., (in preparation). To account for possible Ks sources that do not have an R-band counterpart, detection and photometry were also performed in the Ks band individually (there are 6 counterparts detected in the K band without detection in the R band).
2.4 Optical spectroscopy
The XMM ELAIS-S1 field was the target of several spectroscopic campaigns in 2004-2006 . Spectroscopy of 13 optically bright (R20) sources was performed with the EFOSC spectrograph at ESO/3.6m telescope in October 2005, covering the 4000-9000 wavelength range with grisms #6 and #13.
Spectroscopic targets with a limiting magnitude of R=24 were observed with VIMOS/VLT. These observations were carried out in the multi-object spectroscopy (MOS) mode, with the Low Resolution Red (LRR) grism (), covering the 5500-9500 Å wavelength range, with 1 to 4 hours exposure time. During the two VIMOS observing runs, in 2005 and 2006, 196 spectra of X-ray sources have been obtained. In addition, about 2000 spectra of 24 , 8 and K selected sources were collected. The latter spectra will be reported in a separate publications by Sacchi et al. (2008). VIMOS data reduction was carried out using the VIMOS Interactive Pipeline and Graphical Interface (VIPGI) (Scodeggio et al., 2005).
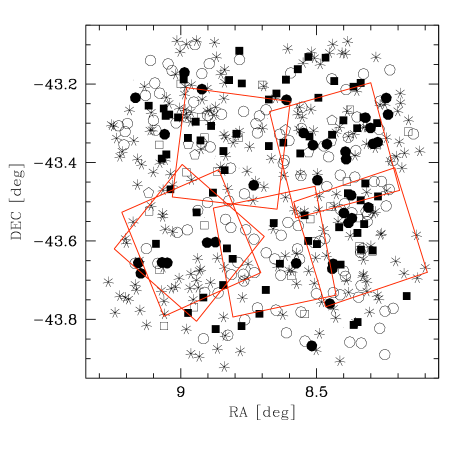
Spectroscopy of optically faint X-ray sources, and in particular sources with high X/O, has been carried on with FORS2/VLT in 2006-2007. Spectra of 45 faint sources (R up to 25) were collected using the 150I grism of FORS2/VLT MXU with exposure times of 2.7 hours each, covering the wavelength range 3700-10300 . FORS2/VLT data (together with ESO/3.6m) were reduced using standard IRAF procedures. Spectra of 9 counterparts are drawn from La Franca et al. (2004). We obtained in total 263 optical spectra of counterparts of X-ray sources. Figure 1 shows the distribution of the X-ray sources in the sky together with the positions of the Chandra pointings. The different symbols used in the plot reflect the classification of the sources (see section 4.1). The density of the spectroscopic targets is not uniform across the field. In particular the two left quadrants 45 of the sources are identified, while in the right ones the fraction is .
 |
3 Source identification
Since Chandra positions are available only for a fraction of XMM sources, we have first identified the optical/infrared counterparts independently of Chandra data. We have then compared these identifications with the Chandra positions for common sources to assess their validity. In this way we have identified cases where Chandra observations are crucial to assign the correct counterpart to the X-ray source.
The typical XMM–Newton error circles ( radius at 99% confidence level, Fiore et al. (2003)) are likely to contain several faint optical and infrared sources. Therefore, we follow a statistical approach to assign the most probable optical/infrared counterpart to each X-ray source. For the optical band, we calculated the chance coincidence probability for each optical source contained inside the 6″ error-circle (see e.g. Brusa et al. (2007)), using the distance between the XMM–Newton and the optical positions (), and the R-band galaxy counts N(R):
where are the integral source counts evaluated directly from the VIMOS photometry. The best fit relation is .
For the 3.6 band we applied the same equation, but using the 3.6 source counts from Fazio et al. (2004), and the distance between the XMM–Newton and the infrared positions. The identification based on IRAC 3.6 provides a counterpart different from the most probable optical one in 67 over 478 cases (15). All of them are optically faint sources: 67 have mean R23.3, and the remaining do not have an optical detection down to R24.5.
For 31 error-boxes (6 ) we find multiple optical and infrared counterparts with similar probabilities. In these cases we identified the X-ray source with the counterpart with the brightest MIPS 24 flux (183 sources (38) are detected by MIPS at 24 down to 400 Jy). In addition, we visually inspected the sources one by one and used the spectroscopic information where available to validate the identification.
Finally, we assigned to each X-ray source either an optical or infrared counterpart. Most of them (92) are detected in the R band, while the remaining are detected in IRAC. 420 X-ray sources (88 of the sample) have a counterpart detected both in the optical and in IRAC.
 |
3.1 Chandra positions
About 78 of the Chandra positions are within 3″ from the XMM–Newton centroid. The Chandra detections confirm the counterpart identified through the 3.6 chance coincidence probability for 96 of the sample, while yields 4 of new identifications (10 sources). In half of the cases the IRAC sources are strongly blended. In the other cases Chandra chooses one of two sources with similar probability. Nine of the ten sources have faint optical counterparts (R24). In one case it coincides with two bright stars closer than a few arcsecs.
As an exercise, we compared the Chandra detections with the identifications provided by optical photometry only. Chandra confirms the optical identification in 197 cases, while it identifies a new counterpart for 50 sources (20% of the sample). Taking into account only the optically faint sources (R23), the rate of new identifications increases to 40% (44 new identifications over 109 sources).
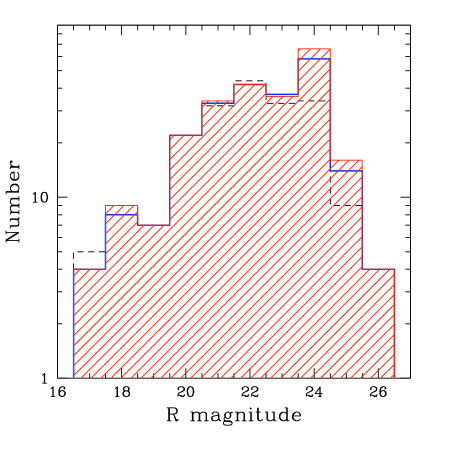
The R magnitude distribution of the counterparts detected by Chandra is shown in Figure 2.
Figure 3 shows the displacement between the XMM–Newton centroid and the optical/infrared position of the identified counterparts. The different symbols used in the plot reflect the classification of the sources (see section 4.1). 98 of the counterparts are located within 6″ from the XMM position. The median (and inter-quartile range shown in brackets from now on) of the displacement are 1.74″[0.86″], with 78 of the optical/infrared counterparts (374 sources) falling within 3″ from the X-ray position, consistent with other surveys (HELLAS2XMM, Fiore et al. (2003), COSMOS, Brusa et al. (2007)). The sources with 6″ (11 in total) are nearby galaxies extended in the optical. There is one broad-line AGN with 6″, for which the XMM position may be due to the mixed contribution of a nearby extended galaxy and to the AGN itself. On average, broad-line AGNs are more concentrated than the full sample on the X-ray positions, showing a median displacement 1.42″[0.66″], and 93 of them are located within 3″. The median displacement of the 93 faint (R23), spectroscopically unidentified sources is 2.2″[1.0″]. Among these sources, those with neither Chandra nor Spitzer detection, and 3″(6 in total) may be false identifications.

|
4 Results
4.1 Spectroscopic redshifts and source classification
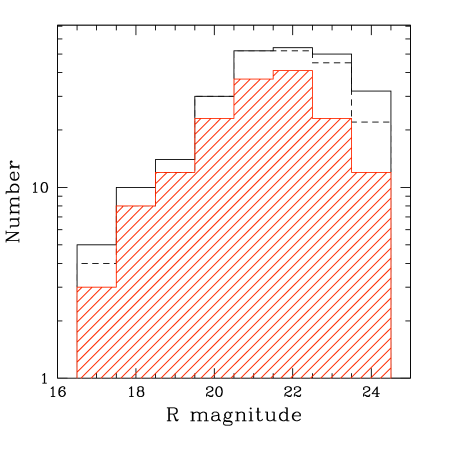
We collected 263 spectra of counterparts of X-ray sources. Redshifts were computed using the rvidlines IRAF tool. The average of the redshifts corresponding to the observed line centers gives the source redshift. Depending on the number of spectral features used to derive it, we assigned a quality flag to each redshift. Objects identified through at least two emission (absorption) lines were assigned quality 2. Spectra that showed one clearly recognizable feature were assigned quality 1. We were able to assign a secure redshift (quality1) to 237 sources (90 of the spectroscopic sample). Less secure determinations (i.e. quality ) are found in 10 of the cases, and 60 of them has an optical counterpart fainter than R23 and no prominent emission lines in its spectrum. Figure 4 shows the redshift quality in different R magnitude bins. The fraction of secure redshift is 94 for R, while drops to 76 for sources with R23. In the following analysis we use redshifts with quality 1 (237 sources). Figure 4 (right panel) shows the R-band magnitude vs. the 0.5-10 keV flux. The spectroscopic completeness is , while it is 65 for .
We classified the sources according to their optical spectral features in five broad classes:
-
•
Broad-line AGN (BL AGN): sources with broad (FWHM 2000 km s-1) emission lines such as C iv , C iii] , Mg ii , H, H.
-
•
Narrow-line AGN (NL AGN): sources with narrow (FWHM km s-1) high-ionization emission lines indicating the presence of an AGN (C iv , C iii] , [Ne v] ). With the appropriate wavelength coverage, the presence of these emission lines allows classifying sources as AGN2 if broad lines such as Mg ii are not detected. However in a few cases the small spectral coverage does not allow classifying as AGN1 or AGN2 sources showing [Ne v] emission line.
-
•
Emission-line galaxies (ELG): sources with narrow emission lines, but no AGN signature in the optical spectra. They show strong low-ionization emission lines, such as O ii , H, O iii , H, that may be produced by thermal photons from hot stars. They often show also CaHK absorption and the continuum break at 4000 . This class is likely to include a fraction of NL AGNs, misclassified due to the small wavelength range or to low S/N spectra.
-
•
Absorption-line galaxies (GAL): sources with spectra typical of early- galaxies, characterized by absorption features such as CaHK and the 4000 continuum break.
-
•
Stars: these may be either X-ray emitting stars or chance coincidences, the X-ray emission arising from an undetected background source. These sources will be not be discussed in the following.
 |
 |
|
|
|
 |
 |
Among the spectroscopically classified sources we find: 111 BL AGNs (47 of the sample with spectroscopic redshifts), 28 narrow-line AGNs (12), 63 emission-line galaxies (26) and 18 absorption-line galaxies (8). NOT BL AGNs, i.e. all sources classified as AGN based on their X-ray luminosity, unresolved X-ray emission and z0, without visible broad lines in their optical spectra, make up 46 of the sample. The 6 galaxies corresponding to the X-ray extended sources, not included in the previous breakdown, will be discussed separately in section 4.5. The remaining 11 sources (5 of the sample) are stars.
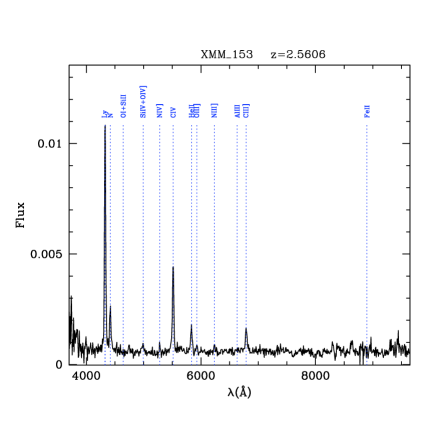
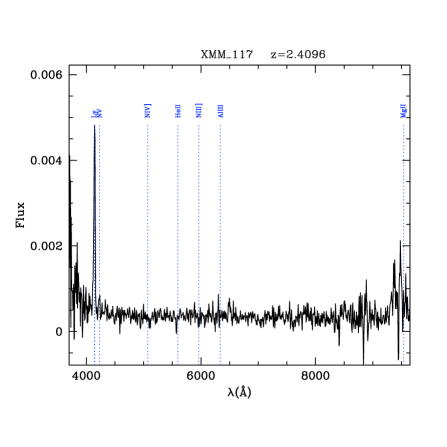
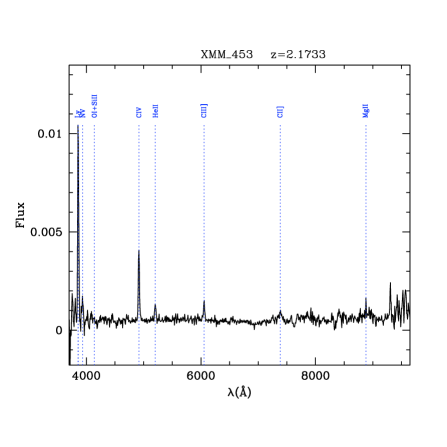
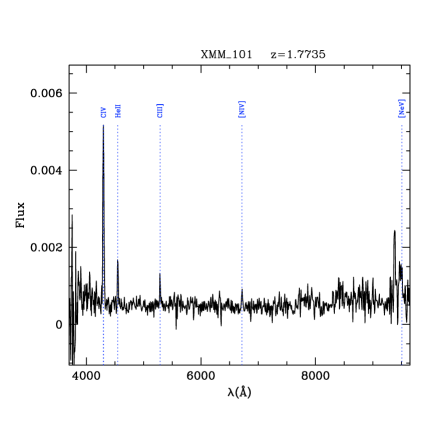
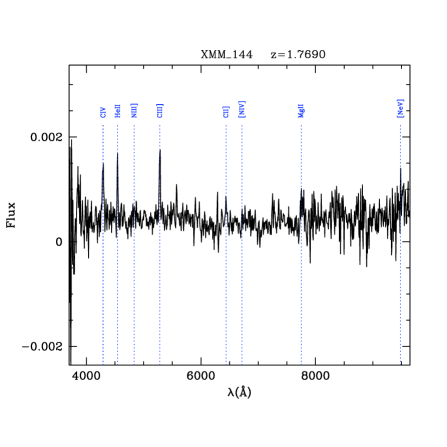
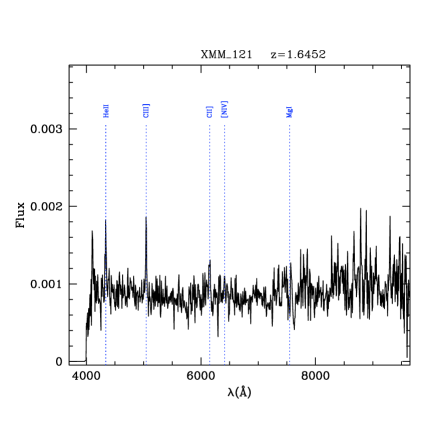
The redshift distribution for the X-ray sample is shown in Figure 5. The distributions of the spectroscopic (shaded) and photometric redshifts (black filled histogram, see section 4.2) are shown in the top panel. Figure 5, lower panel, shows the redshift distribution of the extragalactic spectroscopic sample (open histogram), and the contribution of the BL AGNs (filled histogram). The BL AGN population shows a broad redshift distribution, with median redshift = 1.40 [0.39]. The observed fraction of BL AGN increases with redshift, reaching 90% of the whole spectroscopic population at z. This class of objects have relatively bright optical counterparts ( median R= 21.5 [0.8]) and prominent emission lines in their spectra, making them easy to identify over a large redshift range. We find 28 narrow-line AGNs, 40 of which are type 2 QSOs, having log. They are found up to z2.6, and are associated with fainter optical counterparts (median R=22.8 [0.6]). Figure 6 shows a sample of type 2 QSO spectra. The population of emission-line galaxies dominates the identifications at z1, with a median z=0.67[0.27]. The sample of sources classified as ELG may include a fraction of NL AGNs, which may have been misclassified due to the limited wavelength range. The decline of narrow-line sources and normal galaxies above is likely to be due to selection effects (Brusa et al., 2007). In particular, NL AGNs are difficult to identify spectroscopically at high redshift, being on average fainter in the R band and therefore beyond the spectroscopic limit of our sample (R). This selection effect is shown in Figure 7, which presents a plot of R magnitude versus redshift. The rapid rise of R magnitude with redshift for NOT BL sources (filled symbols) is due to their relatively narrow range in absolute magnitude. Conversely, BL AGNs show a broad R magnitude distribution over a large redshift range, and dominate the identifications at high luminosity ( erg s-1 , Figure 7 bottom panel). The absorbed X-ray luminosities, , were derived assuming a power-law spectrum (F() with spectral index =0.8. In addition, the absence of strong emission lines in the typical wavelength range covered by optical spectroscopy (redshift desert) prevents us from finding ELGs above (Eckart et al., 2006). The fraction of optically obscured (NOT BL) AGNs with log erg s-1 is of all the spectroscopic population, and it is in the redshift range z=[0,1.1]. The larger fraction of NOT BL AGN compared to other surveys (e.g. of HELLAS2XMM, Cocchia et al. (2007)) can be partly due to the faint optical magnitudes reached by FORS2 spectroscopy. For example, at faint magnitudes (R) we have have spectroscopically identified 31 sources, 2/3 of them being NOT BL AGNs, vs. 10 sources in HELLAS2XMM.
Among the BL AGN detected in the 2-10 keV band, there are 11 sources (19) with an absorbing column . At a face value this is a larger, but not inconsistent, fraction compared to other surveys (Perola et al., 2004), since our values may be overestimated, being derived from the hardness ratio (HR=(Hard-Soft)/(Hard+Soft)).
 |
4.2 Photometric redshifts
About 53% of the XMM–Newton sources does not have a spectroscopic redshift. We used the code described in Fontana et al. (2000) and Fontana (2001) to obtain photometric redshifts for the full sample of X-ray sources. Photometric redshifts are calculated by using a minimization technique on spectral libraries which include both starburst, passive galaxy and AGN semi-empirical template spectra from Polletta et al. (2007), Fiore et al. (2008) and Pozzi et al. (2007). Sources with power-law SEDs provided degenerate results (see section 4.3 for detailed discussion of SEDs). Conversely, for the 76 NOT power-law sources with a spectroscopic redshift, the photometric redshift is in fair agreement with the spectroscopic one, producing an average 0.087. The results are shown in Figure 8. Therefore, for 68 sources with a SED dominated by the galaxy emission, we can consider the photometric redshift as reliable and its value is reported in the catalog. Their photo-z distribution is shown in Figure 5. These 68 sources will be analyzed in the following together with the 237 sources with a secure spectroscopic redshift. For 62 sources without spectroscopic redshift and showing a power-law SED, and for 86 sources with only a few bands above the detection limit, we were not able to determine a reliable photometric redshift.


|


|
4.3 Spectral energy distributions
X-ray sources show a variety of spectral energy distributions, which are not simple power-laws, typical of unobscured AGNs. We empirically classified the X-ray sources SEDs in four classes:
-
•
Optically blue power-law: objects whose SED resembles that of optically selected QSOs (the median QSO of Elvis et al. (1994)). These sources show a power-law SED from the UV to mid-infrared wavelengths , without significant absorption in the optical bands.
-
•
Optically red power-law: sources showing signs of absorption in the optical bands, i.e. much steeper optical and UV continua compared to blue power-laws.
-
•
Early-type-like: the SED recalls that of early-type galaxies, and is thus dominated by the stellar continua, showing a peak at 1-3 and then a decline up to 24 .
-
•
IR excess : the SED peaks at 1-3 , then it declines but rises again at 6 ;
Figure 9 shows some examples of these SED. Power-law SEDs are clearly dominated by the AGN emission. The mid-infrared emission of NOT-power-law SEDs could be either dominated by an AGN or by star formation, while the optical-to-near-infrared emission is dominated by the host galaxy stellar continua.
We were able to classify the SED shape for 319 sources (70 of the sample, excluding stars and the X-ray extended sources). For the remaining, the sources have too few bands over the detection limit and the SEDs cannot be characterized. About 39 of the X-ray sources shows either an optically blue or a red power-law SED. Optically red power-law SEDs are 12 of the sample. These objects have significant absorption in the optical bands, compared to the optically blue power-law SEDs, and therefore they may be optically obscured AGNs. 13 of the SEDs are consistent with early-type galaxies but in many cases the limit at 24 is too shallow to discriminate between these SEDs and those rising at 24 . For 18.5 of the sample the SEDs show a peak at 1-3 , a decline and then a rise at .
The SED classification can be compared with the optical spectroscopic identification. Power-law SEDs trace BL AGN. NOT BL AGNs show a variety of SED shapes, only 26 of them being power-laws. The correspondence between SED and spectroscopic classification is summarized in Table 1. In the redshift interval z=0.8-1.5, sources with a power-law SED are the dominant population at high luminosity ( erg s-1 ), making up 82 of the sample. Conversely, for erg s-1 power-laws are only 47 of the total population. The R magnitude and 2-10 keV flux distributions of the power-law sources without redshift and of the BL AGNs are different, the former being shifted towards fainter magnitudes (the Kolmogorov-Smirnov test probability that they are drawn from the same parent population is 0.1). This is related to the magnitude selection of the spectroscopic targets. The same holds for the NOT power-law sources with and without redshift. This selection effect must be taken into account when using the spectroscopic sample to compute luminosity functions or other evolution related quantities.
| Blue PL | Red PL | ET | IR-excess | |
|---|---|---|---|---|
| BL AGN | 61 | 14 | 4 | 11 |
| NOT BL AGN | 15 | 15 | 27 | 38 |
| No Class | 43 | 28 | 28 | 35 |
| Total | 119 | 57 | 59 | 84 |
PL=power-law SED, ET=early-type-like.
 |
 |
4.4 Average SEDs
Figure 10, upper panel, shows the average rest-frame SED for the sources spectroscopically classified as BL AGN and NOT BL AGN, for which we computed the intrinsic rest-frame monochromatic luminosity for each photometric data point available. The average and dispersion were computed taking into account the upper limits on the fluxes in each band following Schmitt (1985). The error on the mean and the dispersion are shown as dashed and solid error-bars, respectively. The average SED of the BL AGN resembles a power-law, and the UV luminosity is consistent with the presence of an unobscured active nucleus. Indeed 3/4 of the BL AGNs have a power-law SED. Conversely, NOT BL AGNs show an average SED dominated by the galaxy stellar light, with a peak at 1 and a decline long-wards of 1-2 , suggesting that the putative active nucleus is highly obscured. The rise of the continuum above 10 suggests that the far-infrared emission starts to be dominated by the AGN emission.
4.5 Extended X-ray sources
Seven extended sources have been identified in the field by Puccetti et al. (2006). For six of these sources we determined the cluster redshift from the optical spectrum of the brightest cluster galaxy. For the cluster XMMES1_374 a photometric redshift is available. Six out of seven of the optical counterparts have a SED dominated by the stellar emission, as expected from the cluster CD galaxies, and show a peak in the K band (six galaxies have K16.2). Five sources show an optical spectrum typical of early-type galaxies, without emission features. Only XMMES1_184 shows strong emission lines in its spectrum (H, H and [OIII]). The results are summarized in Table 2. The spectroscopic redshifts agree with the photometric ones in Puccetti et al. (2006) within the errors, except for the source XMMES1_363. For these two clusters we give a new estimate of the 0.5-10 keV luminosity based on the newly determined spectroscopic redshifts (see Table 2). L(0.5-10 keV) is calculated using the total band fluxes and temperature values reported in Puccetti et al. (2006), a thermal bremsstrahlung model without absorption, and the newly determined redshifts. Interestingly, four extended sources have redshift 0.39, which corresponds to the highest peak in the spectroscopic redshift distribution of both X-ray (Figure 5) and K-selected sources (Sacchi et al. 2008), suggesting the presence of a significant large scale overdensity.
| Source name | R | K | F(0.5-10 keV) | z | logLX |
|---|---|---|---|---|---|
| mag | mag | c.g.s | erg s-1 | ||
| XMMES1_145 | 16.9 | 13.7 | 1.46e-13 | 0.223 | 43.3 |
| XMMES1_148 | 17.5 | 14.3 | 6e-15 | 0.278 | 42.1 |
| XMMES1_184 | 20.6 | 18.4 | 8e-15 | 0.3877 | 42.6 |
| XMMES1_224 | 17.8 | 14.2 | 1.43e-13 | 0.3925 | 43.9 |
| XMMES1_363 | 20.2 | 16.2 | 1.6e-14 | 0.6338 | 43.4 |
| XMMES1_374 | 19.3 | 16.0 | 1.2e-14 | 0.40* | 42.8 |
| XMMES1_444 | 18.3 | 14.7 | 2.5e-14 | 0.396 | 43.1 |
(* photometric redshift)
5 Multiwavelength properties
 |
 |
 |
 |
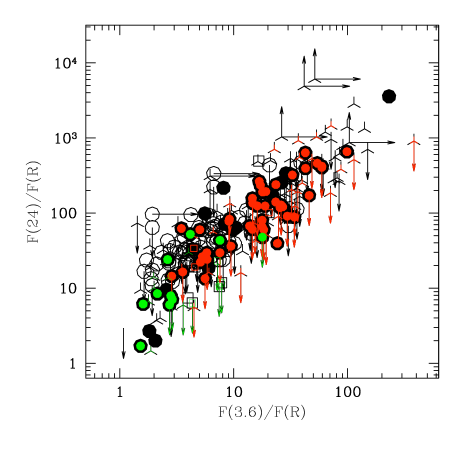 |
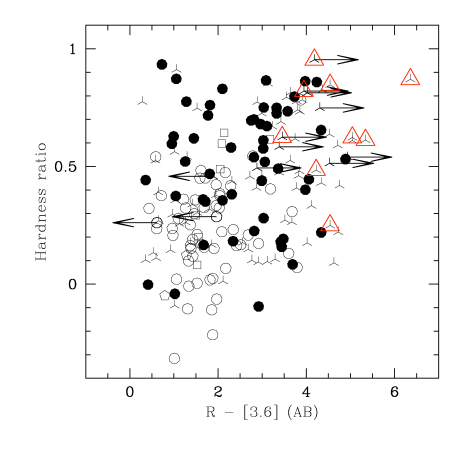
Figure 11 shows the hardness ratio as a function of the color of the sources drawn from the 2-10 keV sample. BL AGNs (open circles) are significantly softer than NOT BL AGNs (filled circles), with median vs. , respectively, in agreement with Perola et al. (2004). The same figure shows that BL AGNs have, on average, bluer colors compared to NOT BL AGNs, with median =1.71[0.41] for BL, and median for NOT BL AGNs, in agreement with Brusa et al. (2007). The reddest NOT BL sources are, on average, found at higher redshift with respect to bluer sources of the same class: median for , versus a median for the NOT BL sources with bluer colors. In the same plot we also show the sources with F(24 )/F(R) as open triangles. These sources are among the reddest of the sample, and they have, on average, harder X-ray colors compared to those with F(24 )/F(R) . They show a median ), which corresponds to an intrinsic absorbing column at . Four out of nine have , and three have compatible with within the errors ( at ). Among the sources with , 27 have F(24 )/F(R) . Conversely of the sources with have F(24 )/F(R) .
Figure 12, upper panel, shows X/O versus the 2-10 keV luminosity for the 2-10 keV sources with either a spectroscopic or a photo-z. NL sources (filled symbols) follow the Fiore et al. (2003) correlation between X/O and . BL AGNs (open symbols) do not show any correlation. 47 sources of the 2-10 keV sample have X/O8. Twenty of these have a redshift, either spectroscopic or photometric. Eleven out of 16 of the sources with a spectroscopic redshift are NOT BL AGNs, and all have 2-10 keV luminosity higher than 6.6 erg s-1 (ranging from log to ). Other four sources have a photometric redshift, and their X/O together with their SED makes them bona fide NL AGN. The NL AGN with the highest luminosity is XMM 453 with and log (see Figure 6 for its optical spectrum). It has HR=0.67, corresponding to a rest frame N cm-2. This source can therefore be considered an example of type 2 QSO. Other similar objects are XMM 153 (z, log and N), XMM 101 (z, log and N) , XMM 121 (z, log and N). The ELAIS-S1 sample confirms that high luminosity type 2 AGN can be efficiently selected among the sources with X/O. However, 67 of the sources with X/O remain spectroscopically unidentified due to their faint optical magnitudes (1/3 of them are fainter than and 2/3 have an average R=24.2). The sources with the highest X/O values show also the highest F(24 )/F(R) ratios (Figure 12, lower panel), which is itself a proxy for obscuration. Indeed, recent results indicate that Compton-thick AGN, detected in only very small numbers even in the deepest hard X-ray surveys, are efficiently selected among sources with AGN luminosity in the mid-infrared, and faint optical or near-infrared emission (see for example Weedman et al. (2006)). Fiore et al. (2008) found that the majority (70 to 90) of the sources with extreme F(24 )/F(R) ratio are likely to be highly obscured QSO. The sources that show the highest X/O and F(24 )/F(R) values are XMM 63 and XMM 123. These sources have very faint optical counterparts and therefore we could not measure their redshift through optical spectroscopy nor SED fitting. It is interesting to note that they are also among the hardest sources in the sample, with HR=0.95 and 0.82, respectively.
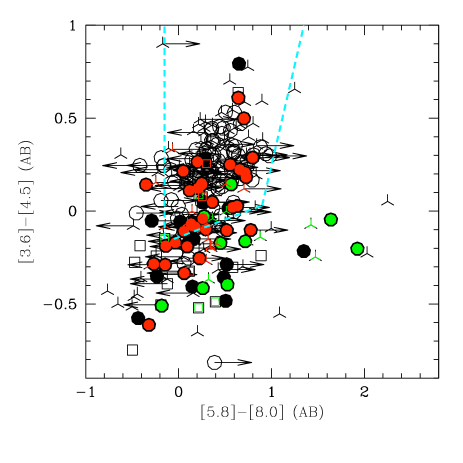
Figure 13 (top panel) presents an IRAC color-color plot (Stern et al., 2005), where we show the X-ray sources which have a detection in at least two IRAC bands. About 2/3 of the 0.5-10 keV sample without considering upper limits (1/3 of the sources with a detection in the four IRAC bands) lies outside of the AGN region (dashed line), which is populated by almost all BL AGN and NOT BL AGN with high-luminosity ( erg cm-2 s-1, red symbols). Low-luminosity NOT BL AGNs ( erg cm-2 s-1, green symbols) occupy an oblique stripe in the lower part of the diagram, with a broad range of [5.8]-[8.0] color (0[5.8]-[8.0]2), reflecting a SED with a minimum within the IRAC range. The sources with [5.8]-[8.0]1 are optically bright galaxies with redshift in the range 0.1-0.3, for the PAH emission features at 6.2 and 7.7 are strong and redshifted in the 8.0 IRAC band. Their rest-frame U-V color is about 1.5, suggesting a moderate star formation activity. This is confirmed by their moderate F24/F(K) ratio. These objects are therefore likely to be low-luminosity AGN in moderate star forming galaxies. The low luminosity NOT BL AGNs with [5.8]-[8.0]1 also have z0.3 and they are hosted in somewhat less active galaxies (U-V 2). In the region [5.8]-[8.0]0 and [3.6]-[4.5]0 we identified 5 early type galaxies at redshift between 0.28 and 0.72 with very little or no [OII] emission (XMM 84, 214, 430,149, 317). Their 0.5-2 keV X-ray luminosity ranges from 1042 and 1042.7 erg s-1 . Four of these galaxies are covered by Chandra observations, and all of them are detected. In three cases the emission is unresolved and centered on the galaxy nucleus. These could therefore be XBONG (Comastri et al., 2002). In one case the emission is slightly elongated or due to two blended sources (Civano et al., 2007).
High luminosity NOT BL AGNs are found at a systematically higher redshift (85 in the range z0.6-1.4), At these redshifts the V rest frame is shifted within the observed J band. Unfortunately, J magnitudes are available only for a small fraction of the sources due to an incomplete coverage of the field. Therefore we could derive U-V rest frame colors for only half of the high-luminosity NOT BL AGNs. Nevertheless, they indicate a moderate star forming galaxy also in these cases. To further investigate the galaxy colors of this source sample, we plot in Figure 13, bottom panel, the correlation between F(24 )/F(R) and F(3.6 )/F(R) . High luminosity sources span a wide range of F(24 )/F(R) and F(3.6 )/F(R) , reaching values close to F(24 )/F(R) =103. Note that both colors are systematically higher than those of low-luminosity AGN. The high F(24 )/F(R) can be due to AGN emission dominating the 24 band. The quality of our photometry is not good enough to understand whether the red [3.6]-R color is due to a passive host or to a dusty star-forming galaxy.
6 Summary
We have presented the optical and infrared identifications of 478 X-ray sources detected by XMM–Newton in the central 0.6 deg2 of the ELAIS-S1 field. The identification process was validated by precise (arcsec) source positions obtained with Chandra in a fraction of the area covered by the XMM–Newton survey. We found that Chandra observations are crucial to identify the correct counterpart for optically faint sources. Comparing the Chandra identifications with the IRAC ones, we find that the latter miss only 4 of the real counterparts. Therefore, we feel confident to use the IRAC identifications for the area not covered by Chandra.
We compiled a multiwavelength catalogue, with photometric data ranging from the mid-infrared to the optical bands. We obtained optical spectra to measure redshifts and to obtain a first classification of the counterparts. The spectroscopy was performed using VIMOS/VLT, FORS2/VLT and EFOSC/ESO3.6m. We obtained reliable redshifts and classification for 237 sources with optical counterparts brighter than R24. 47 of the sample turned out to be broad-line AGNs, while the other sources are narrow-line AGNs (12), ELGs (27) and absorption-line galaxies (8). We find 47 sources showing F(2-10 keV)/F(R) 8 (23 of the 2-10 keV sample) . Out of the 16 spectroscopically identified sources with F(2-10 keV)/F(R) 8, 11 (70) turned out to be type 2 QSOs at z=[0.9-2.6], with log43.8 erg s-1 . All these type 2 QSO have hard X-ray colors, suggesting large absorbing columns at the rest frame. The ELAIS-S1 sample therefore confirms that type 2 QSOs are efficiently selected among the sources with high F(2-10 keV)/F(R) .
We classified empirically the broad band SEDs of the X-ray sources, from pure power-laws to galaxy-dominated SEDs. We find a generally good agreement between the SED classification and the optical spectroscopy. 80 of the BL AGNs have power-law SEDs, and 71 of the sources with a power-law SED and a spectroscopic redshift are classified as BL AGNs.
Broad band SEDs have also been used to compute photometric redshifts. Reliable photometric redshifts were obtained for a sample of 68 sources without a spectroscopic redshift and which show a SED dominated by the host galaxy stellar light.
We computed average rest-frame SEDs, finding that BL and NOT BL AGNs show similar L10μm/L(2-10 keV) ratios (0.4 in logarithm), and consistent with Pozzi et al. (2007).
By comparing near-infrared colors, we find that low luminosity NOT BL AGNs (log43 erg s-1 ) are hosted in star forming galaxies, which show bluer rest-frame U-V and R-[3.6 ] colors. High-luminosity NOT BL AGNs hosts (log43 erg s-1 ) have, on average, redder R-[3.6 ] colors. This colors can be due either to a dusty star-forming host galaxy, or to a passive early-type host (Pozzi et al. (2007), Mignoli et al. (2004)), but the quality of our photometry does not allow us to distinguish between the two. Deeper multiwavelength surveys, such as COSMOS and GOODS, are needed to asses the nature of these objects.
Acknowledgements.
We are grateful to Bianca Garilli and Marco Scodeggio for the support provided in running the VIPGI pipeline, and to Mary Polletta for providing template SED. This work is based on observations made with the Spitzer Space Telescope, which is operated by the Jet Propulsion Laboratory, California Institute of Technology under a contract with NASA. We aknowledge financial contribution from contract ASI-INAF I/023/05/0, PRIN-MUR grant 2006-02-5203 and the ANR grant D-SIGALE ANR-06-BLAN-0170.Appendix A Multiband catalog
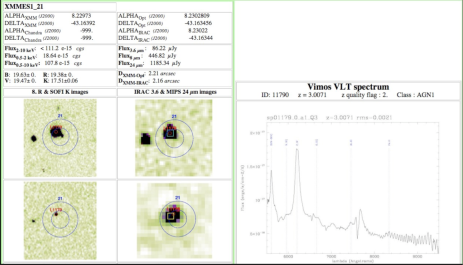
Table 3 summarizes the entries of the catalogue of the 478 X-ray sources with multiwavelength data in 10 photometric bands, from B to MIPS 24 . The complete catalogue is available in ascii format in the online version, or can be accessed at the following URL: http://www.oa-roma.inaf.it/ELAIS-S1/, along with image thumbnails of the counterparts in four bands (R, K, IRAC 3.6 and MIPS 24 ) and the optical spectrum where available. Columns 1 to 11 present the X-ray data of the source: the XMM–Newton source name, the and (J2000) XMM positions, the 0.5-10, 2-10 and 0.5-2 keV fluxes and the respective S/N ratios as in the Puccetti et al. (2006) catalogue, and the Chandra positions. Columns from 12 to 18 give the optical and near-infrared J and K band photometric data (R, J, K Vega magnitudes, magnitudes below the detection limit are negative). Columns 20 to 28 give the coordinates and flux densities in the four IRAC channels and MIPS 24 channel, in Jy). Columns 29 to 33 report the SED, source redshift and classification. Figure 14 shows an example of the online pages.
 |
| 1 | NAME | XMM source name |
| 2 | RA_X | XMM Right Ascension (J2000) |
| 3 | DEC_X | XMM Declination (J2000) |
| 4 | F(0.5-10 keV) | 0.5-10 keV Flux [cgs/1e-15] |
| 5 | S/N | S/N Ratio at 0.5-10 keV |
| 6 | F(2-10 keV) | 2-10 keV Flux [cgs/1e-15] |
| 7 | S/N | S/N Ratio at 2-10 keV |
| 8 | F(0.5-2 keV) | 0.5-2 keV Flux [cgs/1e-15] |
| 9 | S/N | S/N Ratio AT 0.5-2 keV |
| 10 | RA_Xch | Chandra Right Ascension (J2000) |
| 11 | DEC_Xch | Chandra Declination (J2000) |
| 12 | RA_R | R band Right Ascension (J2000) |
| 13 | DEC_R | R band Declination (J2000) |
| 14 | R | R magnitude [Vega mag] |
| 15 | PROB | R band chance coincidence prob. |
| 16 | DD_OPT | XMM-Optical displacement [arcsec] |
| 17 | J | J band magnitude [Vega mag] |
| 18 | K | K band magnitude [Vega mag] |
| 20 | RA_IRAC | IRAC Right Ascension (J2000) |
| 21 | DEC_IRAC | IRAC Declination (J2000) |
| 22 | FLUX_36 | IRAC 3.6 flux [Jy] |
| 23 | FLUX_45 | IRAC 4.5 flux [Jy] |
| 24 | FLUX_58 | IRAC 5.8 flux [Jy] |
| 25 | FLUX_80 | IRAC 8.0 flux [Jy] |
| 26 | FLUX_24 | MIPS 24 flux [Jy] |
| 27 | DD_IR | XMM-IRAC displacement [arcsec] |
| 28 | PROB IR | 3.6 chance coincidence prob. |
| 29 | SED | Spectral Energy distribution |
| 30 | Z | Spectroscopic redshift |
| 31 | QUAL | redshift quality flag |
| 32 | CLASS | source classification |
| 33 | ZPHOT | Photo-z |
References
- Armus et al. (2007) Armus, L., et al. 2007, ApJ, 656, 148
- Berta et al. (2006) Berta, S., et al. 2006, A&A, 451, 881
- Damiani et al. (1997) Damiani, F., Maggio, A., Micela, G., & Sciortino, S. 1997, ApJ, 483, 350
- Bertin & Arnouts (1996) Bertin, E., & Arnouts, S. 1996, A&AS, 117, 393
- Bertin (2003) Bertin, E. 2003, SWarp Resample and Coadd Software
- Brandt & Hasinger (2005) Brandt, W. N. and Hasinger, G. 2005 ARA&A, 43, 827B
- Brusa et al. (2007) Brusa, M., et al. 2007, ApJS, 172, 353
- Brusa et al. (2005) Brusa, M., et al. 2005, A&A, 432, 69
- Caccianiga et al. (2007) Caccianiga, A., Severgnini, P., Della Ceca, R., Maccacaro, T., Carrera, F. J., & Page, M. J. 2007, A&A, 470, 557
- Civano et al. (2007) Civano, F., et al. 2007, A&A, 476, 1223
- Cocchia et al. (2007) Cocchia, F., et al. 2007, A&A, 466, 31
- Comastri et al. (2002) Comastri, A., et al. 2002, ApJ, 571, 771
- Croton et al. (2006) Croton, D. J., et al. 2006, MNRAS, 365, 11
- Daddi et al. (2007) Daddi, E., et al. 2007, ApJ, 670, 173
- Di Matteo et al. (2005) Di Matteo, T., Springel, V., & Hernquist, L. 2005, Nature, 433, 604
- Eckart et al. (2006) Eckart, M. E., Stern, D., Helfand, D. J., Harrison, F. A., Mao, P. H., & Yost, S. A. 2006, ApJS, 165, 19
- Elvis et al. (1994) Elvis, M., et al. 1994, ApJS, 95, 1
- Fazio et al. (2004) Fazio, G. G., et al. 2004, ApJS, 154, 39
- Ferrarese & Merritt (2000) Ferrarese, L., & Merritt, D. 2000, ApJ, 539, L9
- Fiore et al. (2003) Fiore, F., et al. 2003, A&A, 409, 79
- Fiore et al. (2008) Fiore, F., et al. 2008, ApJ, 672, 94
- Fontana et al. (2000) Fontana, A., D’Odorico, S., Poli, F., Giallongo, E., Arnouts, S., Cristiani, S., Moorwood, A., & Saracco, P. 2000, AJ, 120, 2206
- Fontana (2001) Fontana, A. 2001, Astrophysics and Space Science Supplement, 277, 535
- Gebhardt et al. (2000) Gebhardt, K., et al. 2000, ApJ, 539, L13
- Granato et al. (2004) Granato, G. L., De Zotti, G., Silva, L., Bressan, A., & Danese, L. 2004, ApJ, 600, 580
- Granato et al. (2001) Granato, G. L., Silva, L., Monaco, P., Panuzzo, P., Salucci, P., De Zotti, G., & Danese, L. 2001, MNRAS, 324, 757
- Houck et al. (2005) Houck, J. R., et al. 2005, ApJ, 622, L105
- Lacy et al. (2004) Lacy, M., et al. 2004, ApJS, 154, 166
- La Franca et al. (2004) La Franca, F., et al. 2004, AJ, 127, 3075
- La Franca et al. (2005) La Franca, F., et al. 2005, ApJ, 635, 864
- LeFevre et al. (2003) LeFevre, O., et al. 2003, Proc. SPIE, 4841, 1670
- Lonsdale et al. (2003) Lonsdale, C. J., et al. 2003, PASP, 115, 897
- Lonsdale et al. (2004) Lonsdale, C., et al. 2004, ApJS, 154, 54
- Menci et al. (2006) Menci, N., Fontana, A., Giallongo, E., Grazian, A., & Salimbeni, S. 2006, ApJ, 647, 753
- Mignoli et al. (2004) Mignoli, M., et al. 2004, A&A, 418, 827
- Perola et al. (2004) Perola, G. C., et al. 2004, A&A, 421, 491
- Polletta et al. (2007) Polletta, M., et al. 2007, ApJ, 663, 81
- Pozzi et al. (2007) Pozzi, F., et al. 2007, A&A, 468, 603
- Puccetti et al. (2006) Puccetti, S. et al. 2006, A&A, 457, 501
- Scodeggio et al. (2005) Scodeggio, M., et al. 2005, PASP, 117, 1284
- Schlegel et al. (1998) Schlegel, D. J., Finkbeiner, D. P., & Davis, M. 1998, ApJ, 500, 525
- Schmitt (1985) Schmitt, J. H. M. M. 1985, ApJ, 293, 178
- Silva et al. (2004) Silva, L., Maiolino, R., & Granato, G. L. 2004, MNRAS, 355, 973
- Stern et al. (2005) Stern, D., et al. 2005, ApJ, 631, 163
- Surace & SWIRE (2004) Surace, J. A., & SWIRE 2004, Bulletin of the American Astronomical Society, 36, 1450
- Ueda et al. (2003) Ueda, Y., Akiyama, M., Ohta, K., & Miyaji, T. 2003, ApJ, 598, 886
- Weedman et al. (2006) Weedman, D., et al. 2006, ApJ, 653, 101