The young Galactic star cluster [DBS2003] 179 ††thanks: Based on observations collected with the Very Large Telescope of the European Southern Observatory within the Observing Program 79.D-0149(A).This paper includes data gathered with the 6.5 meter Magellan Telescopes located at Las Campanas Observatory, Chile.
Abstract
Context. Recent near- and mid-infrared surveys have brought evidence that the Milky Way continues to form massive clusters.
Aims. We carry out a program to determine the basic physical properties of the new massive cluster candidate [DBS2003] 179.
Methods. Medium-resolution K-band spectra and deep near-infrared images of [DBS2003] 179 were used to derive the spectral types of eight member stars, and to estimate the distance and reddening to the cluster.
Results. Seven of ten stars with spectra show emission lines. Comparison with template spectra indicated that they are early O-type stars. The mean radial velocity of the cluster is Vrad=776 km s-1. Knowing the spectral types of the members and the color excesses, we determined extinction 16.6 and distance modulus ()014.5 mag (D7.9 Kpc). The presence of early O-stars and a lack of red supergiants suggests a cluster age of 2-5 Myr. The total cluster mass is approximated to 0.7104 and it is not yet dynamically relaxed.
Conclusions. The candidate [DBS2003] 179 further increases the family of the massive young clusters in the Galaxy, although it appears less massive than the prototypical starburst clusters.
Key Words.:
open clusters and associations: general — open clusters and associations: individual ([DBS2003] 179) — infrared: stars — stars: formation — stars: early-type1 Introduction
Why does our Galaxy contain only a few very massive young clusters? A cluster with an initial mass of is expected to disrupt in about 5 Gyrs, while a cluster has a lifetime well in excess of Hubble time (Lamers et al. 2005). According to Larsen (2006), the disk should then contain about 500 clusters with masses greater than and 80 clusters with M formed over its lifetime. Excluding the Galactic center region, only three very massive young clusters are known: Westerlund 1 (Clark et al. 2005), RSGC1 (Figer et al. 2006), and RSGC2 (Davies et al. 2007). They have masses in the range - and ages of years. The low number of such clusters in our Galaxy was interpreted by Larsen (2006) either as a truncation of the cluster initial mass function (CIMF) in the vicinity of , or that the Galaxy’s CIMF slope is much steeper than the power-law slope of 2 seen in other galaxies. Thus, the questions of the recent star formation in the disk of our Galaxy and the slope of the CIMF are still unanswered. Several approaches can be used: a detailed investigation of the CIMF (Portegies Zwart et al. 2007, Dowell et al. 2008, Stolte et al. 2005, etc.); an accurate estimation of the disruption effects (Lamers et al. 2005); and finally a study to find out if the cluster mass distribution is really independent of the star formation history (Portegies Zwart et al. 2006).
More than 2000 infrared “hidden” star cluster candidates have been discovered in the last 5-6 years from all-sky IR surveys such as the 2 MASS (Skrutskie et al. 1997) and the Spitzer Space Telescope Galactic Legacy Infrared Mid-Plane Survey Extraordinaire (GLIMPSE, Benjamin et al. 2003) and can be used to test the recent star formation in the Galaxy.
This work is a part of a larger program aimed at characterizing the hidden current star population in the Galaxy (Ivanov et al. 2002, 2005; Borissova et al. 2003, 2005, 2006; Kurtev el al. 2007). Our main goal is to determine if the Milky Way still forms fairly massive star clusters at a rate similar to the rate seen in other normal spiral galaxies (Larsen 2002).
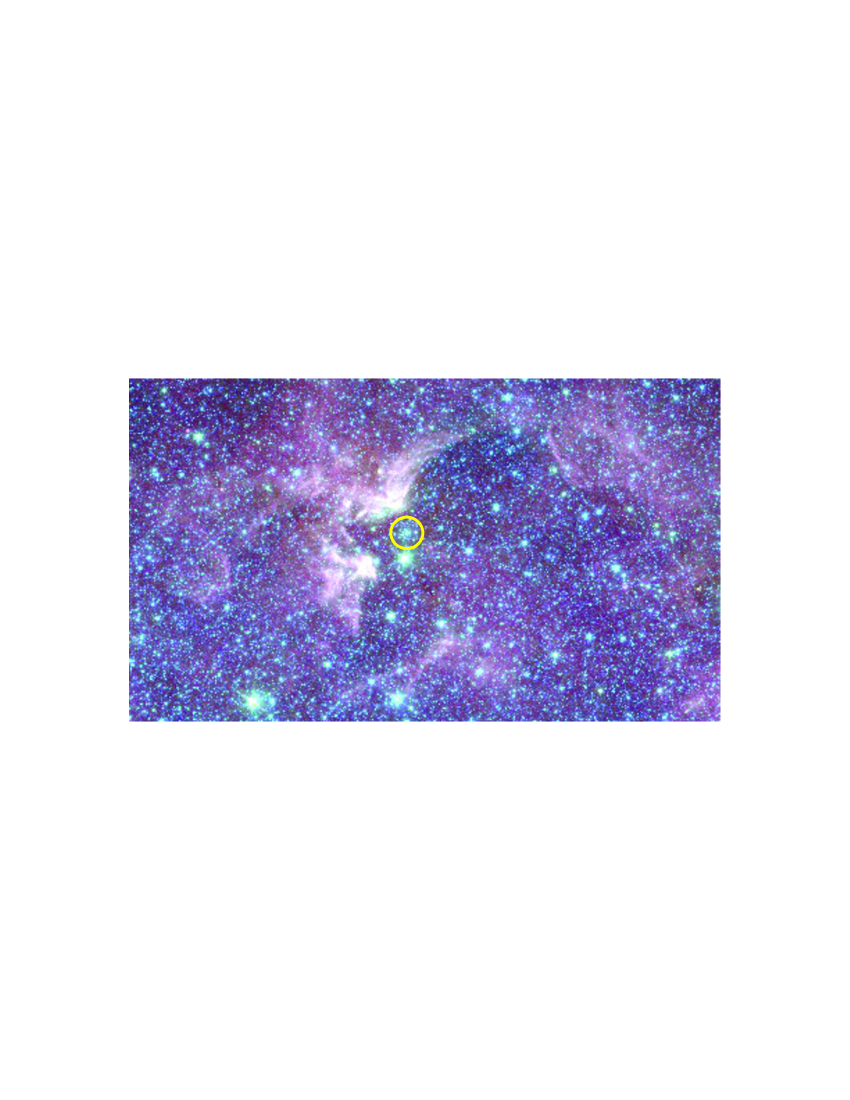
The open cluster candidate [DBS2003] 179 was discovered by Dutra et al. (2003) via visual inspection of 2 MASS images during their survey of embedded clusters in the areas of known radio and optical nebulae. The cluster is located in the direction toward the HII ionized region G347.6+0.2 (Fig. 1). Caswell & Haynes (1987) measured peak brightest temperature of 5 K at 5 Ghz continuum and angular size of 9 arcmin for G347.6+0.2.
Borissova et al. (2005; hearafter Paper I) obtained high quality infrared (IR) photometry and confirmed that [DBS2003] 179 is a member of the large family of “newly” discovered heavily obscured clusters. Based on the photometric analysis and on the so called “10th brightest star method” (Dutra et al 2003a), they determined some of the cluster parameters: =19, ()0=13.5 mag, age of 7 Myr, and total mass of 5.5103 . Thus, the cluster seems to be young and moderately massive.
However, the photometry alone is not sufficient to derive an accurate distance to the star cluster and the uncertainty of the 10th brightest star method can easily be as large as ()02.5 mag or a factor of 10 in distance (see the discussion in Paper I). To obtain more accurate physical parameters for this cluster we embarked on a project to determine the spectral types of some of the cluster members using K-band spectroscopic observations.
The next section describes the data. In the third section, we present the spectral classification of the observed stars and their radial velocities. In Sect. 4 the cluster parameters and the total mass of the cluster are determined. The last section is a summary of the results.
2 Observations and data reduction
We carried out near-IR broad and narrow band imaging on Aug 2, 2003 with the near-IR imager Persson’s Auxiliary Nasmyth Infrared Camera (PANIC) at the 6.5-meter Baade telescope at the Las Campanas Observatory. The instrument uses a 10241024 HgCdTe Hawaii detector array. The scale is 0.125 arcsec , giving a total field of view of 2.12.1 arcmin. The Br filter is centered on 2.165m and has a width of 0.03 m. The images are reduced following the “standard” procedures for the IR, the photometry is obtained using the DAPHOT package within Image Reduction and Analysis Facility (IRAF)111IRAF is distributed by the National Optical Astronomy Observatories, which are operated by the Association of Universities for Research in Astronomy, Inc., under cooperative agreement with the National Science Foundation. and the typical photometric uncertainties are 0.05-0.06 mag. We refer the reader to Paper I for more details. Since the goal of the narrow-band observations was to select the sources with IR excess, no flux standards were taken and no attempt was made to transform the Br instrumental magnitudes to any standard system.
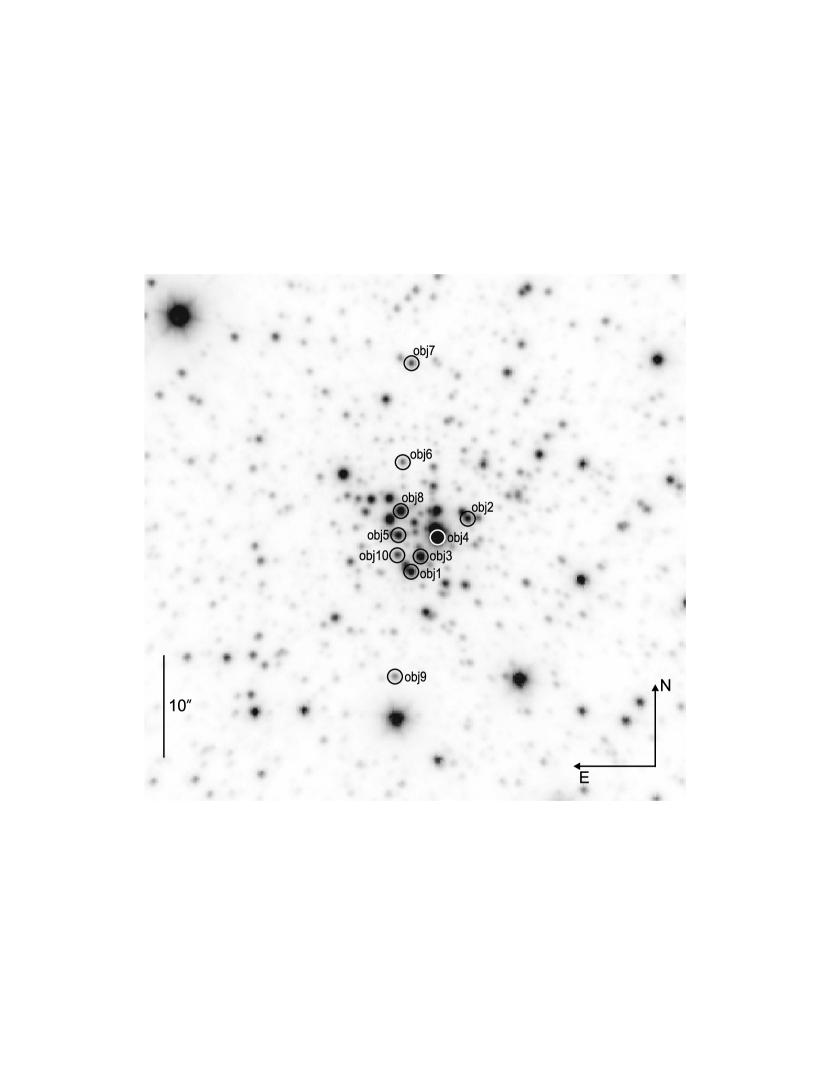
Based on their position in the statistically-decontaminated near-IR color-magnitude diagram given in Paper I, four probable members of the [DBS2003] 179 were selected for follow-up spectroscopy. Two of them were among the brightest objects and the rest are chosen to be the 8th and 10th brightest cluster members. Medium-resolution (=9000) K-band spectra were obtained with Infrared Spectrometer And Array Camera (ISAAC) (Moorwood et al. 1998) on the ESO VLT at Paranal, Chile in service mode, in May 2007. We used the SWS1-SW mode, 0.3 arcsec wide slit, and the grating was centered at 2.134 m. Two radial velocity standards HD191639 (B1V, Vrad=7 km s-1) and HD167785(B2V, Vrad=10.6 km s-1) were also observed with an identical spectroscopic set up. We observed with two slit positions. The exposure times were 20 min, the seeing during the observations was less than 1 arcsec. However, some additional stars fell into the long slit (120 arcsec length). We present spectra of ten stars in total for the two slit positions (Fig. 2). Their coordinates and magnitudes are given in Table 1. The near-IR magnitudes are from Paper I. The Br instrumental magnitudes are from this work. The mid-IR magnitudes are from the Galactic Legacy Infrared Mid-Plane Survey Extraordinaire (GLIMPSE; Benjamin et al. 2003) archive. The “sat.” marks a saturated star.
| Object | RA(J2000) | DEC(J2000) | [3.6] | [4.5] | [5.8] | [8.0] | ||||
|---|---|---|---|---|---|---|---|---|---|---|
| hh:mm:ss | deg:mm:ss | mag | mag | mag | ins.mag | mag | mag | mag | mag | |
| obj1 | 17:11:32.14 | -39:10:49.74 | 14.03 | 12.27 | 11.55 | 15.56 | 9.717 | 9.378 | 9.397 | 9.181 |
| obj2 | 17:11:31.73 | -39:10:44.28 | 14.83 | 12.92 | 11.96 | 16.03 | ||||
| obj3 | 17:11:32.03 | -39:10:48.76 | 13.63 | 11.93 | 11.32 | 15.19 | ||||
| obj4 | 17:11:31.89 | -39:10:47.15 | 12.25 | sat. | sat. | 13.24 | 7.657 | 7.320 | 7.154 | 7.030 |
| obj5 | 17:11:31.85 | -39:10:50.77 | 14.23 | 12.55 | 11.80 | 15.89 | ||||
| obj6 | 17:11:31.27 | -39:10:50.10 | 16.69 | 14.54 | 13.43 | 17.51 | ||||
| obj7 | 17:11:30.48 | -39:10:48.94 | 15.62 | 13.78 | 12.90 | 17.14 | 11.942 | 11.766 | 11.598 | |
| obj8 | 17:11:31.65 | -39:10:50.46 | 14.06 | 11.99 | 11.07 | 14.99 | ||||
| obj9 | 17:11:33.31 | -39:10:51.55 | 13.23 | 10.33 | 8.911 | 13.10 | 7.991 | 7.950 | 7.610 | 7.500 |
| obj10 | 17:11:32.00 | -39:10:50.89 | 15.51 | 13.59 | 12.68 | 16.86 |
The spectra were dark-subtracted and flat-fielded using the ESO ISAAC pipeline. To correct for telluric emission the object was “nodded” between two positions on the slit (A and B) so that the background of position A is recorded while the source is at position B and is subtracted from the observation when the source is at position A, and vice-versa. The offset between the A and B positions was chosen to avoid source overlap. The spectra were extracted using the IRAF task apall. For each position along the slit a night sky spectrum was extracted with the same extraction parameters. The wavelength calibration of the spectra are performed with the imprinted sky emission lines. The accuracy of the wavelength calibration is 5-7 km s-1. Telluric absorption lines were removed using the telluric star Hip 087164 of spectral type B2, observed under identical sky conditions and using the method described in Hanson el al. (1996, 2005) and Bik et al. (2005, 2006). First, the photospheric lines (Br and HeI) in the spectrum of the telluric B standard was divided out. We did this with the template spectrum of the B2 star HD36166 from the spectral atlas of Hanson et al. (2005). The error on the resulting Br equivalent width (EW) of our target star is about 10 %. After the removal of the stellar lines from the telluric standard star we remove the telluric lines from the program objects by taking the ratio of the target spectrum with this telluric spectrum. We did the telluric-line correction using the IRAF task telluric, which allows for a shift in wavelength and a scaling in line strength yielding a more accurate fit. The task uses a cross-correlation procedure to determine the optimal shift in wavelength and the scaling factor in line strength. The shifts are usually less than one pixel (1 pixel corresponds to 17 km s-1).
3 Reddening and spectral classification of the spectroscopic targets
3.1 Reddening
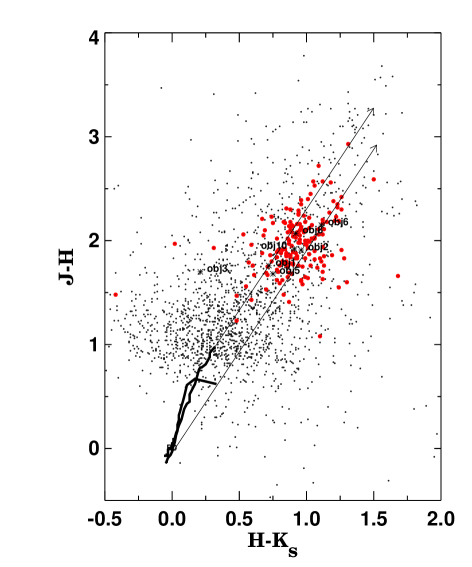
Typically, the location of the stars in the color-color diagrams such as vs. allow us to separate between cluster members and field red giants and to estimate their individual extinction values. The two color diagram of all stars in our field of view is shown in Fig. 3. The most probable statistically-selected cluster members taken from Paper 1 are plotted with large filled circles. They are determined using a comparison field, with an area equal to that of the cluster. The solid lines represent the unreddened sequence of stars of luminosity classes I and V, taken from Koornneef (1983) and Schmidt-Kaler (1982). The majority of the cluster members occupy a well-defined locus in this diagram at 0.7-0.8 and 2 mag.
The intrinsic and color of OB stars vary between 0.05 and 0.2 (Schmidt-Kaler 1982, Koornneef 1983). Furthermore, the calibrations of Martins & Plez (2006) give the same colors for the O3I-O9I; the O3III-O9III and the O3V-O9V type stars: ()0=0.21, ()0=0.11, ()0=0.1. We use these to calculate the individual color excesses of the spectroscopically-classified stars: E(), E() and E() are given in Table 2. We calculated the E(B-V) using the color excess ratios of E(), E(), and E() from Bessell et al. (1998) and Mathis (1990). The errors of E(B-V) reddening determination given in Col. 6 are calculated as a standard deviation of the mean value and quadratically added errors from photometry and the variance due to different intrinsic estimations. In the last column of Table 2 the extinction corrected magnitude are given. We adopted E()=5.2 for the mean reddening of the cluster and thus =16.64, using the standard reddening low.
| Object | E() | E() | E() | E() | ||
|---|---|---|---|---|---|---|
| obj1 | 2.67 | 2.00 | 0.77 | 4.69 | 0.22 | 9.90 |
| obj2 | 3.06 | 2.15 | 1.01 | 5.47 | 0.09 | 10.04 |
| obj3 | 2.50 | 1.94 | 0.66 | 4.34 | 0.27 | 9.79 |
| obj5 | 2.62 | 1.92 | 0.80 | 4.64 | 0.16 | 10.17 |
| obj8 | 3.18 | 2.31 | 0.97 | 5.61 | 0.19 | 9.10 |
| obj10 | 3.02 | 2.16 | 0.96 | 5.27 | 0.13 | 10.79 |
3.2 Spectral classification
We performed a preliminary spectral classification of the program stars, using direct comparison of spectra between a star of known spectral and luminosity class and a star which is unknown. The appropriate template spectra of early stars are taken from spectral atlas of Hanson et al. (2005). Some of the spectra from this atlas are taken with the Subaru telescope and are of higher spectral resolution (=12000) and are rebinned to =9000. In general, our K-band spectra can be divided into two different classes: seven objects are emission line stars and in three of them we can identify only absorption lines.
Our spectral setting, centered at 2.134 m, contains the following lines for the hot stars: Brackett (4-7) 2.1661 m (Br); Heii 2.188 (7-10); Hei 2.1127 (PS, triplet), and 2.1138 (PS, singlet). Among the hottest stars, the Civ triplet () at 2.069, 2.078 and 2.083 is also seen. Hanson et al. (1996) identified the broad emission feature found at 2.1155m as Niii (7-8). Recently, Geballe et al. (2006 ) showed that O iii 2.116 m (8-7) transitions feature is an important contributor to the 2.11 m emission complex.
3.2.1 Stars showing emission lines
The spectra of the stars showing emission lines are shown in Figs. 4 and 5. The Equivalent Widths (EWs) of their emission lines are listed in Table 3. They are measured on the continuum normalized spectra, by the IRAF task splot, using the deblending function. The errors of the EW are estimated taking into account the signal-to-noise ratio (see Col. 2 of Table 3), the peak over continuum ratio of the line (see Bik et al. 2005) and the error from the telluric star subtraction and are estimated to be 10-15% in the worst cases. The EW of the emission lines are negative. The symbol “Em” given in Col. 1 of the Table 3 indicates that the line is in emission, “NP” means that the line is not present in the spectrum.
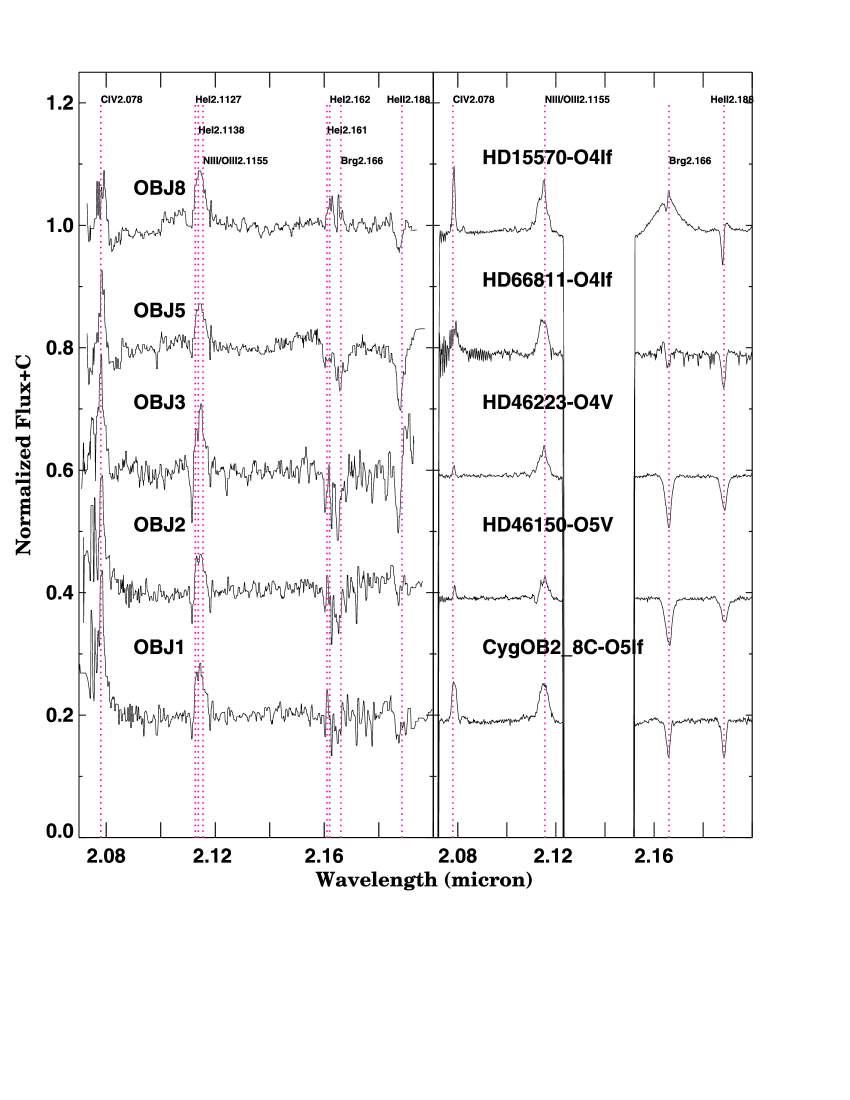
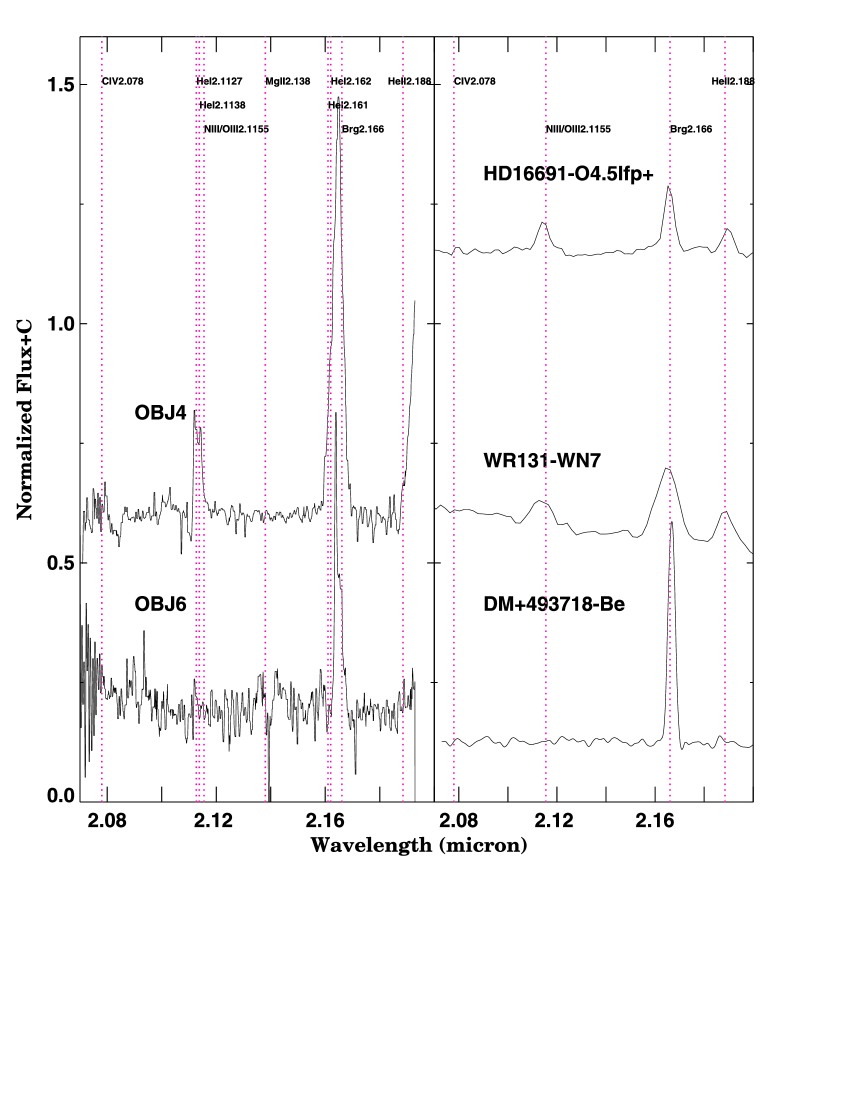
The Civ line is at the limit of our setup, where the errors are large and it is not given strong consideration. The Niii/Oiii emission complex appears in all these stars, except for Obj6, where it is not present. The Br line appears weakly in absorption in Obj1 (EW=0.8Å), moderately weak in absorption in Obj2, Obj3, and Obj5 (EW=3.4-3.7Å) and weakly in emission in Obj 8(EW=1.4Å). The Br line appears strongly in emission in Obj4 and Obj6, (EW=37.2Å and EW=12.1Å, respectively). The Heii 2.188 line is seen in absorption in Obj1, 2, 3, 5, and 8.
We derive the following spectral classification of our objects:
Object 1 and Object 2 are quite similar, given the limitation of the “edge” effects, where both the Civ 2.078 m and Heii 2.1885 m lines are compromised. The EW of the Niii/Oiii line of Obj1 is 2.8Å which, according to Hanson et al. (2005) defines the star as later than O3-O4, but not later than O6, when Hei would be much stronger and Civ line will not be present. The Br and Heii 2.188 m lines are almost equally strong. The extinction corrected magnitudes of the stars are 9.9 and 10.04 mag. Comparison with the smoothed to R=9000 Hanson et al. (2005) templates shows, that Obj1 and Obj2 are similar to CygOB28C-O5If and HD46150-O5Vf. Unfortunately, the S/N is not very high and for the most part in many spectral ranges, dwarfs, giants, and many supergiants look nearly the same. Our classification for Obj1 and Obj2 is early O5-O6 spectral type, but it is hard to distinguish between the luminosity class I and V.
Object 3 and Object 5 show Heii 2.188 m stronger than than in Obj1 and Obj2, and therefore, higher temperature. The stars are similar to HD66811-O4If and HD46223-O4Vf. Obj3 is slightly brighter than Obj1 and Obj2, while Obj5 is fainter. Our spectral classification is O4-O5, luminosity class I or V.
Object 4 shows Br and Hei lines in strong emission, the Heii line is at the very end of our setup and there is no Civ emission. Based on this spectrum, it is extremely hard to tell its spectral type. The star is saturated in our H and images and have no 2 MASS measurements because of crowding. We can estimate approximately its magnitude, using narrow-band Br and Spitzer 3.6 mag values (see Table 1). The mean from these estimations is 9.2 mag, which corrected for the mean extinction derived from Table 2 gives 0=7.4. That is a magnitude and half brighter than Obj 8, which is classified as ’evolved’ O4-O5 If supergiant (see below). So, Obj 4 is even more evolved from the main sequence and thus probably more massive (assuming co-eval star formation) than Obj 8. If what we see on the red part of the spectrum is really HeII 2.189, then the star is similar to WN7 objects (Fig. 4 of Figer et al. 1997, WR131). If, on the contrary, the strong line at 2.189 is artificial, then the star could be a Ofpe/WR9 like HDE 269582 from the Morris et al. (1996) atlas and to IRS34W (Martins et al. 2007, Fig. 2) or Fig. 3 of Crowther & Bohannan (1997). In addition, the wind velocity is low ( 350 km/s), as suggested by the HeI 2.112 m line, which also supports the Ofpe classification. Even though more observations are necessary to clarify the nature of this interesting object, which is the brightest in our sample. Our tentative classification for Obj4 is Ofpe/WN9.
Object 6 is probably a massive Young Stellar Object (YSO). The Br is in strong emission, Mgii at 2.138 and 2.144 m can be identified. This is the faintest object in the sample and, according to the color-color diagram, shows IR excess.
Object 8 shows Br in emission and also strong Heii 2.188 m in absorption. The star is spectroscopically similar to HD15570, classified as O4If Hanson et al. (2005). It is significantly brighter than Obj1, 2, 3, and 5 (the extinction corrected =9.10 mag). For these reasons, we believe the star may be a supergiant.
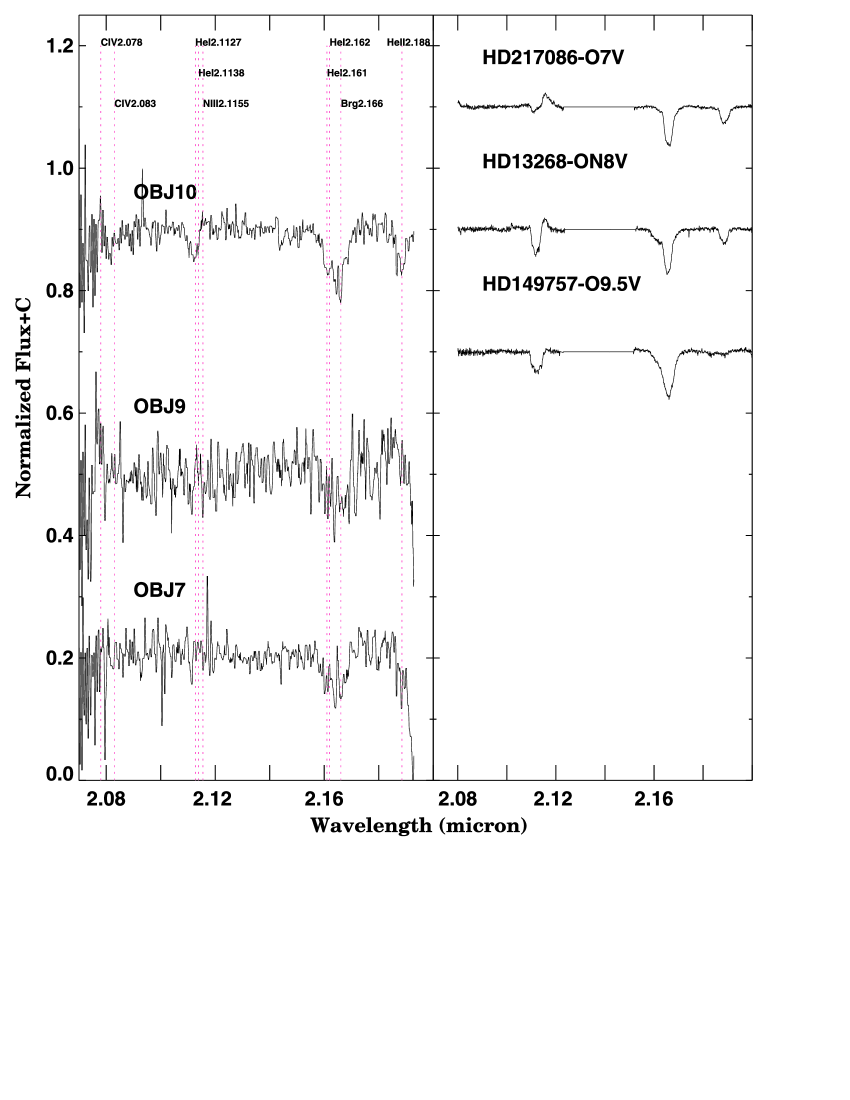
3.2.2 Absorption line stars
The spectra of the absorption line stars are shown in Fig. 6. Object 10 shows Hei 2.1112 m, Heii 2.188 m and Br, Niii/Oiii might exist weakly and the Heii line is relatively strong. The star is similar to HD13268ON8V type. The extinction corrected mag is 10.79 mag. This allows us to put the spectral type of Obj10 as O8 V.
It is impossible to classify the stars Obj7 and Obj9. They have noisy spectra (S/N=25) and the only visible feature is Br in absorption. Note that from the radial velocity analysis (see below) these stars are unlikely to be cluster members.
| Object | S/N | Civ | Niii/Oiii+Hei | HI(Br) | Heii | Spec.type | Vrad | (Vrad) |
|---|---|---|---|---|---|---|---|---|
| 2.078m | 2.116m | 2.661m | 2.185m | K-band | km s-1 | km s-1 | ||
| obj1 | 99 | Em | 2.8 | 0.8 | 2.1 | O5-O6I-V | 96 | 12 |
| obj2 | 75 | Em | 2.3 | 3.7 | 2.3 | O5-O6I-V | 75 | 13 |
| obj3 | 53 | Em | 2.9 | 3.8 | 2.3 | O4-O5I-V | 98 | 12 |
| obj4 | 84 | Em | 6.0 | 37.2 | – | Ofpe/WN9 | 163 | 12 |
| obj5 | 74 | Em | 2.9 | 3.4 | 3.2 | O4-O5I-V | 54 | 14 |
| obj6 | 25 | NP | NP | 12.1 | NP | YSO | 79 | 18 |
| obj7 | 50 | NP | NP | 5.7 | NP | – | 214 | 14 |
| obj8 | 112 | Em | 2.9 | 1.4 | 1.8 | O4If-O5If | 74 | 14 |
| obj9 | 25 | NP | NP | 6.0 | NP | – | 258 | 20 |
| obj10 | 79 | NP | 2.4 | 7.9 | 2.0 | O8V | 60 | 12 |
3.3 Radial velocities
We derived the radial velocities of all ten stars with the IRAF task fxcor, which uses a cross-correlation Fourier method. Since the stars show very different characteristics, several radial velocity standards are used: for the stars Obj1, Obj2, Obj3 and Obj5 we used HD15629, an OV5 spectral type star with Vrad=48 km s-1; Object 8 was cross-correlated with HD15570, an O4If spectral type star with Vrad=15 km s-1; Obj6 and Obj 4 are measured by comparison with DM+493718, an Be spectral type star; all absorption line stars are compared with HD191639 (B1V, Vrad=7 km s-1) and HD167785(B2V, Vrad=10.6 km s-1). The spectra are taken from Hanson et al (2005) and Hanson el al. (1996) spectral atlases. The HD15629 have been shifted to zero velocity, as measured in air using the sophisticated atmospheric modeling (Repolust et al. 2005). In this study, the high resolution spectra of Hanson et al. (2005) were modeled to derive directly absolute values of luminosity and temperature. The models (synthesized spectra) are made at zero velocity and thus the modelers shift the observed spectrum to align them with the models. It is accurate to 10 km s-1. The radial velocities and their estimated errors are given in cols. 8 and 9 of Table 3. The membership of the stars is determined on the basis of the radial velocity histogram (see Fig. 7). Most of the stars are concentrated within the radial velocity interval (100, 50) km s-1. The stars Obj7 and Obj9 have very different radial velocities and most probably are back- or foreground stars. The photometry also confirm the non-membership of these stars: the extinction corrected magnitudes and colors are (11.05; -0.3) and (7.06,1.29) mag (see Tables 1 and 2) and they are situated far from the determined cluster boundaries. The Object 4 also has a relatively high radial velocity; the reason could be the lack of a suitable template for comparison or the peculiar nature of the star. The mean radial velocity value is then calculated from seven cluster members (Obj4 is not taken in consideration) and is Vrad=776 km s-1.

4 Physical Parameters of [DBS2003] 179
The cluster seems to be compact and dense. To determine its boundaries we performed direct star counting, assuming spherical symmetry. The projected star number density as a function of radius is shown in Fig. 8. The cluster boundary was determined as the radius at which the density profile exceeds twice the standard deviation of the surface density in the surrounding field. This yields a radius of 32 arcsec.

With the newly-adopted cluster radius, we statistically decontaminated the “cluster”+“field” color-magnitude diagram by removing as many stars as are present on the “field” color-magnitude diagram. The details of the procedure are described in Borissova et al. (2005). We have selected 180 potential cluster members.
To determine the distance to the cluster, we used the K-band spectral classification of our objects and the intrinsic color and absolute magnitudes of the main sequence and supergiants stars given in the latest calibrations of Martins & Plez (2006). We feel most confident about the spectral type and luminosity class of Obj10, as an O8V. Likewise, we feel moderately confident about the classification of the O supergiant, Obj8, showing weak emission in Br. However, we do not share the same confidence in knowing the luminosity class for Obj1, 2, 3, and 5. In Table 4 we have calculated the distance moduli for each object assuming two luminosity classes for Obj1, 2, 3, and 5 - as supergiants (I) and dwarfs (V). As can be seen from Table 4 if we assume the luminosity class I for these four objects, the distance modulus is more than one magnitude larger than this value calculated from Obj8 and Obj10. All four of these stars have magnitudes of about 10 and the fact that these stars show both Br and HeII in absorption, it seems likely they are main sequence stars. Finally, the star showing the most extreme spectrum, Obj4, also has the largest Ks0 magnitude, estimated to be around 8. This object is likely an extreme supergiant (Of+). These luminosity designations of dwarf, supergiant, and Of+ are consistent with their spectra and the individual distance moduli they predict. Using them, we adopted the average ()0=14.5 mag or 7.9 Kpc. The error is calculated as a standard deviation of the mean value and quadratically added errors from photometry and the variance due to unsure spectral classification. This is a larger distance than the value of 5 Kpc estimated in Paper I. The reason for the difference is in the a-priori assumption used in the 10th star method for the spectral type of the 10th brightest cluster member.
| Object | Spec. type | Lum. class | Lum. class | |||
|---|---|---|---|---|---|---|
| obj1 | 9.90 | O5 | I | 15.44 | V | 14.31 |
| obj2 | 10.04 | O5 | I | 15.45 | V | 14.48 |
| obj3 | 9.79 | O4 | I | 15.31 | V | 14.48 |
| obj5 | 10.17 | O5 | I | 15.71 | V | 14.59 |
| obj8 | 9.10 | O4 | I | 14.65 | – | – |
| obj10 | 10.79 | O8 | – | – | V | 14.41 |
The versus ()0 color-magnitude diagram of the cluster is plotted in Fig. 9. We adopted E()=5.2 and ()0=14.50.3 mag. The unreddened main sequence (Schmidt-Kaler (1982)) is shown with the solid line as well as the isochrones of pre-main sequence stars (PMS) of 1 and 4 Myr (Siess et al. 2000). The stars with known spectral type are plotted with large circles and labeled. In general, as stated above, their absolute magnitudes are consistent with luminosity class V (Obj1, Obj2, Obj3, Obj5, and Obj10) and I (Obj8).
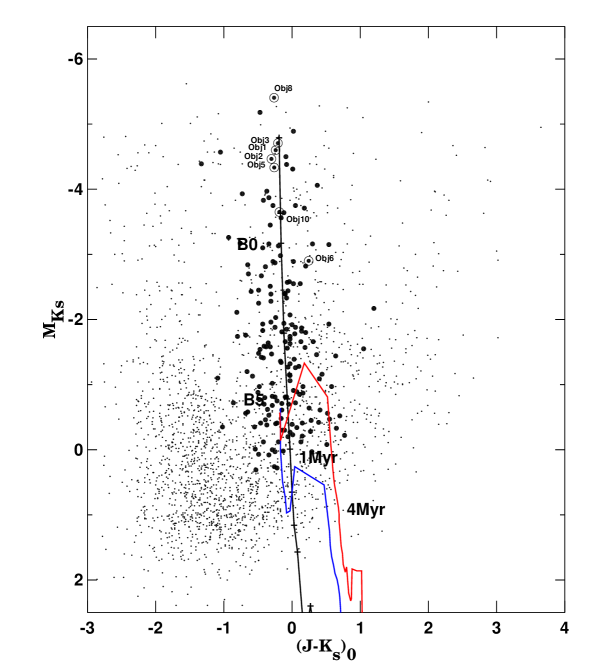
Our photometry is not deep enough to properly sample the pre-main-sequence stars in [DBS2003] 179 and derive an age based on isochrones shown in Fig. 9. However, the presence of O type supergiants and the absence (so far discovered) of WC stars and/or red supergiants implies an upper limit to the age of 4-5 Myr (Maeder & Meynet 2003). As a lower age limit we adopt 2 Myr taking into account the presence of at least one Ofpe/WN9 type star (Obj4) (Crowther & Dessart 1998; Figer et al. 1999, 2002; Blum et al. 2001; Martins et al. 2007). For comparison we also plotted (Fig. 9) the pre-main sequence isochrones from Siess et al. (2000). Thus, the present stellar population of [DBS2003] 179 appears consistent with an age of order 2-5 Myr.
We determine the total stellar mass of the cluster in the following way. First, assuming the Salpeter initial mass function, masses of O supergiants 50 (Herrero et al. 2002, Hillier et al. 2003) and masses of O-type dwarfs 30 (Bouret et al. 2003), we calculated a total mass of 250 for the spectroscopically-confirmed cluster members. Second, using =16.6, ()0=14.5 mag, and integrating along the 5 Myr Padova isochrone (Girardi et al. 2002), we obtain a total present-day mass of the observed main sequence cluster members down to 12 3100 . Integrating over 2.5 Myr isochrone gives for the same mass interval 3500 . In summary, we will adopt the mass of all observed stars of 3550 . Since no completeness correction has been applied this value should be considered as lower mass limit of the cluster. Our photometry is not deep enough and a lot of cluster members are probably not yet seen. Nevertheless, some estimation of the expected total cluster mass can be calculated adopting the Salpeter law, normalizing it to the upper three mass bins (encompassing stars with masses about 10 solar masses), and integrating down to 0.8 solar masses. This yields of 0.7104 . The total number of stars determined with this procedure is 1240.
5 Summary and Conclusions
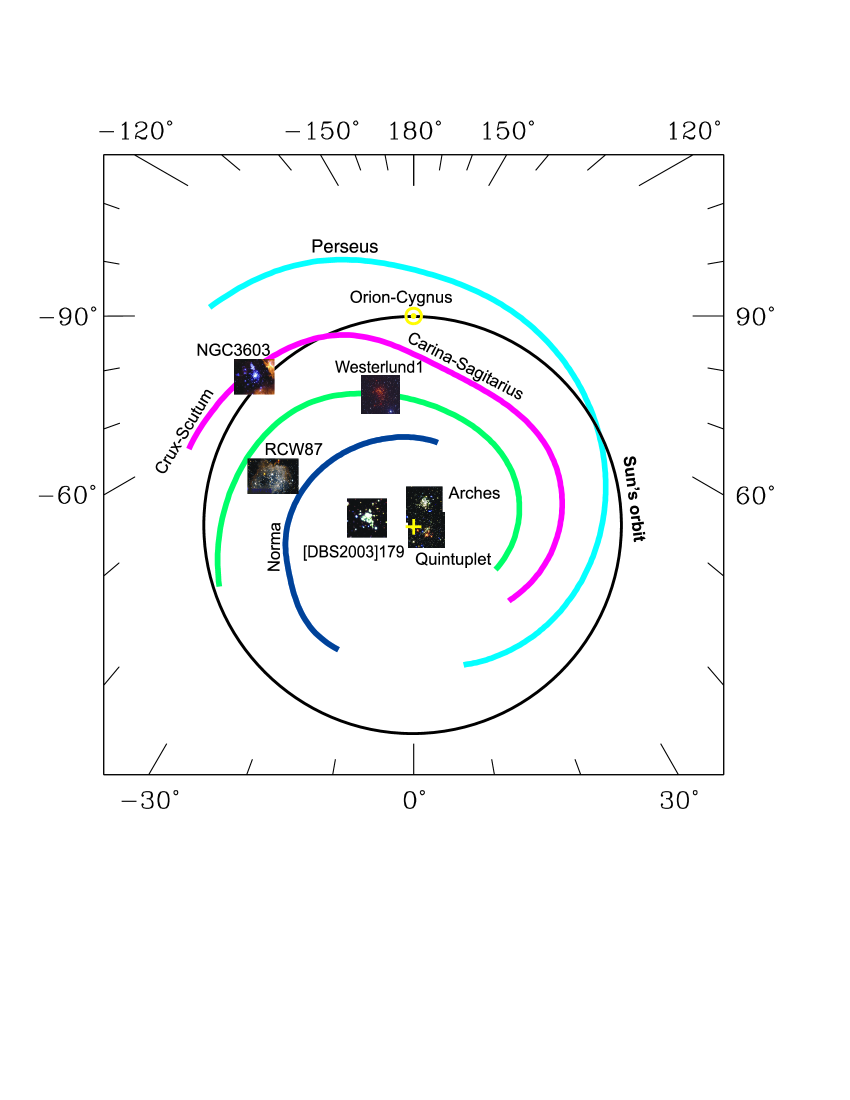
To place [DBS2003] 179 in the context of the currently known Milky Way supermassive/starburst clusters, we compared it with the Westerlund 1/2, the Orion Nuclear Cluster (ONC), NGC3603, Arches, and R136 clusters. The comparison is given in Table 5, reproduced from Table 9 in Brandner et al. (2007). The table rows present: age, relaxation time trelax, half-mass radius rhm, total number of cluster members Ntot, and total cluster mass Mtot.
To calculate the relaxation time of the cluster, we use the method described in Sect. 5.2 of Brandner et al. (2007). First, we calculated the velocity dispersion as:
The half-mass radius of the cluster is taken as the characteristic radius (Portegies Zwart et al. 2002) and is estimated as 0.2 pc. We derive a 1-D velocity dispersion =8.5. This is in good agreement with the velocity dispersion of 6 km/s derived from the radial velocities measurements in Sect. 3. Then, we calculated a crossing time for a star located at the half-mass radius and with a velocity equal to the velocity dispersion t = yr. Thus, the half-mass relaxation time
where Ntot is a number of the cluster members.
| Wd1a | ONCb | Wd2c | NGC3603YCd | Archese | R136 clusterf | [DBS2003] 179 | |
|---|---|---|---|---|---|---|---|
| Age [Myr] | 3.60.7 | 0.3–1.0 | 1–3 | 2.5 | 2–3 | 2–3 | 2.5–5 |
| trelax [Myr] | 400 | 2.1 | 10-40 | 2? | 7 | ||
| rhm [pc] | 1.0 | 0.8 | 0.7-1.5 | 0.24 | 1.1 | 0.2 | |
| Ntot | 105 | 2800 | 1.6 104 | 3450 | 1240 | ||
| Mtot [] | 5104 | 0.18104 | 0.7104 | 1–1.6104 | 1.3104 | 10104 | (0.7–0.8)104 |
In summary, [DBS2003] 179 is a young, not yet dynamically relaxed, dense and relatively massive cluster. It has at least six O-type stars with masses in excess of 30 and our rough estimate based on the most massive stars and assuming a Salpeter IMF suggests a cluster mass well in excess of 103, approaching 104 . The location in the Milky Way of the [DBS2003] 179 and the other clusters from Table 5 is shown in Fig. 10.
Already, a number of optical and infrared clusters have been identified with characteristics similar to [DBS2003] 179, a few of which are listed in Table 5. Presumably, all the optically observable clusters of this mass and age (any age) have been identified. But how many more massive young clusters do we expect current near-infrared searches to find? If our Milky Way galaxy is like every other normal spiral galaxy, its global star formation rate would suggest nearly 100 young clusters similar to [DBS2003] 179 should currently exist within it (Weidner et al. 2005). Just how could so many massive young clusters exist without our seeing them? The 2 MASS survey, mostly because of the extinction limitations at the J- and to a lesser extent the H-bands, is not seeing very deeply into our Galaxy. Typical infrared clusters discovered with 2 MASS have distances of between 1 and 2 kpc (Carpenter 2004). Newer, deeper and longer-wavelength surveys look more promising and suggest that they are sampling to several kpc from the Sun (Mercer et al. 2007). However, it is frequently overlooked that most of the star formation in our galaxy occurs deep within the molecular ring at a galactocentric distance of 4-5 kpc. Except at the closest tangent point to this structure, this constitutes a solar distance of more than a few kpc. The deeply buried, very young massive cluster system of W49 may, in fact, exist within this ring. However, no other known massive infrared (least optical) cluster is positively identified with this region of the Galaxy. Surely, we are missing a significant number of massive clusters associated with this galactic structure.
Infrared searches must continue, but care must be given not to interpret the initial results too quickly. Enormous biases in our current search methods are, in fact, leading to a highly skewed view of the massive cluster population presently in the Milky Way. Until these biases are addressed, it will be difficult to fully appreciate the massive cluster population in our galaxy and relate it properly to the same phenomenon being observed in extragalactic super star cluster work.
Acknowledgements.
JB acknowledges support from Proyecto Fondecyt Regular # 1080086. D.M., J.B. and D.G. are supported by Centro de Astrofísica FONDAP No. 15010003 and the Chilean Centro de Excelencia en Astrofísica y Tecnologías Afines (CATA). Support for RK is provided by Proyecto Fondecyt Regular # 1080154 and DIPUV grant No 36/2006, Universidad de Valparaiso, Chile. JB acknowledges support from DIPUV grant No 6/2007, Universidad de Valparaiso, Chile. MMH acknowledges support by the National Science Foundation under grant 0607497 to the University of Cincinnati. We are grateful for helpful comments from the referee.References
- (1) Allen, L. Calvet, N., D’Alessio, P., Merin, B., Hartmann, L., Megeath, S. et al. 2004, ApJS, 154, 363
- (2) Andersen, M., Zinnecker, H., Moneti, A., Brandner, W., Brandl, B. et al., 2007, ApJ, subm.
- (3) Ascenso, J., Alves, J., Beletsky, Y., Lago, M.T.V.T. 2007, A&A, 466, 137
- (4) Bessell, M. S., Castelli, F., Plez, B. 1998, A&A, 333, 231
- (5) Benjamin, R. et al. 2003, PASP, 115, 953
- (6) Bik, A., Kaper, L., Hanson, M. M., Smits, M 2005, A&A, 440, 121
- (7) Bik, A., Kaper, L., Waters, L. B., 2006, A&A, 455, 56
- (8) Borissova, J., Pessev, P., Ivanov, V.D., Saviane, I., Kurtev, R. & Ivanov, G.R. 2003, A&A, 411, 83
- Borissova et al. (2005) Borissova, J., Ivanov, V. D., Minniti, D., Geisler, D., Stephens, A. W. 2005 (PaperI), A&A, 435, 95
- (10) Borissova, J., Ivanov, V. D., Minniti, D. & Geisler, D. 2006, A&A, 455, 923
- Blum et al. (1997) Blum, R. D., Ramond, T. M., Conti, P. S., Figer, D. F., Sellgren, K. 1997, AJ, 113, 1855
- (12) Blum, R., Schaerer, D., Pasquali, A., Heydari-Malayeri, M., Conti, P. S., Schmutz, W. 2001, AJ, 122, 1875
- (13) Bouret, J.-C., Lanz, T., Hillier, D. J., Heap, S. R., Hubeny, I. et al. 2003, ApJ, 595, 1182
- (14) Brandl, B., Brandner, W., Eisenhauer, F., Moffat, A. F. J., Palla, F., Zinnecker, H., 1999, A&A, 352, L69
- (15) Brandner, W., Clark, J.S., Stolte, A., Waters, R., Negueruela, Goodwin, S., 2008, A&A, 478, 137
- (16) Carpenter, J. M. 2004, ASPC, 322, 319
- (17) Clark, J. S., Negueruela, I., Crowther, P. A., Goodwin, S. P. 2005, A&A, 434, 949
- (18) Caswell, J. L., Haynes, R. F. 1987, A&A, 171, 261
- (19) Crowther, P.A. & Bohannan, P. 1997, A&A, 317, 532
- (20) Crowther, P.A., Dessart, L. 1998, MNRAS, 296, 622
- (21) Davies, B., Figer, D., Kudritzki, R., MacKenty, J. Najarro, F., Herrero, A. 2007, ApJ, 671, 781
- (22) Dowell, J., Buckalew, B., Tan, J. 2008, AJ, 135, 823
- (23) Dutra, C.M., Bica, E., Soares, J., Barbuy B. 2003, A&A 400, 533
- (24) Dutra, C. M., Ortolani, S., Bica, E., Barbuy, B., Zoccali, M.,Momany, Y. 2003a, A&A, 408, 127
- (25) Geballe, T., Najarro, F., Rigaut, F., Roy, J.R. 2006, ApJ, 652, 370
- (26) Girardi et al. 2002, A&A 391, 195
- (27) Harayama, Y., Eisenhauer, F., Martins, F. 2008, ApJ, 675, 1319
- Hanson el al. (1996) Hanson, M. M., Conti, P. S., Rieke, M. J. 1996, AJS, 107, 281
- Hanson et al. (2005) Hanson, M. M., Kudritzki, R.-P., Kenworthy, M. A., Puls, J., Tokunaga, A. T. 2005, ApJS, 161, 154
- (30) Herrero, A., Puls, J., Najarro, F. 2002, A&A, 396, 949
- (31) Hillier, D. J., Lanz, T., Heap, S. R., Hubeny, I., Smith, L. J. et al. 2003, ApJ, 588, 1039
- (32) Ivanov, V.D., Borissova, J., Pessev, P., Ivanov, G. R. & Kurtev, R. 2002, A&A, 394, L1
- (33) Ivanov, V.D., Borissova, J., Bressolin, F. & Pessev, P. 2005, A&A, 435, 107
- (34) Ivanov, V.D., Kurtev, R. & Borissova, J. 2005, A&A, 442, 195
- (35) Hillenbrand, L.A., Hartmann, L.W., 1998, ApJ 492, 540
- (36) Figer, D., McLean, L., Najaro, F., 1997, ApJ, 486, 420
- (37) Figer, D.F., Kim, S.S, Morris, M., et al., 1999, ApJ 525, 750
- (38) Figer, Donald F., Najarro, F., Gilmore, D., Morris, M. K., Sungsoo, S. et al. 2002 ApJ, 581, 258
- (39) Figer, D., MacKenty, J., Robberto, M., Smith, K., Najarro, F. at al. 2006, ApJ, 643, 1166
- koo (83) Koornneef, J., 1983, A&A, 128, 84
- (41) Kurtev, R., Borissova, J., Georgiev, L., Ortolani, S., Ivanov, V. D. 2007,A&A, 475, 209
- (42) Lamers, H., Gieles, M., Bastian, N., Baumgardt, H., Kharchenko, N. V., Portegies Zwart, S. 2005, A&A, 441, 117
- (43) Larsen, S. 2002, AJ, 124, 1393
- (44) Larsen, S. 2006, astro-ph/0606625
- (45) Maeder, A. Meynet, G. 2003, A&A, 404, 1975
- (46) Mathis, 1990, ARA&A, 28, 37
- (47) Martins, F., Plez, B. 2006, A&A, 457, 637
- (48) Martins, F., Genzel, R., Hillier, D. J., Eisenhauer, F., Paumard, T., Gillessen, S., et al. 2007, A&A, 468, 233
- (49) Mercer, E. P., Clemens, D. P., Rathborne, J. M., Meade, M. R., Babler, B. L. et al. 2007 ApJ, 656, 242
- (50) Morris, P., Eenens, P., Hanson, M., Conti, P. Blum, R. 1996, ApJ, 470, 597
- Moorwood, A. et al. (1998) Moorwood, A. et al. 1998, The Messenger 94, 7.
- (52) Portegies Zwart, S., Baumgardt, H., McMillan, S., Makino, J., Hut, P. et al. 2006, ApJ, 641, 319
- (53) Portegies Zwart, S., Gaburov, E., Chen, H., G rkan, M. 2007, MNRAS, 378, 29
- Schmidt-Kaler (1982) Schmidt-Kaler, T., 1982, in Landolt-Borstein, New Series, Group VI, vol. 2, ed. K. Schaifers & H.H. Voigt (Berlin: Springer-Verlag),1
- (55) Repolust et al. 2005, A&A, 440, 261.
- (56) Siess, L., Dufour, E., Forestini, M. 2000, A&A, 358, 593
- (57) Stolte, A., Brandner, W., Brandl, B., Zinnecker, H., Grebel, E.K., 2004, AJ 128, 765
- (58) Stolte, A., Brandner, W., Grebel, E. K., Lenzen, R., Lagrange, A.-M., 2005, ApJ, 628, 113
- (59) Stolte, A., Brandner, W., Brandl, B., Zinnecker, H., 2006, AJ, 132, 253
- (60) Skrutskie et al. 1997, in ASSL Vol. 210, The Impact of Large Scale Near-IR Sky Surveys, Dordrecht: Kluwer, 25
- (61) Weidner, C., Kroupa, P. 2005, AN, 326, 605