Kinematics of the Nebular Complex MH9/10/11 Associated with HoIX X-1
Abstract
We report the results of our observations of the nebular complex MH9/10/11, associated with the ULX HoIX X-1, with scanning Fabry-Pérot Interferometer. Two regions differing by their kinematics and line ratios may be distinguished, roughly corresponding to the bubble nebula MH9/10 and fainter HII-region MH11. For MH9/10 we find the expansion rate of that is different for the approaching and receding parts. MH11 is characterised by very low velocity dispersion () and nearly constant line-of-sight velocities. Properties of MH11 may be explained by photoionization of gas with hydrogen density of . Luminosity required for that should be of the order of . Similar power source is required to explain the expansion rate of MH9/10. Modelling results also indicate that oxygen abundance in MH11 is about solar.
ISM: bubbles \addkeywordISM: individuals: MH9/10/11 \addkeywordISM: kinematics and dynamics \addkeywordX-ray: Individuals: HoIX X-1
0.1 Introduction
The nature of Ultraluminous X-ray sources, or ULXs, is first addressed in the work of Fabbiano (1989). These objects were a subject of intense study for the past 20 years and remain one of the unresolved problems in astrophysics (Roberts 2007). Optical observations show that many of these sources are surrounded by large-scale (from tens to hundreds of parsecs) nebulae. We review the properties of some ULX Nebulae (ULXNe) in Abolmasov et al. (2007a).
Recent works on ULX environment (Abolmasov et al. 2007b; Ramsey et al. 2006) show that many of these objects are associated with young (several million years) stellar population, supporting the hypothesis that ULXs are a certain class of accreting binaries with high-mass donor stars. Young SNRs and X-ray bright SNe are excluded from ULXs by definition though their properties in X-rays may be similar, see discussion in Fabbiano (1989) and references therein. Very often ULXs are found in merging and starburst galaxies.
HoIX is a post-starburst tidal dwarf galaxy lacking old stellar population. We adopt here a distance of 3.6 measured by Makarova et al. (2003). According to De Vaucouleurs et al. (1992), line-of-sight velocities of the galaxy are equal to for neutral hydrogen (HI 21cm) and for the stellar component.
Miller & Hodge (1994) present a survey of all the bright HII-regions in M81 group dwarf galaxies including HoIX in a narrow-band filter sensitive to H and [N 2]6583. The three brightest HII-regions detected in HoIX form a single extended structure: a bright shell (numbers 9 and 10, according to Miller & Hodge (1994)) with some fainter nebulosity (MH11) to the southeast. Spatial dimensions of MH9/10 are . Subsequent work by Miller (1995) identifies the bubble with M81 X-9, or HoIX X-1, that is one of the oldest known ULXs (Fabbiano 1989). The coordinates of the X-ray source as measured by Chandra are , (J2000). With accuracy of about the X-ray source coincides with a relatively bright star with (Ramsey et al. 2006).
The X-ray source and its environment were extensively studied during the last two decades. It was shown that optical emission lines in the spectrum of MH9/10 are broadened (Ramsey et al. 2006) suggesting that the nebula is powered by shock waves. Optical spectra were acquired with low spectral resolution (Miller 1995; Abolmasov et al. 2007a) revealing some new features such as He 24686 emission from the vicinity of the X-ray source. HST observations (Ramsey et al. 2006) show that the X-ray source coincides with a young stellar association. Isochrone fitting points to an age in the range . Ramsey et al. (2006) detect 5 stars in the mass range implying that the total mass of the association is of the order of . The authors argue that supernova explosions and stellar winds are short in explaining the observed luminosity and the size of the bubble.
Pakull & Grisé (2008) report that in high-ionization [O 3]5007 emission line MH11 is about as bright as MH9/10. This points to somewhat different physical conditions in MH11 that may be a consequence of different ionization and heating mechanisms.
Our kinematical study is aimed to acquire more information about both the shell and the high-ionization part of the nebular complex. In the next section we describe our observations with scanning Fabry-Pérot Interferometer. The main results are given in section 0.3. We analyse the results for MH9/10 in section 0.4 and for MH11 in sections 0.5 and 0.6, the latter devoted to photoionization modelling. The results are discussed in section 0.7.
0.2 Observations
Our observations were carried out on January 15/16, 2008 in the prime focus of the Russian Special Astrophysical Observatory 6m telescope with the SCORPIO multi-mode focal reducer (Afanasiev & Moiseev, 2005). We used a scanning Fabry-Pérot Interferometer (FPI) providing spectral resolution . The object was observed in two emission lines: 6717 (total exposure spectral channels) and 5007 (total exposure spectral channels). The free spectral range was and Å, correspondingly. Seeing was around during the observations. The detector was EEV 42-40 CCD operated with binning to reduce the readout time. The spatial scale is per pixel.
Reduction was performed in IDL environment using ifpwid software designed by one of us (A.V.M.). Data reduction algorithms are described by Moiseev (2002) and Moiseev & Egorov (2008). Line profile parameters were determined by fitting with Voigt functions of fixed Lorentzian widths ( for [O 3]5007 and for [S 2]6717). Instrumental profile was measured using the spectra of He-Ne-Ar calibration lamp. Voigt fitting procedure allows to measure line widths even when they are less than the instrumental profile width (Moiseev & Egorov 2008). Profiles were fitted only in the pixels where flux exceeded 18 ADU (corresponding to ). All the line-of-sight velocities presented here are heliocentric.
0.3 Results
Line intensity, line-of-sight velocity and velocity dispersion maps are presented in figure 1. All the maps where smoothed by a median filter. It may be seen that the two parts of the nebula have similar size but vastly different kinematics and line ratios. Velocity dispersion is for MH11 but generally exceeds for MH9/10. MH11 is definitely seen in the [O 3] line but not in [S 2]6717. As we will see below, [O 3]5007 / H flux ratio differs by a factor of for the two nebulae. [O 3]5007 flux from MH11 is of that from MH9/10 (the uncertainty is due to the uncertain boundary between the two regions).
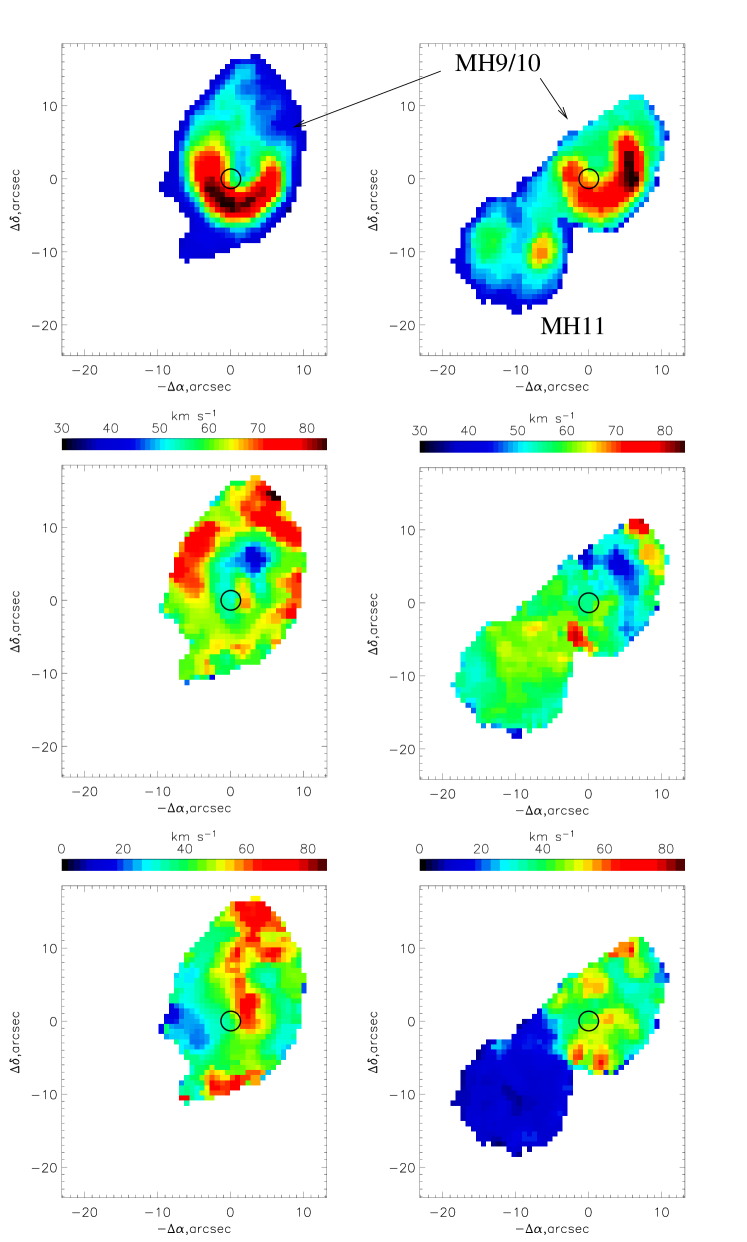
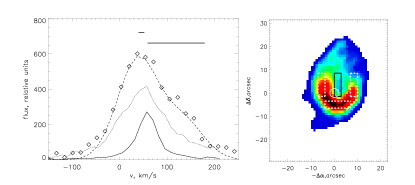
Information about line profiles from different parts of the nebular complex is summarized in table 1. Generally, fitting with Voigt profiles was used with appropriate Lorentzian widths. We select several regions of interest shown by black (central) and white (offset regions) rectangles in figure 2. In order to measure the expansion rate of the nebula we select a rectangular region (30 pixels, ) near the center of the bubble where expansion should result in mostly line-of-sight motions. [S 2] line profile in the central region is asymmetric and we fit it with a double gaussian. Parameters of both components are given in table 1. The intensities of the two components are and of the total line intensity.
Line profiles are extracted also from three offset regions of the same size located to the West, to the East and to the South from the X-ray source (shown by white dotted lines is figure 2 and denoted as W, E and S in table 1).
We also integrate line profiles over the pixels with low velocity dispersion () in [O 3]5007 that belong mostly to MH11. Hereafter we refer to them as the profiles extracted from MH11. Some pixels at the outer rim of MH9/10 have very narrow unshifted [O 3] line profiles (see [O 3] line dispersion map in figure 1) therefore we suggest that the nature of the emitting gas is the same with that in MH11. In figure 2 the profiles of both lines extracted from the central region are presented together with the profile of [O 3]5007 from MH11. The mean line-of sight velocity of MH11 is , that is close to the line-of-sight velocities of both the neutral gas and the stellar component of HoIX. It is also identical within the uncertainties with the line-of-sight velocities of the offset regions in the [S 2] line.
We did not make any flux calibrations. However, we used line luminosities for MH9/10 from Abolmasov et al. (2007a) corrected for Galactic absorption. Total line luminosities for MH11 are derived using MH9/10 as calibrator. The luminosities and sizes of the two parts of the nebula are given in table 2 together with Cloudy modelling results (see section 0.6). Line luminosities for MH9/10 in table 2 are given according to Miller & Hodge (1994) and Abolmasov et al. (2007a) with flux corrections for the Galactic extinction of . Line luminosities for MH11 are estimated using fluxes measured from the two nebulae in our FPI data. [S 2] flux is estimated by integrating the spatial elements where the [O 3] emission is detected and its velocity dispersion is .
0.4 MH9/10
Kinematical properties of the nebula (such as asymmetric [S 2]6717 profile in the central region and velocity shift between the central and peripheral parts) may be explained by its asymmetric expansion. [S 2] velocity of the peripheral regions is consistent with the velocity of the dynamically quiet gas in MH11 hence we consider the systemic velocity equal to 60 . Two-gaussian fit of the [S 2]6717 line profile shows two velocity components. Line-of-sight velocities of the components are and . Velocity shifts with respect to the systemic velocity of the bubble are and , respectively, implying that the expansion is anisotropic. The approaching part of the shell is about two times brighter, and its velocity is more than three times closer to the systemic velocity.
10 line region , , [O 3]5007 MH9/10 (center) 502 462 MH9/10E 542 362 MH9/10W 451 361 MH9/10S 561 452 MH11 591 121 [S 2]6717 MH9/10 (center) 373 100 1318 100 MH9/10E 621 341 MH9/10W 591 371 MH9/10S 581 401 MH11 601 241
Total power of the shock wave may be estimated using expressions from Dopita & Sutherland (1996). Assuming the shell spherical and integrating expression (3.3) from Dopita & Sutherland (1996) over a spherical shock front expanding with constant velocity one obtains:
| (1) |
where , and are correspondingly the preshock hydrogen density (in units), the shell radius in units and the shock velocity in units. The formula is expected to be valid for radiative interstellar shocks and does not account for precursor emission. value is taken as the arithmetic mean of the measured expansion velocities. If one assumes a constant energy influx responsible for powering the nebula, a power of about is needed (depending on the ambient gas density) similar to the apparent luminosity of the X-ray source.
Balmer line luminosities are consistent with the expansion velocity estimates made above, if the mean density of the unshocked material is about . Observed H luminosity of MH9/10 is (or higher if additional extinction is present). This value may be compared with H luminosity calculated using expression (3.4) provided by Dopita & Sutherland (1996):
| (2) |
A mean pre-shock density of about is needed to explain the luminosity in H. Multiple shock fronts and anisotropic expansion velocity may be responsible for this rather high effective pre-shock density value. Emergent emission line flux from a unit shock front surface area scales as with the shock velocity and preshock density. Applying this scaling to the flux from the central region points to a times higher pre-shock density for the approaching section of the bubble.
In figure 2 it may be seen that the [O 3] line has a narrow unshifted component present even in the central parts of the bubble. Since shock waves are uncapable for creating precursors we conclude that the unshifted component is emitted either by the warm gas inside the bubble or by a photoionized region similar to MH11 on the line of sight to the bubble.
0.5 MH11
We confirm the early results of Pakull & Grisé (2008) that [O 3]5007 emission is extremely bright in MH11. From the MPFS observations reported in Abolmasov et al. (2007a) we know the total luminosity (corrected for Galactic absorption only) of the shell in the [O 3] line, . Luminosity of MH11 in the same line is therefore . Because H+[N 2]6583 luminosities of MH11 and MH9/10 differ by a factor of (Miller & Hodge 1994), H luminosity of MH11 should be close to . [O 3]5007 / H flux ratio is or higher (if [N 2]6583 / H ratio is enhanced in the high-excitation nebula). All the line luminosity estimates are given in table 2.
-1.5cm-1.5cm Line luminosities, nebula H H+[N 2]6583 [O 3]5007 [S 2]6717 MH9/10 2.730.13 11.80.5 3.970.12 4.30.14 15050 MH11 0.27 1.120.05 2.60.4 0.20.02 20050 Cloudy (Z=Z⊙ ) 0.26 1.6 2.4 0.4 180 Cloudy (Z=0.2Z⊙) 0.84 3.0 4.0 0.3 250
Quiet kinematics and high [O 3]5007 / H flux ratio favour photoionization as the main energy source in MH11. Balmer lines are likely to be recombination lines. H luminosity is determined by the number of ionizing quanta while the [O 3] doublet is collisionally excited and is enhanced effectively by additional heating. X-ray and harder EUV radiation may be that additional energy source. Low recombination line luminosity of a large nebula may be a consequence of the low recombining gas density. Let us consider MH11 a sphere of a radius . Assuming the gas completely homogeneous one may estimate hydrogen density as:
| (3) |
where is the volume of the nebula and is the effective recombination coefficient for H at in the low-density limit (Osterbrock & Ferland 2006). is the energy of an H photon. Finally one may estimate the mean hydrogen density in MH11 as:
| (4) |
0.6 Photoionization Modelling
In order to better understand the physics of MH11 and to estimate the parameters of the ionizing source we calculated two Cloudy (Ferland et al. 1998) photoionization models. Version 07.02.00 of the code was used. We considered the nebula to be a spherical sector with a covering factor in order to reproduce the offset position of the nebula with respect to the X-ray source. Geometry was considered open (using closed geometry alters the output parameters by ). Gas was irradiated by an EUV blackbody source with variable temperature and luminosity. We used optimize command to find the optimal solution predicting [O 3]5007 / H flux ratio and H luminosity closest to the observed values. Hydrogen density was taken equal to . Two abundance sets were used, solar (HII region abundance set) and solar (HII region abundance set with all the heavy-element abundances reduced by a factor of 5).
The best-fit parameters are and for the solar-metallicity, and and for the subsolar metallicity model. Actually only 30% of these luminosities are used in calculations because of the covering factor. In table 2 we present line luminosities and sizes obtained for the best-fit models. Radii are calculated as the radii of the regions emitting [O 3]5007. In lower ionization lines such as [S 2]6717 the nebula is expected to be about two times larger, therefore we may underestimate the actual luminosity in the [S 2] line. Line emissivities for the two models are shown in figure 3. Note that the source is located outside the nebula and the observed diameter of the nebula should be compared with the model radii.
The best-fit solar-metallicity model predicts and [O 3]5007 / H in reasonable agreement with the observational data. It also predicts that the size of the model nebula should be close to not taking into account the faint low-excitation nebulosity present at larger radii due to X-ray radiation. The Cloudy model also predicts bright [O 2]3727 emission (about as bright as the [O 3]5007 line) and relatively bright low-excitation lines such as [S 2]6717,6731 doublet with luminosities comparable to Balmer line luminosities.
The best-fit subsolar metallicity model predicts [O 3]5007 / H and severely overestimates the H luminosity of the nebula. We conclude that subsolar metallicity models have difficulties in reproducing the observed [O 3]5007 / H ratio possibly indicating that oxygen abundance is around solar for the nebula rather than solar reported by Miller (1995). It is probably even higher because both models overestimate H + [N 2]6583 luminosity. Certainly, more thoroughful investigation involving larger number of emissions is needed.

0.7 Discussion
0.7.1 Photoionizing Source
Existence of ULX nebulae supports the idea that ULXs (or at least some of them) are supercritically accreting binaries similar to SS433 (Katz 1986). That analogy allows two energy sources of comparable power to exist that may be responsible for powering the nebulae: jet activity (jet power is of the order in the case of SS433) and photoionizing radiation from the X-ray source. Both are likely to produce HII-regions elongated in the disc/jet symmetry axis direction.
Observational properties of MH11 are consistent with photoionization and heating by a powerful EUV and X-ray source. High EUV luminosities (comparable with the apparent isotropic luminosities in X-rays) of ULXs are supported both by theory (Poutanen et al. 2007) and by observations (Abolmasov et al. 2008). Therefore, HII-regions similar to MH11 should be common for ULXs. Indeed, there are sources like M101P98 (Abolmasov et al. 2007a; Kuntz et al. 2005) surrounderd by extended HII-regions with high [O 3]5007 / H ratios as well as bubble nebulae overlapped by diffuse structures seen in [O 3]5007 / H intensity maps as “ionisation cones” (Roberts et al. 2003). It is possible that in many cases high-ionization photoionized nebulae are masked by ULX bubbles that have about an order of magnitude higher luminosities in Balmer lines.
0.7.2 Dynamical Properties of the Bubble
Ramsey et al. (2006) proved that MH9/10 could not be produced by SNe and stellar winds from the parent association of the ULX. There is also evidence that ULX bubbles are produced by continuous power injection by wind or jet activity rather than by instantaneous powerful explosions (Pakull & Grisé 2008; Abolmasov 2008). If one assumes a continuous source of power that heats the gas inside a wind-blown cavern, expansion law established by Avedisova (1972) (see also Castor et al. (1975)) for pressure-dominated bubbles may be used:
| (5) |
| (6) |
Here is the power of the energy source in units, is the preshock density in and is the bubble age in million years. These formulae may be reversed to find the kinematical age and the power of the energy source:
| (7) |
| (8) |
Dynamical age is typical for ULX bubbles (Pakull & Mirioni 2003) but higher values were never found supposing the lifetimes of ULXs are of the order of 1 .
0.7.3 Underlying Density Gradient
Narrow-band images of MH9/10 with higher spatial resolution reveal fine details at the outer boundary of the bubble (Grisé et al. 2006) and faint filamentary nebulosity extending to about twice the mean radius of the shell. The complex structure of the bubble is probably connected with a high ambient density gradient. The mean preshock density was probably one or two orders of magnitude higher then the density of the gas in MH11.
Ambient density gradients often lead to blow-out structures and multiple shock fronts (Mac Low et al. 1989). In this scope, it is tempting to consider MH11 a blow-out with an invisible outer boundary. The observed gas was ionized by shock waves and is recombining without any additional energy source. Recombination time for the rarefied warm gas is long enough: . The strongest argument against the hypothesis is the quiet kinematics of MH11. If a shock wave propagates in a non-homogeneous medium its velocity varies roughly as (McKee & Cowie 1975). Disturbed gas behind the shock front should have both high velocity dispersion due to turbulent motions and also a velocity component in the shock propagation direction.
We see however neither high velocity dispersion (such as tens or higher) that should inevitably appear if a fast shock was responsible for ionizing the gas nor any strong line-of-sight velocity gradients. Line centroid shifts smoothly by less than 10 towards the outer rim of the nebula. This shift may appear if the HII-region is expanding due to internal pressure of the warm ionized gas (Osterbrock & Ferland 2006). The expansion velocity is close to the speed of sound in the ionized gas, that is of the order of . In figure 4 we show the behavior of line profile parameters along the line crossing the central parts of both nebulae at a positional angle of .

Our observations are the first to state that velocity gradients are not an essential part of the dynamics of ULX nebulae. The peak of the [O 3] line changes its line-of-sight velocity by less than 10 for MH11. That is an important clue indicating that on large scales the momentum injected in the ISM is low. ULX nebulae are likely to be powered by radiation and/or relativistic jets that transport negligible amounts of momentum for a given mechanical luminosity.
0.8 Conclusions
Observations with scanning FPI reveal new details about the extended nebular complex associated with HoIX X-1. We measured the expansion rate of MH9/10 and find it consistent with the velocity estimates from H luminosity. However, the expansion appears to be anisotropic. Approaching and receding parts of the bubble have line-of-sight velocities shifted by and with respect to the systemic velocity of . Complex structure of the shell probably originates from density gradients that are definitely present in the ISM in HoIX and may be connected to the parent association of the ULX. The dynamical age inferred from the kinematical data is . Mechanical luminosity required is , that is comparable to the X-ray luminosity of the source. The effective value of the pre-shocked density is .
We show that the observational properties of MH11, namely its high [O 3]5007 / H ratio (), size () and H luminosity ( ) may be explained by a hard EUV source ionizing low-density gas with . This is the best evidence for an EUV source associated with a ULX for today. Solar oxygen abundance value explains the observational properties of MH11 better than 1/5 solar. The EUV source is well reproduced by a black body with and isotropic luminosity . We suggest that further observations are needed in order to deside on the abundances and the ionization balance in MH11.
This work is based on the observational data obtained with the 6-m telescope of the Special Astrophysical Observatory of the Russian Academy of Sciences funded by the Ministry of Science of the Russian Federation (registration number 01-43). We would also like to thank the anonymous referee for his/her very useful remarks and suggestions and S. Pavluchenko for his help with English.
References
- Abolmasov et al. (2007a) Abolmasov, P., Fabrika, S., Sholukhova, O. & Afanasiev, V. 2007a, Astrophysical Bulletin, 62, 36
- Abolmasov et al. (2007b) Abolmasov, P., Swartz, D., Fabrika, S. et al. 2007b, ApJ, 668, 124
- Abolmasov et al. (2008) Abolmasov, P., Fabrika, S., Sholukhova, O. & Kotani, T. 2008, PASJ, submitted
- Abolmasov (2008) Abolmasov, P. 2008, in Proceedings of the Conference: Cool discs, hot flows: The varying faces of accreting compact objects, 24 - 29 March 2008, Funäsdalen, ed. M. Axelsson (New York: AIP), submitted for inclusion
- Afanasiev & Moiseev, (2005) Afanasiev, V. & Moiseev, A. 2005, Astronomy Letters, 31, 194
- Avedisova (1972) Avedisova, V. S. 1972, Soviet Astronomy, 15, 5
- Castor et al. (1975) Castor, J., McCray, R. & Weaver, R. 1975, ApJL, 200, 107
- De Vaucouleurs et al. (1992) De Vaucouleurs, G., de Vaucouleurs, A., Corwin, H. G., Jr., Buta, R. J., Paturel, G. & Fouque, P. 1992, Third Reference Catalogue of bright galaxies (RC3) VizieR On-line Data Catalog: VII/137B. Originally published in: Springer-Verlag, New-York (1991)
- Dopita & Sutherland (1996) Dopita, M. A. & Sutherland, R. S. 1996, ApJSS, 102, 161
- Fabbiano (1989) Fabbiano, G. 1989, ARA&A, 27, 87
- Ferland et al. (1998) Ferland, G. J., Korista, K.T., Verner, D.A., Ferguson, J.W., Kingdon, J.B. & Verner, E.M. 1998, PASP, 110, 761
- Grisé et al. (2006) Grisé, F., Pakull, M. W. & Motch, C. 2006, in: Populations of High Energy Sources in Galaxies, IAU Symposium 230, eds. E. J. A. Meurs & G. Fabbiano (Cambridge : Cambridge University Press), 302 (astro-ph/0603768)
- Katz (1986) Katz, J. 1986, Comments Astrophys., 11, 201
- Kuntz et al. (2005) Kuntz, K. D., Gruendl, R. A. & Chu, Y.-H. et al. 2005 ApJ, 620, 31
- Makarova et al. (2003) Makarova, L. N., Grebel, E. K. , Karachentsev, I. D. et al. 2003, Ap&SS, 285, 107
- Mac Low et al. (1989) Mac Low, M. M., MacCray, R. & Norman, M. L. 1989, ApJ, 337, 141
- McKee & Cowie (1975) McKee, C. F. & Cowie, L. L. 1975, ApJ, 195, 715
- Miller & Hodge (1994) Miller, B. W., Hodge, P. 1994 ApJ, 427, 656
- Miller (1995) Miller, B. W. 1995, ApJ, 446, 75
- Moiseev (2002) Moiseev, A. V. 2002, Bullletin SAO, 54, 74 (astro-ph/0211104)
- Moiseev & Egorov (2008) Moiseev, A. V., Egorov O.V., 2008, Astrophysical Bulletin, 63, 181 (astro-ph/0805.2367)
- Osterbrock & Ferland (2006) Osterbrock, D. E. & Ferland, G. 2006, Astrophysics of Gaseous Nebulae and Active Galactic Nuclei, 2nd. ed. by D.E. Osterbrock and G.J. Ferland. Sausalito, (CA: University Science Books)
- Pakull & Grisé (2008) Pakull, M.W. & Grisé, F. 2008, in Proceedings of the Conference: A Population Explosion: The Nature and Evolution of X-ray Binaries in Diverse Environments, 28 Oct. - 2 Nov. 2007, St. Petersburg Beach, FL R. M. Bandyopadhyay, S. Wachter, D. Gelino, & C. R. Gelino, eds. (New York: AIP), 303
- Pakull & Mirioni (2003) Pakull, M.W. & Mirioni, L. 2003, in Winds, Bubbles, and Explosions: a conference to honor John Dyson, RevMexAA (Serie de Conferencias) 15, 197, ed. J. Arthur & W. J. Henney
- Poutanen et al. (2007) Poutanen, J., Lipunova, G., Fabrika, S., Butkevich, A. & Abolmasov, P. 2007, MNRAS, 377, 1187
- Ramsey et al. (2006) Ramsey, C. J., Williams, R. M., Gruendl, R. A., Chen, C.-H. R., Chu, Y.-H. & Wang, Q. D. 2006, ApJ, 641, 241
- Roberts et al. (2003) Roberts, T. P., Goad, M. R., Ward, M. J. & Warwick, R. S. 2003, MNRAS, 342, 709
- Roberts (2007) Roberts, T. P. 2007, Ap&SS, 311, 203