Two New Large Separation Gravitational Lenses from SDSS
Abstract
We present discovery images, together with follow-up imaging and spectroscopy, of two large separation gravitational lenses found by our survey for wide arcs (the CASSOWARY). The survey exploits the multicolour photometry of the Sloan Digital Sky Survey to find multiple blue components around red galaxies. CASSOWARY 2 (or “the Cheshire Cat”) is composed of two massive early-type galaxies at and respectively lensing two background sources, the first a star-forming galaxy at and the second a high redshift galaxy (). There are at least three images of the former source and probably four or more of the latter, arranged in two giant arcs. The mass enclosed within the larger arc of radius is . CASSOWARY 3 comprises an arc of three bright images of a source, lensed by a foreground elliptical at . The radius of the arc is and the enclosed mass is . Together with earlier discoveries like the Cosmic Horseshoe and the 8 O’Clock Arc, these new systems, with separations intermediate between the arcsecond separation lenses of typical strong galaxy lensing and arcminute separation cluster lenses, probe the very high end of the galaxy mass function.
keywords:
Gravitational lensing – galaxies: structure – galaxies:evolution1 Introduction
Very recently, a number of large separation gravitational lenses have been found in data from the Sloan Digital Sky Survey (SDSS). The systems include: the 8 O’clock Arc, which is a Lyman Break galaxy lensed into three images merging into an extended arc (Allam et al., 2007), the Cosmic Horseshoe, which is a star-forming galaxy lensed into an almost complete Einstein ring of diameter (Belokurov et al., 2007), and the strongly lensed post-starburst galaxy of Shin et al. (2008).
These discoveries prompted us to instigate the The CAmbridge Sloan Survey Of Wide ARcs in the skY (CASSOWARY 111http://www.ast.cam.ac.uk/research/cassowary/). The aim is to carry out a systematic search for wide separation gravitational lens systems, looking for multiple, blue companions around massive ellipticals in the SDSS photometric catalogue. Typically, the target systems correspond to lensing of star-forming galaxies by luminous red galaxies and brightest cluster galaxies. Here, we present a description of the search strategy, together with details of two new gravitational lens systems, for which we have obtained follow-up on a number of telescopes, including the 6 m at the Special Astrophysical Observatory (SAO), the 3.5 m at Calar Alto, and the 2.5 m Isaac Newton (INT) and the 4.2 m William Herschel Telescopes (WHT) at La Palma. The accompanying CASSOWARY webpage lists 23 likely candidates, many still awaiting follow-up.
Previous search strategies typically target smaller separation lenses, in which the images are unresolved by SDSS. For example, Inada et al. (2003b) and Johnston et al. (2003) searched through spectroscopically identified quasars, looking for evidence for extended sources corresponding to unresolved, multiple images, whilst Johnston et al. (2003), Bolton et al. (2004) and Willis et al. (2005) used the spectroscopic database to look for emission lines of high redshift objects within the spectrum of lower redshift early-type galaxies.
Although wide separation lenses () are comparatively unexplored, they are interesting for a number of reasons. First, wide separation lenses are a probe of the high-mass end of the galaxy mass function. The Einstein radius is typically a few effective radii where the matter distribution is dominated by dark matter. Second, the source is often highly magnified and thus provides us with a sample of the brightest galaxies known at high redshifts, such as the Cosmic Horseshoe or CASSOWARY 1 (Belokurov et al., 2007; Dye et al., 2008). Third, the modelling of such systems is relatively clean. The positioning of the images well outside the effective radius of the lens means that their properties, particularly their brightnesses, can be measured with high accuracy. Fourth, the frequency of large separation lenses provides constraints on models of structure formation. For example, fossil groups, in which bright galaxies have merged via dynamical friction to leave a single very massive object, are amongst the lenses targeted by the CASSOWARY search. Finally, the unusual morphologies of some wide separation lenses are also fascinating from the perspective of the theory of gravitational lensing (Shin & Evans 2008, Werner, An & Evans 2008).
The paper is arranged as follows. Section 2 presents our general methodology, whilst Sections 3 and 4 present our two new gravitational lenses in turn – CASSOWARY 2 and CASSOWARY 3 (henceforth CSWA 2 and CSWA 3) – describing our follow-up data, our modelling and predictions. They are the second and third of the CASSOWARY lenses, following the Cosmic Horseshoe, CSWA 1. Finally, Section 5 summarizes our conclusions and future prospects.

2 Method
2.1 Search Strategy
At its simplest, our algorithm searches for blue companions to luminous red galaxies. We have already used a precursor of the algorithm to identify the Cosmic Horseshoe (Belokurov et al., 2007), and similar methods have been used recently by others (Kubik, 2007; Shin et al., 2008).
Our selection procedure has two parts. First, we carry out a broad search for all massive ellipticals with at least one blue companion. Secondly, we run a number of more targetted searches for arcs of different sizes and brightnesses on the initial catalogue of candidates.
To obtain the initial sample, we use a variant of the criteria of Eisenstein et al. (2001) to identify luminous red galaxies (LRGs) in SDSS’s Galaxy table. Specifically, we require
| (2.1) |
These quantities are all defined in Eisenstein et al. (2001), but we use the Data Release 6 (DR6) photometric solution rather than the Early Data Release magnitudes. Our cuts are slightly changed from Eisenstein et al. (2001) to include fainter and somewhat bluer objects than the classical LRGs, as we are primarily interested in early-type massive galaxies as opposed to LRGs themselves. Following Eisenstein et al. (2001), we only keep galaxies with and . We also use an cut to eliminate nearby late-type galaxies that are resolved by SDSS into separate bulge, disk and spiral arm components.
We then select objects from SDSS’s Neighbors table with and within radius. The SQL query was based on one originally devised by R. Lupton 222 http://cas.sdss.org/dr6/en/help/docs/realquery.asp#nbrrun. Some standard photometry flags are also used to remove artifacts, specifically the first two lines from the SDSS sample SQL query “Clean Photometry with flags” for the Galaxy view 333 http://cas.sdss.org/dr6/en/help/docs/realquery.asp#flags
The second stage begins with the calculation of the total number of arc candidates and the mean values of their distance, apparent magnitude, colour and surface brightness for each potential lens galaxy. Selection cuts are then applied to eliminate false positives in the form of galaxy groups, mergers, tidally induced structures and data artifacts. In their simplest form, they are as follows:
| (2.2) | |||
| (2.3) | |||
| (2.4) | |||
| (2.5) |
Thus, the search requires the presence of at least two arc candidates, that is, blue faint companions lying within radius from the center of the lens galaxy. If the lens is a single galaxy with modest shear, the images should be all at about the same distance from the primary and the distance dispersion should be small. The arcs are required to be bright (on average brighter than 21.5 mag) and to have at least two components of comparable magnitude ( mag). Eqn (2.4) ensures that at each lens colour, the arcs are bluer than the typical physical companions that can occur. The final cut restricts the allowed range of surface brightness for the arcs . Brighter objects are typically foreground galaxies and the fainter objects are typically tidal arms and bridges common in interacting galaxies.
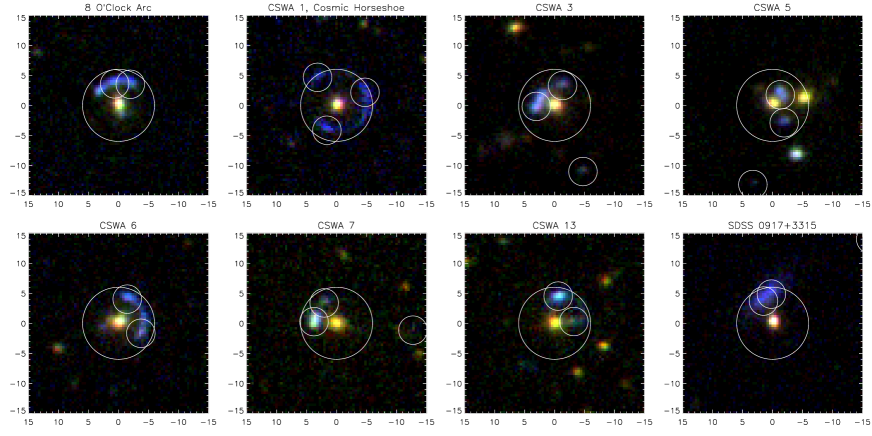
The cuts are illustrated in the four panels of Figure 1. The filled and open circles show the locations of nine objects selected by our algorithm. One lens is actually double-counted, as it is a binary, so there are really only eight distinct cases. The two solid black circles are the previously known lenses: the 8 o’clock Arc (Allam et al., 2007) and the Cosmic Horseshoe, or CSWA 1 (Belokurov et al., 2007). It is clear that the new candidates, shown as black circles, look similar to the known systems, but are on average not as blue and do not have as high surface brightness. The SDSS cut-outs of the eight systems selected by the algorithm are shown in Figure 2. Although they all look excellent gravitational lens candidates, they require follow-up before their nature can be established beyond doubt.
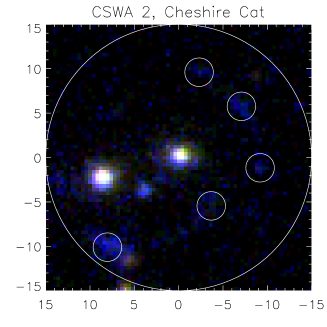
Relaxing the cuts described in eq (2.4), to allow fainter, less circular arcs at larger radii from the lens, yields many additional candidates at the expense of including a larger fraction of false positives. One particularly interesting system is shown in the SDSS cut-out in Figure 3.
The results of our searches are summarised on the CASSOWARY website, which includes 20 gravitational lens candidates. For two of the systems, CSWA 2 and CSWA 3, we have obtained deeper imaging and spectroscopy, confirming the gravitational lensing hypothesis. We now discuss the properties of CSWA 2 or the “Cheshire Cat” and CSWA 3 in some detail.
2.2 Overview of the Properties of CSWA 2 and CSWA 3
For CSWA 2, deeper imaging observations were carried out on 2007 May 12/13 with the Wide Field Camera (WFC) of the Isaac Newton Telescope (INT). The exposure times were 600 s in each of the and filters – which are similar to the SDSS filters. The measured seeing (FWHM) on the images ( pixels) was , and in and respectively. The INT data are roughly a magnitude deeper than the SDSS data and were reduced using the pipeline toolkit of Irwin & Lewis (2001). Although less extensive, we also obtained some additional band imaging of CSWA 3 using the Special Astrophysical Observatory (SAO) on 2008 March 28/29. BTA 6-m telescope at the SAO in seeing of .
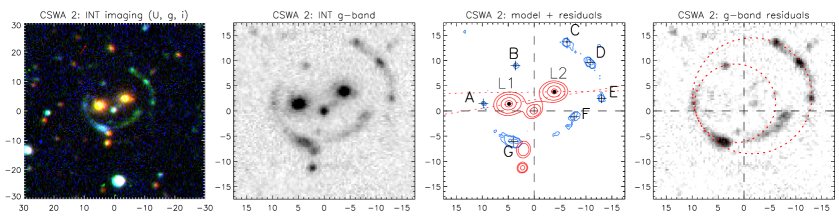
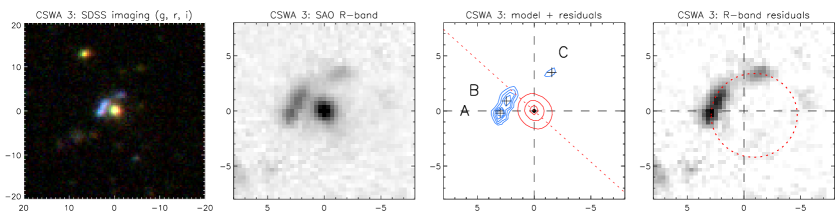
In Figure 4, we present RGB-composites made from in the case of CSWA 2 and in the case of CSWA 3. A zoom-in of the (or ) band image for CSWA 2 (or CSWA 3) is shown in the second column. In the case of CSWA 2, the arcs are more extended in Figure 4 than in the SDSS image, with at least seven resolved bright knots visible. Moreover, the arc connecting components A and B together with the knot G are bluer than the arcs connecting C, D, E and F (see the top panel in the third column for the component key). The colour difference hints at the possibility of two sources at different redshifts in CSWA 2.
For both CSWA 2 and CSWA 3, we masked the arcs in the band to identify the deflector population, which is modelled using GALFIT 444http://users.ociw.edu/peng/work/galfit/galfit.html (Peng et al., 2002). We use a field star to define the PSF and fix the sky levels from aperture photometry of stars around each lens. Models of the foreground galaxies (and occasional star) are shown in red in the third column of Figure 4, whilst the residuals – that is, primarily the arcs – are shown in blue. The red dotted lines show the major axes of the lens galaxies. The fourth panel shows the greyscale image with the foreground population subtracted, together with the best-fitting ellipses to the arcs. The ellipses are used to estimate the radius of curvature of the arcs.
Table 1 gives the basic observational data for the CSWA 2 and CSWA 3 lenses, together with the Cosmic Horseshoe from Belokurov et al. (2007) for comparison. All magnitudes are given in the and bands on the SDSS AB system. The band images of the lensing galaxies have the highest signal-to-noise ratio, and so they are used to measure the effective radii using a standard de Vaucouleurs profile fit. Anticipating the results from the next two sections, our follow-up spectroscopy is used to determine the lens redshift for CSWA 2 and CSWA 3, whilst the mass estimates come from our modelling.
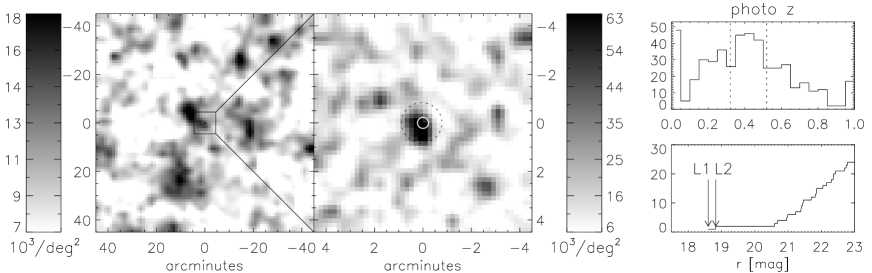
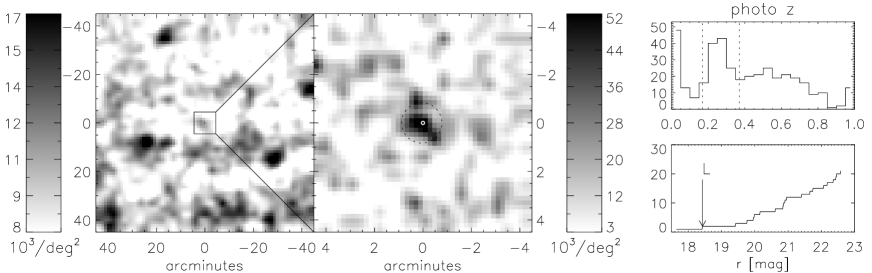
To investigate the influence of environment, Figure 5 shows grey-scale images of the number density of galaxies detected by SDSS, together with a zoom-in on the lens. To study the immediate neighbours of the lens galaxy, we use the SDSS photometric redshifts, as shown in the upper right panel. To build the luminosity function, we select galaxies with a redshift lying within the range , as shown in the top-right panels. Typically for the CASSOWARY lenses, the galaxies lie in poor groups with members, rather than rich clusters, and are the brightest galaxies by 1 or 2 magnitudes in .
| Parameter | CSWA 1 | CSWA 2 | CSWA 3 |
|---|---|---|---|
| Cosmic Horseshoe | Cheshire Cat | ||
| 11:48:33.1 | 10:38:47.95 | 12:40:32.28 | |
| 10:38:39.20 | |||
| 19:30:03.2 | 48:49:17.9 | 45:09:02.9 | |
| 48:49:20.3 | |||
| 0.444 | 0.426 | 0.274 | |
| 0.432 | |||
| 2.379 | 0.97 | 0.725 | |
| 20.8,18.2 | 20.2, 17.9 | 19.6, 17.8 | |
| 20.5, 18.1 | |||
| 20.1,19.7 | 21.5, 20.6 | 19.7, 19.3 | |
| 21.0, 20.5 | |||
| 5.4 | 17.7 | 2.4 | |
| 33 |
| L1 | L2 | A | B | C | D | E | F | G | |
| Coordinates | (4.8,1.2) | (-4.05,3.75) | (9.7,1.4) | (3.4,9.0) | (-6.45,13.7) | ( -10.9,9.65) | (-13.1. 2.5) | (-7.8,-1.1) | (3.9, -6.2) |
3 CSWA 2, The Cheshire Cat
CSWA 2, nicknamed “The Cheshire Cat” (Carroll, 1866) because of its broad smile, is a complicated system. The Cat’s eyes are two giant early-type galaxies, which are probably responsible for most of the lensing. Our images are centered on the Cat’s nose at , which is most likely a foreground object. The southern arc, which is the Cat’s smile, is the brightest arc in the system and is clearly visible in the SDSS imaging. Given the complexity of CSWA 2, we obtained integral field and long slit spectroscopy with the Calar Alto 3.5m and the WHT respectively.
Calar Alto observations were performed using the Potsdam Multi-Aperture Spectrophotometer (PMAS, Roth et al. 2005), at the 3.5m telescope on 2007 May 10/11. PMAS is an integral field spectrograph that comprises a lens array with 256 individual lenses. They sample the sky in a regular square grid of 16 16 elements, each with an individual field-of-view of 1 in the selected configuration. A low-resolution grating (V300) giving a FWHM resolution of 7Å was used, covering the wavelength range 5780-9125Å. An exposure of 3600 s was taken on the central parts of CSWA 2, which included both lensing galaxies and the brightest knot in the southern arc. The data were then reduced using R3D (Sánchez et al. 2006). The reduction steps include bias and pixel-to-pixel transmission correction, spectra tracing and extraction, wavelength calibration, fibre-transmission difference corrections and flux calibration. The frames were sky subtracted using E3D (Sánchez et al. 2004), by selecting the spectra corresponding to fibres free of object signal within the field-of-view. The resulting median sky spectrum was then subtracted from all the fibres. Finally, the spectra were reordered using the PMAS position table to create the reduced datacube.
A long-slit spectrum of knots A and D was obtained using the ISIS spectrograph on the WHT on the night of 2008 May 23. The observations were obtained as part of the WHT Service Programme in less than ideal conditions of high humidity, with variable seeing around . The ISIS spectrograph was configured with the 5300Å dichoic and gratings R300B (blue arm) and R158R (red arm). A slit-width of was employed and a total on-sky exposure time of 4500 s was obtained, divided into five individual exposures of 900 s. Wavelength calibration was performed using exposures of standard calibration lamps. In practice, no useful information was obtained from the blue arm, but the data from the red arm provided wavelength coverage of Å with a resolution of 12Å FWHM. The data were obtained without any on-chip binning and the spatial scale along the slit was 0.22 ″per pixel. Standard reduction procedures were followed using iraf555iraf is distributed by the National Optical Astronomy Observatories, which are operated by the Association of Universities for Research in Astronomy, Inc. under cooperative agreement with the National Science Foundation. routines. The five individual object exposures were then combined, employing a sigma–clipping algorithm to eliminate cosmic-rays, and the spectra of the two central galaxies extracted. The spectrum-trace of the brighter galaxy was then repositioned along the slit to extract spectra of the two arc components A and D.
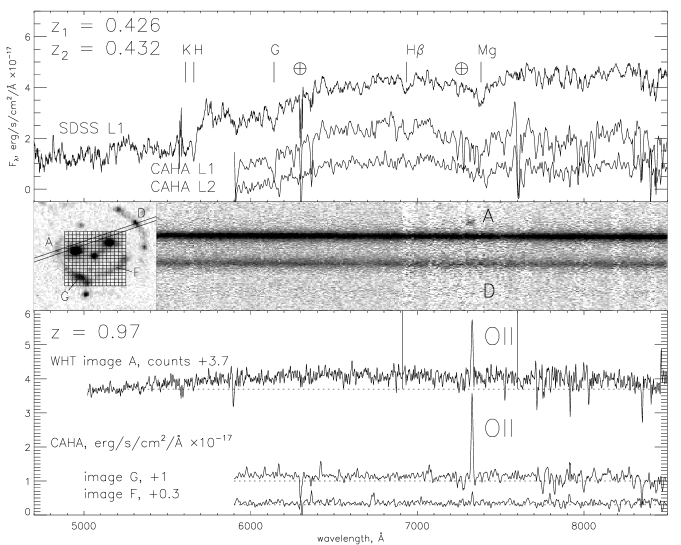
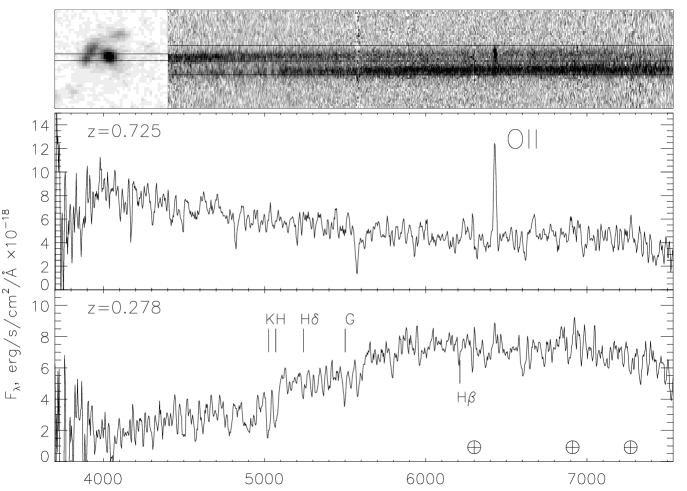
Figure 6 summarises the available spectroscopic data for CSWA 2. The inset in the middle panel shows the placing of the PMAS IFU and the WHT long slit. The top panels shows the spectra for the lensing galaxy L1 (SDSS and Calar Alto) and L2 (just Calar Alto), which are typical of early-type galaxies, with Ca K & H, G-band, Mgb absorption, together with an indication of Hβ absorption. L1 and L2 lie at slightly different redshifts, namely and , which corresponds to a Hubble-flow separation of Mpc in the standard cosmology (.) It is also worth noting that L2 is a radio source as detected by FIRST with 6.9 mJy flux.
For the sources, we have spectra of knots A and D with ISIS, and F and G with PMAS. The 2D ISIS spectra are shown in the middle panel and the 1D spectra from both ISIS and PMAS are shown in the lower panel. The main feature is the two strips in the middle of the 2D cut-out corresponding to the continua of the lensing galaxies. Also visible in the range 6915 - 7600 Å is the narrow emission line [O II] from a source at . As evident from the 2D spectra, the emission feature is not detected at the location of the D image. The presence/absence of [OII] emission is corroborated by the PMAS data in the lower panels, with G exhibiting strong [O II], but not F (although the signal from F is weak and so the evidence is not conclusive). Given the absence of [O II] up to 9300 Å in the ISIS spectra, we conclude that the redshift of the second source is likely in excess of .
As a simple and flexible tool for modelling, we take advantage of the publicly available PixeLens 666 http://www.qgd.uzh.ch/projects/pixelens/ code (Saha & Williams, 2004). Here, the mass distribution is pixellated into tiles. It is easy to find many possible mass tilings that reproduce the positions of the images exactly. PixeLens overcomes this problem by restricting attention to mass distributions for which (i) the density gradient anywhere must point within of the centre, (ii) the projected density of any pixel must be less than twice the average value of its neighbors and (ii) the surface density radial profile must be steeper than . These constraints guarantee that the model is centrally concentrated, smooth and roughly isothermal .
PixeLens samples the solution space using a Markov chain Monte Carlo method, typically generating an ensemble of 100 models that reproduce the input data, which in our case are the image locations and parities. As the constraint equations are linear, averaging the ensemble also produces a solution. All figures and numbers given from the modelling are ensemble-averages over a set of 100 models. Note that our models always reproduce the relative positions of the lensing galaxies and the images exactly, but they usually predict fainter additional images. The quality of our available images is not adequate to allow useful quantitative measurements of the brightnesses of the individual components. Nonetheless, in our modelling, we give the magnifications of the images to show that there is a qualitative match between the predictions and the data.
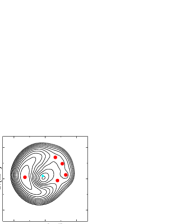
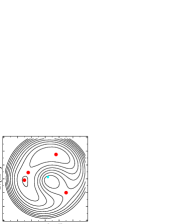
A PixeLens model for CSWA 2 using the input data in Table 2 is shown in Figure 7. The left and middle panels show the Fermat surfaces for the sources at and respectively. The positions of the images of the higher redshift source, C,D, E and F, are all reproduced. The total magnification is , with C and D as the brightest images (magnifications of and ) followed by E and F (magnifications of and ). There is also a predicted faint counterimage at with a magnification of and, of course, a highly demagnified central image. For the lower redshift source, the image locations of G, A and B are reproduced. The predicted respective magnifications are and , which is in reasonable accord with the relative brightness of the images in Figure 4. There is a bright counterimage with a magnification of offset from the centre by . The predicted counterimage is close to the location of the lensing galaxy L2, which may render its detection difficult. The total magnification of the source is . Note that the density contours are roundish but with evident substructure, whilst the mass enclosed within the outer ring of radius is a stupendous – almost an order of magnitude greater than the mass in the entire Local Group!
4 CSWA 3
Long-slit spectral observations of CSWA 3 were performed on 2008 March 28/29 with the multi-mode focal reducer SCORPIO (Afanasiev & Moiseev, 2005) installed at the prime focus of the BTA 6-m telescope at the SAO in seeing. The slit was placed to include some of the light from the lens galaxy, as shown in the inset of Figure 8. We used the VPHG550G grism which covers the wavelength interval 3650–7550 Å with a spectral resolution 8-10 Å FWHM. With a CCD EEV 42-40 2k 2k detector, the reciprocal dispersion was Å per pixel. The total exposure time was 1800 s, divided into two 900 s exposures. The target was moved along the slit between exposures to ease background subtraction and CCD fringe removal. The bias subtraction, geometrical corrections, flat fielding, sky subtraction, and calibration to flux units () was performed by means of IDL-based software. From its spectrum, the source is a typical star-forming galaxy, with a redshift of , estimated from the prominent [O II] 3728 emission line. There are no other viable redshift identifications given the lack of additional emission features in the spectrum. We also measured the early-type galaxy lens redshift, , which was not included in the SDSS.
| L | A | B | C | |
| Coordinates | (0.00,0.00) | (3.00,-0.20) | (2.45,0.90) | (-1.55, 3.50) |
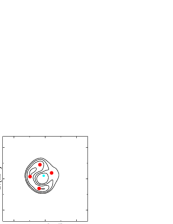
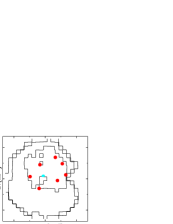
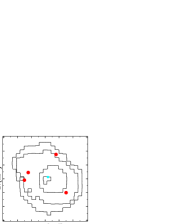
CSWA 3 lies in a known galaxy cluster, namely NSCS J124034+450923, as identified in the DPOSS survey by Lopes et al. (2004). The cluster itself is a ROSAT detected X-ray source. CSWA 3 is probably a quadruplet, with the faintest image undetected. To test this hypothesis, we build a PixeLens model, using the data on image locations given in Table 3. An ensemble-averaged solution for the Fermat surface and the projected mass distribution is shown in the left and right panels of Figure 9. The arc (or at least what we see of it) is quite circular, hinting that shear from the galaxy cluster plays a modest role. The lensing mass within the arc is – consistent with most of the lensing effect coming from a single massive early-type galaxy. Note that the contours of surface mass in the model are aligned in roughly the same direction as the luminous material in the lensing galaxy.
The PixeLEns model allows us to estimate the total magnification as . B is the brightest image with a magnification of , followed by A (magnification of ) and then C (magnification of ). The model predicts a fourth, fainter image D with magnification of , at the location of the saddle-point of the limacon in the Fermat time delay surface. In the model, its predicted location is offset by from the lens galaxy centre. This missing image should be detectable with deeper imaging. There is of course also a fifth, demagnified central image.
5 Conclusions
We have described The CAmbridge Sloan Survey Of Wide ARcs in the skY (CASSOWARY). This is a search for multiple blue components around massive red galaxies using data from the SDSS. The search strategy is simple and fast, enabling many experiments with different cuts to be performed quickly, generating many possible lens candidates. A ranked list of our best candidates is available at “http://www.ast.cam.ac.uk/research/cassowary/” It is clear from the recent discoveries by the CASSOWARY group (Belokurov et al., 2007) and others (Allam et al., 2007; Shin et al., 2008) that there are many such lenses within the SDSS.
We have presented new imaging, spectroscopy and modelling for two of our wide separation gravitational lenses, CSWA 2 and CSWA 3. These two lenses are distinguished from among many candidates only by the fact that we have obtained detailed spectroscopic and photometric follow-up.
CSWA 2, “the Cheshire Cat”, is a complex system in which there are two lensing galaxies and at least two sources. The Cat’s eyes are the lenses, namely two massive early-type galaxies at and respectively, whilst the Cat’s nose is a foreground galaxy that has minimal lensing effect. The two sources are a star-forming galaxy at and a high redshift galaxy (). They are transmogrified by gravitational lensing into giant arcs which form the Cat’s smile and eyebrows. The mass enclosed within the larger arc of radius is , greater than the Local Group!
CSWA 3 is simpler and has a standard morphology of three bright images on one side of the lensing galaxy and one faint image on the other side, although the latter is not detected in the SDSS data. The source is a star-forming galaxy at , which is being lensed by a foreground elliptical at . The radius of the arc is and the enclosed mass is , typical for a giant elliptical.
The study of large-separation lenses is important as a probe of the halo mass function. The extent and density profile of dark haloes, as well as possible signatures of the compression of dark halos by cooling baryons, may be extracted from the distribution of lens separations (Kochanek & White, 2001). The regime intermediate between the arcsecond separation lenses of typical strong galaxy lensing and cluster lensing is therefore of strategic significance in modern astrophysics. Surveys such as CASSOWARY and its competitors (Kubik, 2007; Shin et al., 2008) are providing our first forays into this new terrain.
Acknowledgements
We thank the referee, Peter Schneider, for many helpful suggestions that have improved the paper. NWE, PCH and RGM acknowledge support from the STFC-funded Galaxy Formation and Evolution programme at the Institute of Astronomy. Funding for the SDSS and SDSS-II has been provided by the Alfred P. Sloan Foundation, the Participating Institutions, the National Science Foundation, the U.S. Department of Energy, the National Aeronautics and Space Administration, the Japanese Monbukagakusho, the Max Planck Society, and the Higher Education Funding Council for England. The SDSS Web Site is http://www.sdss.org/. We thank Pablo Rodriguez-Gil for undertaking the long-slit observations at the WHT. The WHT and its service programme are operated on the island of La Palma by the Isaac Newton Group in the Spanish Observatorio del Roque de los Muchachos of the Instituto de Astrofsica de Canarias. The paper is also based on observations collected at the Centro Astronḿico Hispano Alemán (CAHA) at Calar Alto, operated jointly by the Max-Planck Institut für Astronomie and the Instituto de Astrofísica de Andalucía (CSIC). The paper was partly based on observations collected with the 6m telescope of the Special Astrophysical Observatory (SAO) of the Russian Academy of Sciences (RAS) which is operated under the financial support of Science Department of Russia (registration number 01-43). A.V.M. also acknowledges a grant from the President of Russian Federation (MK1310.2007.2)”
References
- Afanasiev & Moiseev (2005) Afanasiev V. L., Moiseev A. V., 2005, AstL, 31, 194
- Allam et al. (2007) Allam, S. S., Tucker, D. L., Lin, H., Diehl, H. T., Annis, J., Buckley-Geer,1 E. J., & Frieman, J. A. 2007, ApJ, 662, L51
- Belokurov et al. (2007) Belokurov, V. et al 2007, ApJ, 671, L9
- Bolton et al. (2004) Bolton, A. S., Burles, S., Schlegel, D. J., Eisenstein, D. J., & Brinkmann, J. 2004, AJ, 127, 1860
- Carroll (1866) Carroll, L. 1866, Alice’s Adventures in Wonderland, Macmillan, London
- Dye et al. (2008) Dye, S., Evans, N. W., Belokurov, V., Warren, S. J., & Hewett, P. 2008, MNRAS, 388, 384
- Eisenstein et al. (2001) Eisenstein, D. J., et al. 2001, AJ, 122, 2267
- Goto et al. (2002) Goto, T., et al. 2002, AJ, 123, 1807
- Inada et al. (2003b) Inada, N., et al. 2003, AJ, 126, 666
- Irwin & Lewis (2001) Irwin, M.J., Lewis, J.R., 2001, New Ast Rev, 45, 105
- Johnston et al. (2003) Johnston, D. E., et al. 2003, AJ, 126, 2281
- Kochanek & White (2001) Kochanek, C. S., & White, M. 2001, ApJ, 559, 531
- Kubik (2007) Kubik, D. 2007, MSc thesis, Univ of Chicago
- Lopes et al. (2004) Lopes, P. A. A., de Carvalho, R. R., Gal, R. R., Djorgovski, S. G., Odewahn, S. C., Mahabal, A. A., & Brunner, R. J. 2004, AJ, 128, 1017
- Peng et al. (2002) Peng, C. Y., Ho, L. C., Impey, C. D., Rix, H.-W. 2002, AJ, 124, 266
- Roth et al. (2005) Roth, M.M., Kelz, A., Fechner, T., et al., 2005, PASP, 117, 620
- Saha & Williams (2004) Saha, P., Williams, L. L. R. 2004, AJ, 127, 2604
- Sánchez (2004) Sánchez, S. F. 2004, AN, 325, 167
- Sánchez (2006) Sánchez, S. F. 2006, AN, 327, 850
- Shin & Evans (2008) Shin, E. M., & Evans, N. W. 2008, MNRAS, in press
- Shin et al. (2008) Shin, M.-S., Strauss, M. A., Oguri, M., Inada, N., Falco, E. E., Broadhurst, T., & Gunn, J. E. 2008, AJ, 136, 44
- Werner et al. (2008) Werner, M. C., An, J., & Evans, N. W. 2008, MNRAS, in press (arXiv:0804.3744)
- Willis et al. (2005) Willis, J. P., Hewett, P. C., & Warren, S. J. 2005, MNRAS, 363, 1369