Investigations of a coherently driven semiconductor optical cavity QED system
Abstract
Chip-based cavity quantum electrodynamics (QED) devices consisting of a self-assembled InAs quantum dot (QD) coupled to a high quality factor GaAs microdisk cavity are coherently probed through their optical channel using a fiber taper waveguide. We highlight one particularly important aspect of this all-fiber measurement setup, which is the accuracy to which the optical coupling level and optical losses are known relative to typical free-space excitation techniques. This allows for precise knowledge of the intracavity photon number and measurement of absolute transmitted and reflected signals. Resonant optical spectroscopy of the system under both weak and strong driving conditions are presented, which when compared with a quantum master equation model of the system allows for determination of the coherent coupling rate between QD exciton and optical cavity mode, the different levels of elastic and inelastic dephasing of the exciton state, and the position and orientation of the QD within the cavity. Pump-probe measurements are also performed in which a far off-resonant red-detuned control laser beam is introduced into the cavity. Rather than producing a measurable ac-Stark shift in the exciton line of the QD, we find that this control beam induces a saturation of the resonant system response. The broad photoluminescence spectrum resulting from the presence of the control beam in the cavity points to sub-bandgap absorption in the semiconductor, and the resulting free-carrier generation, as the likely source of system saturation.
pacs:
42.50.Pq, 42.60.Da, 78.67.HcI Introduction
In recent years, experimental investigations of cavity quantum electrodynamics (QED) have diversified from systems incorporating cooled alkali atoms in high-finesse Fabry-Perot cavities Kimble (1998); Hood et al. (2000); Pinske et al. (2000) and Rydberg atoms in superconducting microwave cavities Raimond et al. (2001); Walther et al. (2006) to chip-based implementations involving Cooper pair boxes and transmission line resonators Walraff et al. (2004), trapped atoms and monolithic dielectric microcavities Aoki et al. (2006), and epitaxially grown quantum dots embedded in semiconductor optical microcavities Reithmaier et al. (2004); Yoshie et al. (2004); Peter et al. (2005). Investigations of these new systems can proceed along a number of different paths. At a first level, they seek to confirm the observation of basic features of the Jaynes-Cummings model Jaynes and Cummings (1963) that describes the interaction of a two-level system with a quantized electromagnetic field. At the same time, phenomena specific to the experimental system at hand, such as the influence of electron-phonon interactions in semiconductors, are an important line of investigation. Thirdly, the scalability of these chip-based architectures, resulting from the planar fabrication techniques by which they are created, has inspired numerous theoretical proposals for quantum information processing Imamoglu et al. (1999); Blais et al. (2007), and recently, experimental progress in the form of coupling of two superconducting qubits through a resonant cavity Sillanpaa et al. (2007); Majer et al. (2007).
In this work, we study the interaction of a self-assembled InAs quantum dot (QD) coupled to the optical mode of a high quality factor () GaAs microdisk cavity, and present results that are largely focused on addressing the first line of investigation described above, but also touch upon the second. In regards to the former, we build upon recent experimental results Srinivasan and Painter (2007a), where the cavity-QD system is coherently excited and probed by a resonant optical field through use of a fiber taper waveguide. In comparison to the vast majority of semiconductor QD cavity QED work Reithmaier et al. (2004); Yoshie et al. (2004); Peter et al. (2005); Hennessy et al. (2007); Press et al. (2007), which rely upon incoherent excitation and probing via photoluminescence, the use of a resonant probe in this work (and in the work of Ref. [Englund et al., 2007]) to address the system through its optical channel provides a more analogous correspondence with spectral measurements done in atomic cavity QED Hood et al. (1998); Boca et al. (2004), and is a necessity for maintaining the coherence required in certain quantum information processing applications Kiraz et al. (2004). Use of the fiber taper waveguide coupling technique allows for an accurate estimate of quantities such as the intracavity photon number and absolute transmitted and reflected signals, due to the accuracy to which the cavity-waveguide coupling efficiency and any losses in this all-fiber measurement setup are known. We present measurements of the cavity’s spectral response as it is tuned with respect to the neutral exciton line of an isolated QD while operating in the linear (weak driving) regime with an average intracavity photon number . These measurements show clear anti-crossing and vacuum Rabi splitting behavior with the system operating in the strong coupling regime, where the single photon cavity-QD coupling rate exceeds both the cavity loss rate and QD decay rate Kimble (1998). Fixing the cavity detuning with respect to the neutral exciton transition of the QD, we also measure the spectral response as a function of the probe beam power, and observe system saturation for . A previously developed quantum master equation model for this system Srinivasan and Painter (2007b) is fit to the measured data, providing estimates for the cavity-QD coupling strength, relative position and orientation of the QD within the cavity, and exciton dephasing rates (both elastic and inelastic dephasing).
The fact that the QD is embedded in a host semiconductor matrix can give rise to a number of effects not typically seen in atomic systems, such as spectral diffusion and phase destroying collisional processes due to electron-phonon and electron-electron scattering. At the end of this paper, we consider the influence of material absorption and subsequent free-carrier generation on the saturation behavior of the coupled microdisk-QD system. This is done by characterizing the system in a pump-probe experiment. By fixing the probe beam power to the weak driving limit () and sweeping its frequency to trace out the system’s resonant spectral response, and then coupling a control laser beam into a far red-detuned cavity mode, we can examine the effects of below bandgap (in energy) excitation on the system. We observe saturation for control beam powers that generate in the off-resonant cavity mode, about one order of magnitude larger than the saturation we observe when varying the probe beam power. We attribute this new saturation to absorption from bulk defect and surface states of the semiconductor, and the subsequent generation of free carrier charges that cause spectral diffusion, blinking, and dephasing of the exciton states within the QD Santori et al. (2004). These processes may be of importance in future pump-probe measurements of semiconductor cavity-QD systems, which could be used to further investigate the structure of the Jaynes-Cummings system Thompson et al. (1998); Walraff et al. (2007) or to provide a level of control on the cavity-QD interaction Schuster et al. (2005), for example, through the ac-Stark effect.
The organization of this paper is as follows: in section II, we review the experimental system studied and highlight some of the important aspects of the methods used. Section III describes the fabrication and initial measurements done to identify suitable devices for the coherent probing experiments. Section IV is an extension of the work presented in Ref. [Srinivasan and Painter, 2007a], and in particular, presents some additional data on a strongly coupled microdisk-QD system, as well as a more extended discussion of how the experimental data was fit to the numerical model presented in Ref. [Srinivasan and Painter, 2007b]. Section V presents similar data, but for a system that is in the bad cavity limit with and (allowing for resolved vacuum Rabi splitting in cavity transmission and reflection). At the end of this section, we present data on the two saturation mechanisms mentioned above, and discuss the possible origin of the resonant system response saturation effected by the far off-resonance control laser beam.
II Experimental system
II.1 Fiber taper waveguide coupling
Two of the primary difficulties in performing resonant optical measurements on the microcavity-QD system are effectively coupling light into the system and then separating QD fluorescence from incident light that has been scattered off defects, other portions of the sample, etc. Recent experiments involving resonant excitation of a QD Muller et al. (2007); Melet et al. (2007) have utilized geometries in which the QD is excited by an in-plane beam and the vertically emitted fluorescence is measured. Alternately, in Ref. [Englund et al., 2007], the authors direct a micron-scale probe beam onto the cavity surface and measure the reflected signal in cross-polarization, with an estimated coupling efficiency into the cavity mode of 1 to 2 .
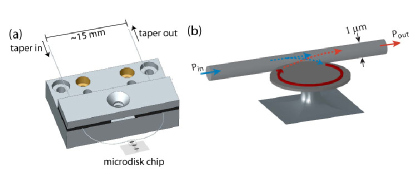
The approach we use relies upon evanescent coupling between a waveguide probe and the microcavity Srinivasan and Painter (2007a). The waveguide probe is an optical fiber taper Knight et al. (1997), which is a standard single mode fiber that has been heated and stretched down to a wavelength-scale minimum diameter in a symmetric fashion, so that the overall structure is a double-ended device in which the input and output regions are both composed of standard single mode fiber. In the region of minimum fiber diameter, the evanescent field of the waveguide mode extends significantly into the surrounding air, so that it can excite the microcavity’s modes when it is brought close to it (Figure 1). The tapering process is done adiabatically over a distance of 5 mm to 10 mm, so that its transmission level is typically better than 50 (fractional transmission ), and can routinely be better than 90 (0.9). For a properly chosen cavity geometry and taper size, the regimes of critical coupling and overcoupling can be achieved with little parasitic coupling loss, even for a cavity fabricated in a high refractive index semiconductor Borselli (2006). The overall coupling efficiency into the cavity mode, , can exceed 10 to 20 for typical devices, where is the transmission contrast of the resonance dip in the taper’s transmission spectrum that results from coupling to the cavity mode (, where is the normalized transmission level on-resonance). This overall coupling efficiency relates the dropped (coupled) power into the cavity () with the input power into the taper (), with .
Perhaps more important than the magnitude of the coupling efficiency is the accuracy to which the intracavity photon number can be estimated for a given optical input power. The fiber taper waveguide allows one to probe the cavity-QD system through a single electromagnetic spatial mode (there are actually two degenerate taper modes of distinct polarization; however, by using a fiber polarization controller one can select for the polarization that matches the cavity mode of interest). As the fiber tapers are formed from single-mode optical fiber, the input, transmission, and reflection signals carried by the fiber taper are naturally filtered for the fundamental taper mode (all other higher-order modes radiate away into the cladding of the single-mode fiber). For a single spatial mode, the transmission contrast of the fiber-coupled cavity, a result of interference between the light transmitted past the cavity with that coupled into and re-emitted from the cavity, can be used along with the width of the cavity spectrum to determine the coupling rate of input light from the taper waveguide into the cavity mode and the average intracavity photon number with high accuracy. This should be contrasted with a multi-mode excitation and detection scheme (such as many free-space techniques) in which interference is only partial and the determination of the actual intracavity photon number is compromised. The use of an all-fiber setup, where system losses can be easily measured, also means that absolute measurements of the transmitted and reflected signals can be made. This allows us to quantitatively compare our experimental results with a quantum master equation model for the system. This is of particular importance in trying to identify non-ideal behavior in the experimental system and potential ways in which the QD behaves differently than an ideal two-level system.
As discussed above, for a single spatial mode interacting with the cavity, the cavity’s transmission spectrum, along with knowledge of and , allows us to determine the on-resonance internal cavity energy () and average intracavity photon number () through the relation,
| (1) |
where is the cavity mode resonance frequency and is the cavity due to intrinsic losses such as absorption and scattering as well as parasitic losses stemming from cavity radiation into higher-order modes of the fiber taper Barclay et al. (2005). Here we assume symmetric loss in the taper (usually a very good approximation), so that is the fractional transmission between taper input and the taper-cavity coupling region. In practice, we don’t measure , but instead measure the total loaded quality factor (or more precisely a loaded linewidth ), which in addition to intrinsic and parasitic losses, also includes cavity radiation into the fundamental mode of the fiber taper waveguide. Off-resonance excitation of the cavity simply results in a cavity energy which is scaled by a Lorentzian term, , where is the detuning. Following the waveguide-cavity coupled mode theory analysis presented in several other works Manolatou et al. (1999); Spillane et al. (2003); Barclay et al. (2005), we can write
| (2) |
where () is appropriate for the undercoupled (overcoupled) regime, in which the waveguide-cavity coupling rate is less than (greater than) the total of the intrinsic and parasitic loss rates. Replacing in eq. (1), we arrive at
| (3) |
so that and are written in terms of the measured quantities , , , , and .
Past measurements have shown that the fiber taper coupling method can be applied to both semiconductor microdisks Borselli (2006); Srinivasan et al. (2005) and photonic crystals Srinivasan et al. (2004); Barclay et al. (2005). We have chosen to focus our cavity QED studies on microdisks due to the ability to achieve efficient coupling without the necessity of an intermediate on-chip waveguide element, as was used in Ref. [Barclay et al., 2005], and the relative ease in cavity fabrication. As described elsewhere Painter et al. (2008), direct taper coupling to photonic crystal cavities Akahane et al. (2003) can produce values in excess of 50 , but at such coupling levels a significant amount of parasitic loss is also present, degrading the from its intrinsic level to a loaded level . In contrast, we have been able to directly taper couple to ultra-small mode volume () microdisk cavities while achieving and Srinivasan et al. (2005). Nevertheless, the ability to investigate different cavity geometries is one strength of this technique. A second is its applicability to other solid-state systems and materials of both high and low refractive index Barclay et al. (2006).
II.2 Experimental setup
As described elsewhere Srinivasan and Painter (2007c), the fiber taper waveguide coupler (mounted as shown schematically in Fig. 1(a)) and microdisk chip are incorporated into a customized continuous flow liquid He cryostat that uses piezo-actuated slip-stick and flexure stages to achieve precise cavity-taper alignment. The fiber pigtails are fed out of the cryostat and are connected to a number of fiber optic elements (Fig. 2), such as fiber polarization-controlling paddle wheels (FPC), variable optical attenuators (VOA), and fused fiber couplers, which in total create an all-fiber setup where the only free-space optics needed are for imaging. The setup has been configured so that it is simple to switch between photoluminescence measurements and resonant transmission and reflection measurements.
Photoluminescence (PL) is performed through use of a nm band external cavity tunable diode laser as a pump source (Fig. 2(a)). The pump laser emission is directed into the fiber taper after first going through an attenuator, a 50:50 coupler, and the 10 port of a 10:90 fiber coupler. The fiber taper is aligned along the microdisk edge, exciting whispering gallery mode (WGM) resonances that are mapped out as a function of wavelength by tuning the laser and recording the transmitted signal with an InGaAs avalanche photodiode (APD). The pump laser is fixed on-resonance with a WGM (which typically has a limited to due to strong material absorption in this wavelength band) and the resulting photoluminescence is collected into both the forward and backward channels of the fiber taper. The 90 port of the 10:90 coupler is used to direct the backward channel into a 550 mm grating spectrometer with a cooled InGaAs linear array detector (512 elements, 25 m pixel width) and an effective spectral resolution of 35 pm at m.
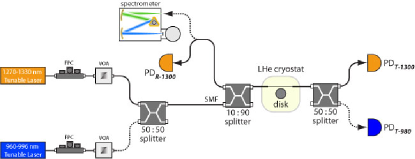
Resonant transmission and reflection measurements (Fig. 2) are performed using a probe laser consisting of an external cavity tunable diode laser (linewidth 5 MHz) with continuous tuning in the nm to nm band. The probe laser beam is sent through an attenuator, 50:50 coupler, and 10:90 coupler before entering the fiber taper. The transmitted signal is measured with a thermoelectric-cooled InGaAs APD with a 1 kHz bandwidth, while the reflected signal, previously directed to the grating spectrometer in PL measurements, is measured with either a liquid nitrogen cooled InGaAs APD (150 Hz bandwidth) or a second thermoelectric-cooled InGaAs APD. Although the experimental setup allows for both the 980 nm and 1300 nm lasers to be simultaneously directed into the microdisk cavity, for the experiments described here, only one of these two lasers is used at a given time. For the pump-probe measurements described later (see Fig. 15(a)), a to nm band external cavity tunable diode laser (linewidth 5 MHz) is used to excite the microdisk cavity while it is simultaneously probed resonantly with the nm laser beam.
The accuracy to which we can estimate intracavity photon number and other important parameters of the coupled cavity-QD system using the above experimental apparatus is dominated by uncertainties in the optical loss within the various fiber optic components and the calibration accuracy of optical power and frequency tuning of the probe laser. As given by eq. (3), the intracavity photon number depends upon , , , and . Uncertainty in the input power at the microdisk is related to the sweep-to-sweep laser power fluctuations ( ), uncertainty in the symmetry of the optical loss of the fiber taper about the microdisk resonator ( ), and the variable optical loss in the fiber unions between various fiber connections ( ). Knowledge of the actual dropped power into the resonator is also affected by the uncertainty in , which contains contributions from noise in our detected signal ( ) and the degree to which the polarization of the input signal has been properly aligned with the TE-polarized cavity mode ( ). The accuracy to which we know is related to the accuracy of the measured linewidth of the cavity mode, which is at the level due to our calibration error in the frequency tuning range of the probe laser. In sections IV and V, we plot quantities such as at a fixed wavelength against , where the error bars plotted for these quantities are calculated by propagating the above uncertainties appropriately.
III Device preparation
III.1 Fabrication
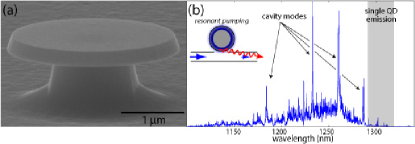
The microdisks (Fig. 3(a)-(b)) are fabricated in a material consisting of a single layer of InAs QDs embedded in an In0.15Ga0.85As quantum well that resides in a 256 nm thick GaAs waveguide. This dot-in-a-well (DWELL) epitaxy Stintz et al. (2000); Liu et al. (2000); Cade et al. (2005, 2006) is grown on top of a 1.5 m thick Al0.7Ga0.3As layer that resides on a semi-insulating GaAs substrate. In contrast to recent experiments in which the QDs were grown with a low enough density that only a single QD physically resided within the cavity Badolato et al. (2005); Hennessy et al. (2007), the density of QDs in the DWELL material ( 300 m-2) means that there are on the order of 1000 QDs within a 2.5 m diameter microdisk. To limit the number of QDs that interact with the cavity mode of interest, we fabricate microdisks of an appropriate diameter so that this mode lies within the far red-detuned tail of the QD distribution (Fig. 3), at a wavelength of m where isolated single QD emission within this material was previously observed Srinivasan et al. (2007). A (top) disk diameter m is chosen in accordance with the results of finite element method simulations Srinivasan et al. (2006) which indicate that a TEp=1,m=14 whispering gallery mode (WGM) is resonant in the microdisk at nm. The mode label TEp,m corresponds to a mode of (dominantly) transverse electric (TE) polarization, field antinodes in the radial direction, and an azimuthal mode number corresponding to the number of wavelengths around the circumference of the disk. The TEp=1,m=14 mode has a radiation-limited (i.e., without taking into account fabrication-induced roughness or material absorption) and an effective standing wave mode volume of (disk refractive index ). This effective mode volume can be used to estimate the strength of coherent coupling between the exciton state of an embedded QD and a cavity mode photon. For a QD that is placed at a cavity field antinode, whose exciton transition has an electric dipole parallel to the cavity mode field polarization, and for a typical exciton spontaneous emission lifetime 1 ns, the coherent coupling rate is approximately 15 GHz. This value represents the maximum expected coupling rate in this system. In comparison, a typical QD dephasing rate is GHz Bayer and Forchel (2002) (if strictly radiatively broadened, GHz), and the cavity decay rate for is GHz, so that strong coupling () is potentially achievable in these devices.
III.2 Device identification
For a given sample, typically consisting of 50 microdisk cavities, the procedure for investigating its potential for strong coupling is as follows: (1) Optical spectroscopy with the fiber taper waveguide is used to identify the spectral position and of cavity modes at room temperature. In the wavelength range of interest, the wavelength blue shift between room and low temperature is 17 nm. (2) PL measurements through the fiber taper are performed at 8 K to 15 K, identifying the spectral position of QD states. Transmission and reflection measurements through the fiber taper versus wavelength are performed to confirm the spectral position of the cavity modes. (3) If the cavity mode of interest is nm blue of the QD exciton state, it can be tuned into resonance in-situ by introducing N2 gas into the cryostat Srinivasan and Painter (2007c); Mosor et al. (2005). If the cavity mode is red of the QD exciton, the sample is removed from the cryostat and blue-shifted through a digital etching process Hennessy et al. (2005), and the steps are repeated.
III.2.1 Room temperature cavity mode spectroscopy
Room temperature cavity mode spectroscopy serves to eliminate from consideration those devices whose cavity mode lies outside of the wavelength range for which isolated single QD emission would likely occur ( nm - nm). It also gives an indication of the cavity mode , although because the cavity mode and the QD ensemble have different temperature-dependent frequency shifts, the amount of absorption suffered by the cavity at room temperature is different (and larger) than it is at low temperature. Nevertheless, the room temperature measurement can at least provide a lower bound on . For example, we have found that, for a TE1,14 mode at nm at cryogenic temperatures, to (Fig. 4(a)-(b)), while at room temperature, this mode is red-shifted by 17 nm and has to .
We can gain further information about the cavity by studying TE1,m modes in a far red-detuned wavelength band ( nm to nm), so that we can largely eliminate the effects of the QD absorption 111This estimate is possible because radiation losses for TE1,m remain essentially negligible over this wavelength range for the microdisk diameters we use, and because scattering losses remain approximately constant.. These modes differ in azimuthal mode number by to in comparison to the TE1,14 mode at nm. Using the fiber taper to perform passive spectroscopy with the appropriate external cavity tunable diode laser, we see (Fig. 4(b)) that the tends to increase at longer wavelengths, with a highest at nm ( at this wavelength), approximately twice as large as the in the 1300 nm band. These results indicate that the of the mode of interest at nm is absorption-limited, although separating the loss into bulk and surface absorption components requires further investigation. In addition, these results are consistent with those presented in Ref. [Michael et al., 2007], where absorption losses were seen to increase as the wavelength was reduced from 1600 nm to 960 nm.
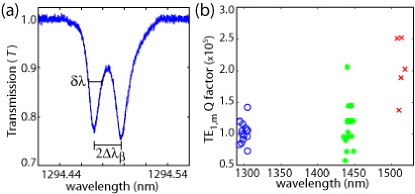
As seen in Fig. 4(a), even in absence of coupling to a QD, the microdisk WGMs in our structures typically appear as a resonance doublet. This doublet structure is due to surface roughness that couples and splits the initially degenerate clockwise and counterclockwise propagating modes of the disk, and has been observed in numerous WGM cavities Weiss et al. (1995); Kippenberg et al. (2002); Borselli et al. (2005); Srinivasan et al. (2005). To some extent, the presence of this doublet splitting complicates the nature of cavity-QD interactions within this system - both the presence of the second cavity mode and passive modal coupling due to the surface roughness must be taken into account to properly describe the system. This has been outlined in the quantum master equation model developed in Ref. [Srinivasan and Painter, 2007b], and is re-considered qualitatively in Section IV.3, where we discuss numerical modeling of experimental results.
III.2.2 Low temperature fiber-based photoluminescence measurements
After room temperature cavity spectroscopy has been performed, the sample is cooled down between 8 K to 15 K and those devices for which cavity modes are appropriately spectrally positioned are investigated in PL. In comparison to more conventional free-space PL measurements, the fiber-based method we use offers two advantages Srinivasan et al. (2007). The first is an improvement in collection efficiency by nearly 1 to 2 orders of magnitude over our free-space measurements. The second is the spatial selectivity gained by pumping the microdisk through a 980 nm band WGM. By limiting the pumping area to the periphery of the microdisk, we selectively excite those QDs which are most likely to be overlapped with the 1300 nm cavity mode of interest. Even better spatial selectivity can be achieved, for example, by pumping the cavity on a WGM that is separated in -number by one from the 1300 nm mode, so that the radial spatial overlap between the two modes is nearly perfect.
A PL spectrum for a device under resonant pumping of a 980 nm WGM is shown in Fig. 5. QD states are identified in accordance with the procedure followed in Ref. [Srinivasan et al., 2007], which relied upon measurements of the pump power dependence of the emission into each state and the spectral splittings between the states, as well as the close correspondence with previous spectroscopy of single DWELL QDs by other researchers Cade et al. (2005, 2006). Of particular interest to this work are the two neutral exciton lines of the QD, and , which correspond to orthogonally polarized transitions split by the anisotropic electron-hole exchange interaction resulting from asymmetries in the QD Cade et al. (2006). Cavity modes are typically identifiable in PL as well (emission from cavity modes can be seen even when the cavity and QD are far-detuned Hennessy et al. (2007); Strauf et al. (2006), and may result from the enhanced density of states for an ultra-small volume cavity mode), and can be unambiguously confirmed through resonant spectroscopy with the 1300 nm tunable laser.
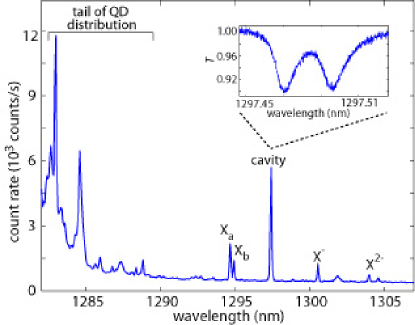
Only a small fraction of devices (5 ) produce a PL spectrum like that in Fig. 5, where the cavity mode is within a few nm of the isolated exciton lines of a single QD. As discussed above, this low yield is due to the necessity of working in the red-detuned tail of the QD distribution to limit the number of QDs that are spectrally near the cavity mode of interest and the random positioning of the cavity with respect to these QDs.
III.2.3 Cavity mode tuning
We employ two mechanisms to tune the cavity modes. Digital etching Hennessy et al. (2005) outside of the cryostat is used to blue-shift the cavity modes in discrete increments, while N2 adsorption within the cryostat Srinivasan and Painter (2007c); Mosor et al. (2005) provides essentially continuous (red) tuning over a range of about 4 nm. As the N2 tuning method allows for real-time monitoring of cavity-QD interactions, the desired cavity mode position after fabrication (and any subsequent digital etching) is within a few tenths of a nm blue of the QD exciton state, so that the system can be effectively studied as a function of cavity-QD detuning across resonance 222The N2 process produces a wavelength shift as great as 4 nm, so that the cavity mode can be further blue of the QD exciton and still be tuned into resonance. However, at those tuning levels the cavity is also significantly degraded, by as much as a factor of 3 as studied in Ref. [Srinivasan and Painter, 2007c]..
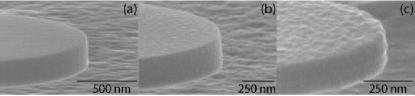
The digital etching process consists of alternating steps of oxidation, either in atmosphere or in hydrogen peroxide (H2O2), and oxide removal through a 1 molar solution of citric acid (C6H8O7). The native oxidation/C6H8O7 process produces a relatively small cavity mode blue-shift of 0.8 nm per cycle, and does not degrade the cavity for the devices studied () and the number of etch cycles investigated (up to 6). The H2O2/C6H8O7 process produces a much larger cavity mode blue-shift of 4.5 nm per cycle for a small number of cycles (), and increases the cavity mode linewidth by . As the number of cycles increases further, the amount of blue-shift per cycle increases ( nm for 6 cycles), as does the increase in cavity mode linewidth ( for 6 cycles). SEM images of the microdisks during this process (Fig. 6) indicate that the degradation in should not be too surprising - even after 2 cycles of the H2O2/C6H8O7, the microdisk surface is noticeably altered (Fig. 6(b)), and after a large number of cycles, the damage to the disk is quite significant (Fig. 6(c)).
IV Coherent optical spectroscopy of a strongly coupled microdisk-QD system
In this section, we present detailed measurements and analysis of the system studied in Ref. [Srinivasan and Painter, 2007a]. Although some amount of repetition is necessary to provide background and context, we have attempted to minimize this and will instead rely upon citing the previous work when appropriate.
IV.1 Vacuum Rabi splitting measurements
The device whose PL spectrum is shown in Fig. 5 presents a clear candidate for strong coupling measurements. Four cycles of the native oxidation/C6H8O7 process are used to blue-shift the cavity mode, initially 3 nm red-detuned (see Fig. 5), so that it is 260 pm blue detuned of the QD neutral exciton line. At this spectral position, the cavity mode can easily be tuned into resonance with the neutral ground-state QD exciton lines, and the transmitted and reflected signals can be monitored by employing the experimental setup depicted in Fig. 2(a).
Although continuous observation of the cavity response during the adsorption process can be done Srinivasan and Painter (2007c), and is limited only by the detector bandwidth (1 kHz) and data acquisition rate, maintaining an adequate signal-to-noise ratio requires us to average 10 to 20 single scans for every cavity tuning point. As a result, the cavity is tuned in discrete steps by opening the valve between the N2 chamber and the cryostat for a fixed time (5 s), waiting until the cavity mode position stabilizes, averaging the signal, and repeating. Over relatively small tuning ranges, the amount of tuning per step is approximately constant, and we typically choose a value of (123) pm per step, which is controlled by adjusting the N2 flow rate.
Figure 7 presents a series of spectra showing the normalized (to unity) transmitted and reflected signal from the cavity over a tuning range of 240 pm, where the cavity is driven by the tunable laser with an input power of 470 pW, so that and the system is well within the weak driving limit. In this figure, the transmitted and reflected signals are plotted against laser-QD detuning () and cavity-QD detuning (). As the pair of doublet cavity modes are tuned towards the short wavelength neutral exciton line () of the QD, they undergo a significant change in lineshape. Interaction with the line causes the long wavelength cavity mode of the doublet pair to tune at a slower rate than the short wavelength cavity mode, resulting in the formation of a singlet resonance. In addition, a third resonance peak associated with the line begins to appear on the red-side of the cavity modes. Further tuning of the mode on to resonance with the QD results in the anti-crossing and spectral splitting (vacuum Rabi splitting) that are most easily visible in the image plots of Figure 7 - in comparison to the bare-cavity (far-detuned from the QD) mode spectrum where the doublet shape is due to surface roughness which induces modal coupling between the propagating modes of the disk, the doublet spectrum seen when the cavity and QD are resonant is due to exciton-mode coupling, with a spectral splitting that is much larger. The magnitude of this splitting relative to the peak linewidths indicates that the system is in the strong coupling regime (), which is confirmed by the detailed analysis of the data presented in section IV.3. Once the cavity is tuned sufficiently far past the line, it regains its initial bare-cavity shape.
The N2 tuning mechanism allows for the cavity to be easily tuned through the other fine-structure split neutral exciton line of the QD, the line (see Fig. 5). A series of reflected spectra showing the cavity mode tuned through both the and lines is shown in Fig. 8. In this data set, tuning through the line was done with a relatively large step size, after which the step size was reduced. Due to the extent of the tuning, after the line is crossed, the step size is no longer constant, but instead changes nonlinearly Srinivasan and Painter (2007c). A nonlinear (quadratic) transformation to convert between N2 step number and cavity mode detuning was used to produce Fig. 8 from the raw data.
Tuning past the line, we see the cavity mode tune smoothly and without interruption, until we observe a small frequency shift that appears as a kink in the spectrum at pm past the transition. This spectrally corresponds to the position of the line, with the small dispersive shift due to the cavity weakly coupling to it. The relative strength of coupling between the cavity and the and lines can be related to the polarization of the cavity mode, which is primarily oriented along the radial direction of the microdisk. The strong coupling of the line to the cavity mode indicates that this transition is polarized along the radial direction. The transition is orthogonally polarized to the transition, and thus is coupled to the cavity mode through its weaker azimuthal electric field component. As the polarization of the fine-structure split neutral exciton lines is related to the geometry and orientation of the QD within the InGaAs/GaAs host Cade et al. (2006), the relative coupling strengths of the and exciton lines is an indication of the QD orientation along the radial direction of the microdisk.
IV.2 Nonlinear spectroscopy
The physical trapping of the QD within a solid material means that complete spectral characterization of the cavity-QD system as a function of laser power can be made. In comparison, such a measurement is much more challenging in atomic physics based experiments, where measurements on one-and-the-same atom are limited by trap times of 1 s to 10 s Boca et al. (2004). Reference [Srinivasan and Painter, 2007a] presented measurements of the reflected spectrum near resonance (12 pm), and showed that saturation occurs for . Here, we complement that work with measurements of the transmitted spectrum, and show how the transmission contrast can be varied significantly by adding less than one intracavity photon to the system.
We first re-consider the QD-cavity system close to resonance, labeled as scan ’i’ in Fig. 7(a),(c). Varying the dropped power into the cavity between 10 pW and 10 nW, we plot a series of transmitted and reflected spectra in Fig. 9(a)-(d). Here, the spectra are plotted as a function of laser detuning from the short wavelength peak of the doublet. As increases, the spectral splitting decreases and the spectra saturate towards their bare-cavity shape. This saturation can perhaps best be seen by plotting a specific spectral feature against and , determined through eq. (1). In Ref. [Srinivasan and Painter, 2007a], the spectral splitting in the reflected signal and the peak reflected signal level were examined. We supplement that here in Fig. 9(e) by following the transmission contrast () at the bare-cavity position of the longer wavelength doublet resonance (marked by a dashed line in Fig. 9(a)). The data shows saturation for , with increasing by over a factor of when going from weak to strong driving. Larger changes in the relative transmission contrast between the weak and strong driving regimes can be achieved by adjusting the cavity-QD detuning level and judiciously choosing the wavelength at which the transmission contrast is recorded.
For low power switching applications, the system studied here has a number of potentially important advantages. Along with the strong optical nonlinearity available at the single photon level and the robustness of using a monolithic, semiconductor system, the fiber coupling method translates the small intracavity photon numbers at which saturation occurs into low input powers. This is a key point, as it is the parameters of the QD-cavity system that set the intracavity photon number at which saturation occurs, but it is the efficiency of coupling into the cavity (quantified by a coupling parameter given by , the ratio of waveguide-cavity coupling to the total of intrinsic and parasitic loss) that determines the input power at which this intracavity photon number occurs. In the devices studied here, the input power into the taper is only about a factor of 5 larger than , so that saturation occurs for nW.
Clearly, investigation of the time-dependent characteristics of this system is necessary before too much more can be said about switching applications. Nevertheless, a few comments can be made on the basis of the steady-state nonlinear spectroscopy we have performed. Improving the ratio of in the strong and weak driving regimes will be important in ultimately being able to discriminate between the ’on’ and ’off’ response of the system. The key ingredient in such an optimization would be an improvement in the taper-cavity coupling, which can straightforwardly be achieved through slightly smaller diameter cavities. In addition, the reflected signal may ultimately be a preferred option, due to the comparative ease with which a null signal can be generated. However, effective use of the reflected signal will likely require larger absolute reflection values; as discussed in the following section, the peak reflected signal (normalized to input power) for the device discussed here is 0.6 .
IV.3 Numerical modeling
| Symbol | Description |
|---|---|
| incident/reflected/transmitted signal | |
| cavity decay rate due to waveguide coupling/intrinsic loss | |
| total cavity loss rate = 2 + | |
| cavity clockwise/counterclockwise field amplitude | |
| cavity-QD coupling rate for traveling wave modes | |
| QD energy dephasing rate | |
| QD non-radiative decay rate | |
| QD transverse decay rate = /2 + | |
| surface roughness induced cw/ccw mode coupling | |
| relative phase between surface scattering and exciton-mode coupling | |
| cavity-QD coupling rate for standing wave modes, known from and |
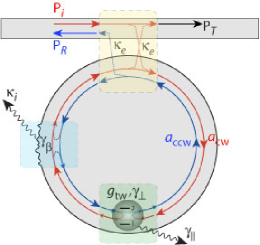
The steady-state behavior of the system is modeled using a quantum master equation (QME) approach, as described in detail in Ref. [Srinivasan and Painter, 2007b]. The standard picture of single mode cavity QED Carmichael (1993) with an atom-cavity coupling strength , cavity loss rate , and atomic decay via spontaneous emission (spontaneous emission lifetime ) is augmented to include a number of features specific to the system we study. These include: (1) a second cavity mode, as WGM microcavities support degenerate clockwise () and counterclockwise () propagating modes; (2) modal coupling at a rate between the and modes, due to fabrication-induced surface roughness; (3) additional decay channels for the QD, where along with radiative decay at a rate we consider additional inelastic dephasing processes so that the QD energy dephasing rate can be larger than . We also consider the possibility of pure elastic dephasing at a rate , with the total transverse dephasing of the QD being ; and (4) input-output coupling to the optical fiber taper waveguide, so that the total cavity decay rate is split into an intrinsic loss component and a coupling decay rate into each of the forward and backward channels of the fundamental mode of the fiber taper. Figure 10 schematically describes the system considered in the model, while Table 1 lists the relevant parameters involved.
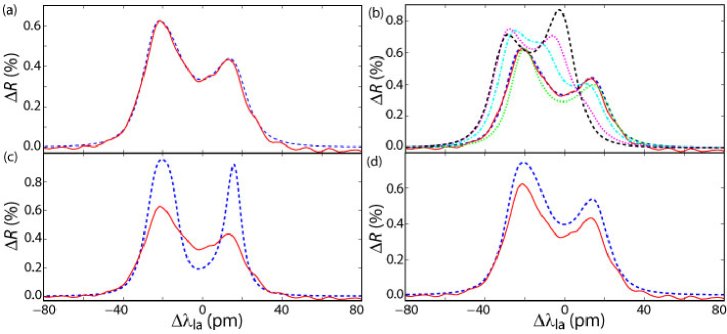
Figure 11(a) compares simulation and experimental results for the scan marked ’i’ in Fig. 7(c), with the values of the relevant physical parameters used in the model listed in Table 2. Importantly, the comparison of the simulated and experimental results is done on the absolute reflected signal (), which is normalized to input power rather than unity, so that both the shape and amplitude of the signal are considered in fitting the data. Examining the reflected spectrum has benefit in that it is a direct probe of the intracavity field (suppressing all non-resonant light not coupled into the cavity-QD system). In Table 2 we have noted the ’source’ of the parameter, whether it be from the bare-cavity transmission spectrum or if it is obtained through a fit to the measured resonant cavity-QD reflection and transmission data. The listed uncertainty value for each parameter is that due to the uncertainty in the measured data (such as wavelength detuning and/or reflected signal amplitude) and the corresponding range of parameter values that fit the data to within this uncertainty range.
The bare-cavity spectrum, far blue-detuned of the QD exciton, can be fit with a simple coupled mode theory (CMT) model. The CMT model gives directly the total cavity decay rate and waveguide-cavity coupling depth , from which and are determined. The CMT model also yields the amplitude of the modal coupling rate , corresponding to the doublet mode splitting seen in Fig. 4(a).
The rest of the parameters, associated with cavity mode coupling to the excitonic state of the QD, are determined by examining the resonant reflection and transmission data, and fitting it to the QME model. The cavity-QD detuning is known by determining the position of resonance, through an anti-crossing measurement such as in Fig. 7, and knowledge of the approximate wavelength tuning per N2 adsorption step. The relative backscattering phase, , is determined by the QME model fit to the reflected and transmitted signal across the entire anti-crossing curve of Fig. 7. Its value is estimated, based upon the quality of the QME model fit, to be .
The splitting between the branches of the anti-crossing diagram at zero detuning is used to help determine the cavity-QD coupling rate . Modal coupling between the and traveling wave modes is mediated by both surface roughness and the resonant interaction with the exciton states of the QD, and as a result, the cavity-exciton coupling rate for standing wave modes depends on the relative phase between the two (). In particular, is modified by a factor of in comparison to the coherent coupling to a purely travelling wave WGM () Srinivasan and Painter (2007b). For , the exciton primarily couples to the longer wavelength standing wave cavity mode, and the on-resonance vacuum Rabi-splitting therefore very closely corresponds to . We then determine and from the above formula in terms of and .
Finally, the decoherence of the excitonic state of the QD, as determined by and , affect the width, contrast, and amplitude of the Rabi-split peaks in the reflected spectrum, providing us with a method for estimating each of their values from the QME model. Specifically, for the system under study, the pure dephasing of the excitonic line () sensitively affects the linewidth and contrast of the reflected resonance peaks and only weakly affects the overall amplitude of the reflected signal. The population decay rate, , in contrast, has a significant impact on the resonant reflected signal amplitude through additional loss added to the system, while contributing only weakly to the resonance peak linewidths due to the relatively fast bare-cavity decay rate.
| Parameter | Value | Source |
|---|---|---|
| GHz | bare-cavity transmission | |
| GHz | bare-cavity transmission | |
| GHz | bare-cavity transmission | |
| GHz | bare-cavity transmission | |
| coupled cavity-QD tran./refl. spectrum | ||
| GHz | coupled cavity-QD tran./refl. spectrum | |
| GHz | coupled cavity-QD tran./refl. spectrum | |
| GHz | coupled cavity-QD tran./refl. spectrum | |
| GHz | coupled cavity-QD tran./refl. spectrum | |
| GHz | coupled cavity-QD tran./refl. spectrum | |
| GHz | coupled cavity-QD tran./refl. spectrum |
The results of our modeling confirm that the exciton line and the TE1,14 cavity mode are in the strong coupling regime, with 2.93 GHz, more than a factor of two times larger than the average of 1.62 GHz and 1.17 GHz 333We have corrected two typos in Ref. [Srinivasan and Painter (2007a)], where and were incorrectly quoted. The values that were quoted in that work were appropriate when the cavity was far-detuned (a few tenths of a nm) from the QD. The corrected values are appropriate for the cavity mode just blue-detuned of the QD, and are larger due to additional loss induced by the N2 tuning process Srinivasan and Painter (2007c).. This can be compared to the expected coherent coupling rate between cavity mode and exciton line, given for a traveling wave mode by , and as mentioned above, multiplied by a factor of for standing wave modes. In this expression, is the spontaneous emission lifetime of the excitonic transition, is the speed of light, is the refractive index of the semiconductor host, is the emission wavelength, and takes into account the position and orientation of the exciton dipole (1 in the case of ideal coupling; in practice, ). is the effective mode volume for a traveling wave mode, and is 6.4 for the mode of interest in the cavity under study, as determined by finite element method simulations. For a spontaneous emission lifetime of ns, typical of similar QD excitons Bayer and Forchel (2002), the measured value of for coupling to the exciton line is a little more than five times smaller than the estimated maximum achievable value GHz, so that . The measurements of weak coupling to the other fine-structure split exciton line () in Section IV.1 indicate that the line is relatively well-aligned in polarization with the predominantly radially polarized cavity mode. As a result, we estimate that spatial misalignment is the primary cause for the reduced value of , with the QD approximately nm inwards from the position of peak field strength (the small value of reduces by ).
To illustrate the sensitivity of the model to the inferred parameters, in Figure 11(b)-(d) we present results in which the values for , , and are varied. In Fig. 11(b), we plot the model results for a wide range of values of . For these values, the predicted reflected spectrum qualitatively changes. In Fig. 11(c), we show the calculated reflected spectrum for the same set of parameters as in Table 1, but under the assumption that the only QD dephasing is due to spontaneous emission with a radiative lifetime =1 ns, so that . We see that the generated fit differs significantly from the data in terms of the peak height, contrast, and width. Figure 11(d) re-instates the phase-destroying collisional rate , but still assumes all energy decay is due to radiative decay, so that . Now, the model fit is much closer to the data, particularly in terms of peak contrast and width, but the absolute amplitude is too large. Matching the absolute amplitude requires to be increased, with =0.55 GHz producing the model fit in Fig. 11(a) which best matches the data. We have suggested that this increased is purely due to non-radiative energy decay. However, it is also possible that could be shorter than ns, which would then require the overlap between the cavity and QD () to be smaller than we have estimated. Future studies to better address the breakdown of radiative and non-radiative components of could include lifetime measurements of the QD when it is non-resonant with the cavity and high spatial resolution measurements of the QD position.
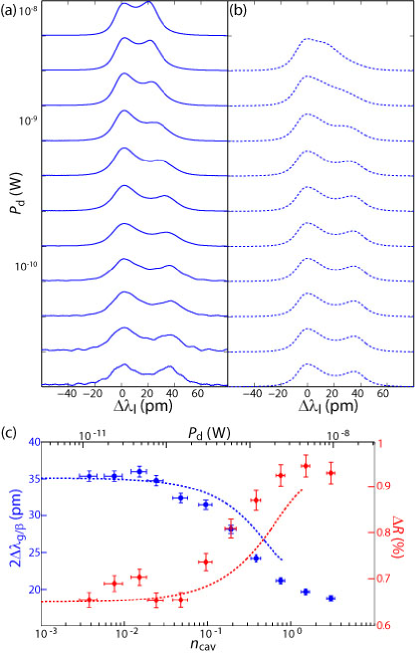
Using the model parameters listed in Table 2, we next examine the nonlinear behavior of the cavity reflection spectrum as a function of drive strength in Fig. 12. Just as was done in Fig. 9(c-d), in Fig. 12(a) we plot reflection spectra for a series of drive strengths (dropped power into the cavity ), but here the spectra are normalized to input power rather than to unity, thus allowing for a comparison of the recovery of the reflected signal amplitude. In Fig. 12(b), we plot the reflection spectra generated by the model for the same values of , where computer memory limitations have prevented us from being able to accurately model the cavity mode at the highest value of (due to the limited photon Fock space size of intra-cavity photons). The model reproduces the features of the data relatively well in terms of the peak reflection level (), which steadily increases with larger values of , and the doublet splitting, which decreases from a value dominated by exciton-mode coupling (2) to one dominated by surface-roughness-induced backscattering (2). This behavior is quantified by plotting the splitting and as a function of and in Fig. 12(c). As was the case when considering the transmission contrast in Fig. 9(e), we see the system begin to saturate for . The behavior of the experimental data is qualitatively reproduced by the model, although there are some discrepancies, such as the model prediction of saturation occurring at somewhat higher power levels. As discussed later in the paper, some portion of this discrepancy may be due to the presence of an additional saturation mechanism within these semiconductor-based devices.
Finally, a comment is warranted here with regard to the possible effects of the limited time resolution of the measurements we have conducted thus far and the accurate determination of and . The transmission and reflection spectra data used in fitting to the QME model described above consist of averages of 10 to 20 single wavelength scans. In addition, the photodetector signal representing transmission or reflection is amplified with a low-pass pre-filter of bandwidth 30 Hz to 300 Hz (depending upon the photodetector used) to remove electronic noise from the detector pre-amplifier. In order to faithfully represent the optical response of the cavity-QD system, each wavelength scan over a pm wavelength range is taken with a scanning repetition rate of 0.3 Hz to 1 Hz (a piezo-stack is used to scan the grating feedback wavelength of the external cavity laser diode) and a sampling resolution of pm, corresponding to an analog-to-digital sampling time of ms to ms for the data acquisition card used to record the spectrum. The time resolution for our measurements is then seen to be limited by the amplifier pre-filter bandwidth to a value on the order of 10 ms. As a result, it is conceivable that the measured peak height, width, and contrast of the strongly coupled resonances of the QD-cavity system are not entirely due to fast dephasing mechanisms as we have assumed above in our QME model through the introduction of and , but could instead be due to slower processes such as the charging and discharging of the QD (and its nearby environment) on the timescale of hundreds of ns to ms Santori et al. (2004). The resulting spectral diffusion of the QD exciton lines due to charge fluctuations would cause the time averaged signal of a sharper, higher contrast set of resonance peaks of the coupled system to smear out due to small shifts in the exciton line or to be averaged with the bare-cavity response due to larger shifts in the exciton line. In the next section we show both single scan and averaged data for a QD exciton line on resonance with the cavity mode (see Fig. 14), where the single scan data shows evidence of fluctuations in the resonant transmission dips that are significantly absent for that of the bare-cavity mode. This data suggests that our quantum master equation model does not fully capture the behavior of our system, and processes such as spectral diffusion of the exciton lines of the QD may be of importance.
V Linear and nonlinear spectroscopy of a coupled microdisk-QD system in the bad cavity limit
In this section, we present measurements of a coupled microdisk-QD system in the bad cavity limit, where exceeds and . As we shall see, is still large enough for the system to exhibit many of the same properties we saw in the strongly coupled system, such as anti-crossing and saturation for . Along with serving as an additional test of the experimental setup developed, the main motivation behind presenting this data lies in section V.2.2, where the system is studied in a pump-probe configuration, with an eye towards potential future experiments involving control of the QD through the ac-Stark effect and spectroscopy of higher states of the Jaynes-Cummings system. In the measurements presented here, a laser beam is coupled into a far red-detuned mode of the cavity while the system is simultaneously probed near-resonance as it was in section IV. We observe a saturation of the transmission/reflection spectrum with increasing pump power, reminiscent of the saturation observed in section IV.2 when increasing the probe power, but occurring at intracavity photon numbers that are nearly one order of magnitude larger.
V.1 Vacuum Rabi splitting measurements
Figure 13(a) shows a transmission spectrum for the device under consideration, where the cavity mode is blue-detuned of the QD transition by 100 pm, and the system is probed in the weak driving limit () at 8 K. In comparison to the cavity mode studied in the previous section, we see that this cavity mode has significantly more loss (), so that the decay rate 5.4 GHz. In this device, dominates and as a result, the mode appears as a singlet. Interpretation of the data is then particularly simple in that the system behaves very similarly to that of a standard single mode cavity QED system, with the importance of the additional complexity of / modal coupling due to surface roughness being limited. Nevertheless, the full QME picture including and in particular, the presence of a second cavity mode, is the most accurate way to study the system, and a necessity for understanding the presence of a reflected signal, for example.
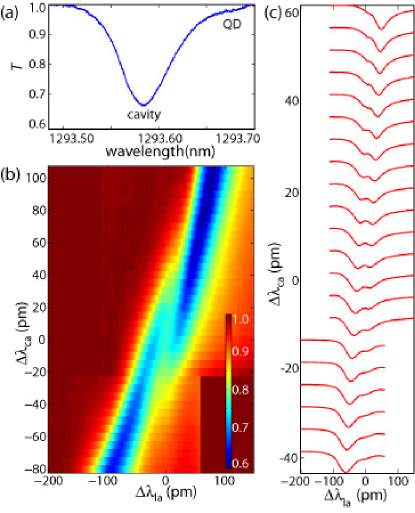
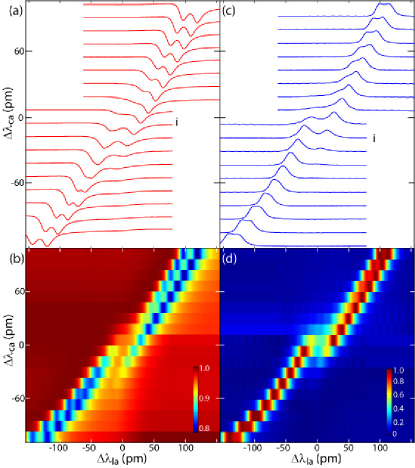
Figure 13(b) and 13(c) show the transmitted spectrum in the weak driving limit as it is N2-tuned towards the QD. The procedure for tuning the cavity is the same as it was in the previous section, but the N2 flow rate was reduced so that the step size was 5 pm. The data show a clear anti-crossing behavior, with a peak splitting of 37 pm, corresponding to an approximate coupling strength GHz. The reduced sample temperature (8 K) at which the data were taken in comparison to the measurements in the previous section (15 K) suggest that the may also be reduced. Indeed, QME simulations suggest that the peak width, depth, and contrast of the transmission spectrum on resonance are best fit by GHz, with lower by a factor of 3 relative to its value in Section IV ( remains unchanged). With the previously mentioned 5.4 GHz, the system is in the bad-cavity regime, with . Since , anti-crossing and saturation effects seen previously will largely be reproduced here.
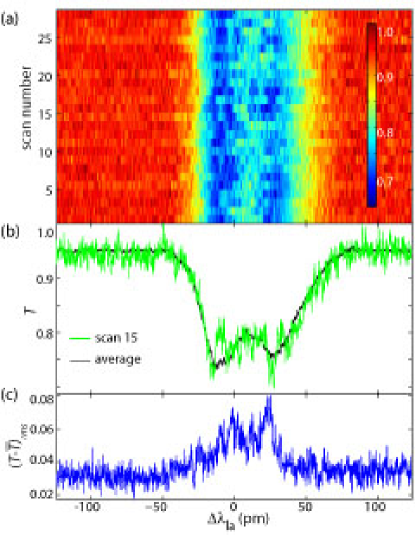
Before moving on, let us briefly consider an experimental detail that we have not yet addressed, which is the averaging of the spectra for each value of . This averaging (typically consisting of 10 to 20 scans) is performed due to the noisy signal produced in a single scan of the coupled cavity-QD resonant system (noticeably more noisy than for a detuned cavity scan). An example of this is shown in Fig. 14, which examines the cavity mode on-resonance with the neutral exciton line of the QD. We first show an image plot displaying numerous single scans taken in succession and under the same resonant optical driving and detection conditions (analog low-pass filter of 300 Hz and analog-to-digital sampling time of 1 ms). This image gives some indication of the size of the fluctuations present in the single scan data. Underneath the image plot, we overlay a representative single scan with the average of all of the single scans. We see that there are pronounced fluctuations in the single scan transmission data (by as much as 25 of the average value) within the resonance dips. The source of these fluctuations is not just electronic noise of our detector, but is related to the interaction of the cavity with the QD. In particular, the ensemble averaged root-mean-square (rms) deviation from the mean transmission signal as a function of probe wavelength, shown in Fig. 14(c), clearly increases in the region of the coupled cavity-QD resonances. Measurements taken when the cavity is far detuned from the QD do not show such a variation for the bare-cavity transmission resonance. This suggests that the QD is somehow the source of these increased fluctuations, perhaps as a result of processes such as spectral diffusion and blinking, which we are unable to resolve any further in our current experiments due to the limited time resolution of our data, and that clearly require further experimentation and analysis.
V.2 Nonlinear spectroscopy
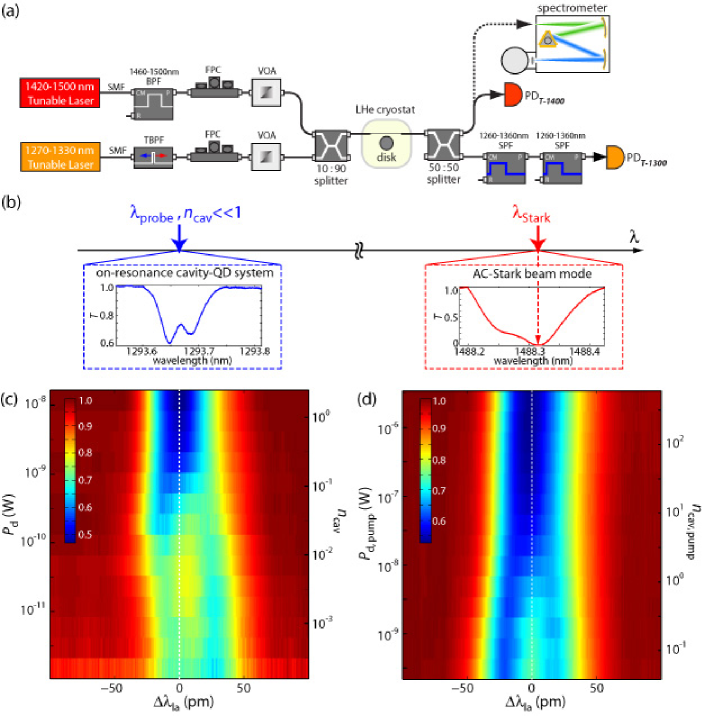
In this section, we consider nonlinear spectroscopy of the system presented above. In these measurements, the taper coupling position with respect to the cavity has been slightly improved, so that the bare-cavity with GHz. We tune the cavity to a position close to resonance (), and examine how the spectra change with , both due to increasing the near-resonant probe beam power and through the addition of a far off-resonance control beam. A schematic of the experimental setup used for these measurements is shown in Fig. 15(a). The control beam, consisting of laser light from a nm to nm band external cavity tunable diode laser, is coupled into the fiber taper through a directional coupler that combines it with the nm probe beam. A nm to nm bandpass filter (BPF) is used to provide 60 dB of rejection of the spontaneous emission from the control laser beam in the nm wavelength band prior to input to the fiber taper. Additionally, in these measurements a narrowband tunable bandpass filter (TBPF), with a 20 dB full-width at half-maximum bandwidth of nm, is used to filter spontaneous emission from the probe laser beam. At the fiber taper output, a pair of BPFs providing 120 dB rejection of the control laser beam are used to remove any residual pump beam prior to measurement of the low-power nm probe beam transmission.
V.2.1 Saturation of the Jaynes-Cummings system
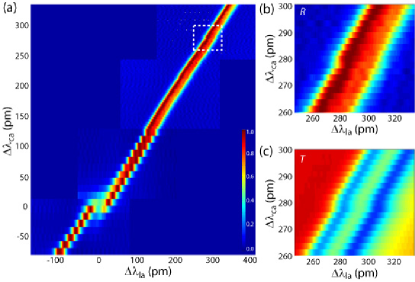
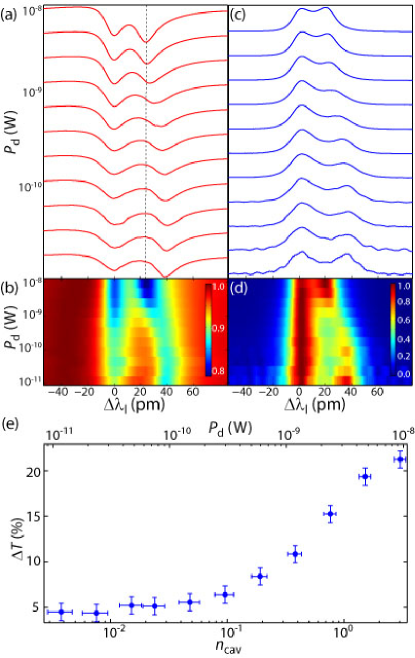
Before considering the effects of the red-detuned pump beam on the system, we first examine system saturation under increased driving by the on-resonance probe beam. Figure 15(c) plots the transmitted spectrum for the system as a function of and , where each spectrum has been averaged 10 to 20 times. In contrast with the similar plots in section IV.2, here we have plotted the spectrum as a function of . The section IV.2 data were plotted against , which was defined relative to the short wavelength resonance peak/dip in the reflection/transmission spectrum, a necessity due to a slow fluctuation in the laser wavelength position during the measurements. In these measurements, the laser position was stable enough to avoid the need to do this. The observed saturation behavior is again very similar to that seen in the previous section, with the onset occurring for .
Along with the clear saturation that transforms the doublet structure under weak driving into a singlet under strong driving, we see an unexpected feature at the lowest drive powers, where . At these levels, the spectrum does not saturate, but does appear to blue shift. Interestingly, the blue shift does not continue at higher powers. The origin of the shift is not currently clear, though some immediate possibilities, such as drift of the center laser frequency, heating, free carrier generation, and removal of the N2 film do not seem to match the observed behavior.
V.2.2 Pump-probe spectroscopy, nonlinear emission, and system saturation
We now consider a pump-probe measurement on this coupled microdisk-QD system. Pump-probe spectroscopy might be used in a number of different experiments in the study of this system. Our initial interest has been in using an off-resonant beam to ac-Stark shift the QD while it is coupled to a cavity mode, providing a level of control of the system. For example, one could envision using the ac-Stark shift to tune the QD with respect to the cavity mode, possibly allowing for nondestructive state readout measurements of the type recently demonstrated in circuit QED Schuster et al. (2005). Another possible application of a pump-probe measurement would be to take advantage of the ultra-low power nonlinearity observed in this system for switching applications, where a pump laser is used to change the reflection/transmission spectrum of the cavity and its effect on a probe beam is examined. Finally, pump-probe spectroscopy might be a means to investigate aspects of the structure of the Jaynes-Cummings system at a level beyond measurements of vacuum Rabi splitting and anti-crossing Thompson et al. (1998).
By performing cavity mode spectroscopy in the 1400 nm band, we find the spectral position of a microdisk WGM at 1488.32 nm, ensuring that the coupling of this pump beam into the cavity is efficient. The right inset of Fig. 15(b) shows a wavelength scan of the mode we couple to, which is likely the TE1,11 mode (with the 1300 nm WGM being the TE1,14 mode). From this transmission spectrum, we can accurately determine the dropped pump power and intracavity pump photon number .
We next fix the 1300 nm probe beam at pW, corresponding to , so that with the 1488 nm pump beam off, we trace out a Rabi-split transmission spectrum as seen in the left inset of Fig. 15(b). We then turn on the pump laser (at a fixed wavelength 1488.32 nm) and vary its power while sweeping the probe beam in frequency and recording the 1300 nm transmission spectrum. Figure 15(d) shows an image plot of individual spectra from this measurement. We observe a saturation of the transmission spectrum that, on the surface, looks very similar to that seen in Fig. 15(c), minus the wavelength blue-shift evident in the probe beam saturation at very low powers. Although the saturation behavior is quite similar, it occurs at significantly larger pump beam values than required when the probe beam was used to saturate the system. Evidence of an ac-Stark shift of the QD, which would not saturate the spectrum but rather modify it in manner analogous to that in the anti-crossing spectrum of Fig. 13 (where now the QD is tuned instead of the cavity), is not seen.
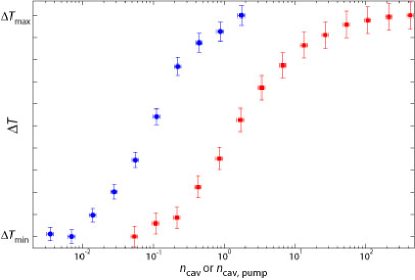
To better compare the two different saturation mechanisms, in Fig. 16 we examine the transmission contrast on resonance () as a function of intracavity photon number generated by either the on-resonance probe beam or the off-resonance ac-Stark shift control beam. In this data, we have scaled the transmission contrast from each of the data sets to lie on a common axis of ordinates (y-axis). The data show some differences in the shape of the saturation curves, and most noticeably, that saturation due to the pump beam occurs for , nearly one order of magnitude larger than the saturation value we see when there is no pump beam and just the probe beam power is varied.
Naturally, the cause of the saturation effected by the off-resonant pump beam is an important question. Recent work involving similar self-assembled InAs QDs has shown that it is possible to use relatively intense laser beams to create dressed states of the bare excitonic levels Xu et al. (2007); Kroner et al. (2008); Jundt et al. (2008); Xu et al. (2008); Gerardot et al. (2008). In Ref. [Jundt et al., 2008] laser instensities as large as kW/cm2 were used, with no discernable dephasing introduced by the control laser. For comparison, we see dephasing effects due to the nm control beam at , which corresponds to roughly kW/cm2 of circulating intensity within the microdisk. Notable differences between the system studied here and the QDs studied in the above mentioned references are the lack of a field-effect structure Drexler et al. (1994) in our device, the close proximity of dry-etched semiconductor surfaces to the QD in the microdisk, and the DWELL electronic structure in which the excitonic states of the QD lie. Embedding the QD within a field-effect structure may provide a level of stability for the charged environment of the QD, whereas the presence of nearby surfaces Michael et al. (2007) and the DWELL structure Moreno et al. (2008) may provide for new pathways of efficient photoexcitation of free-carriers by the nm control laser. As such, the QD states in our devices may be more susceptible to spectral diffusion and blinking Santori et al. (2004) due to charge fluctuations in and around the QD stemming from photoexcited free-carriers.
As a first attempt at studying the QD exciton dephasing caused by the far red-detuned ac-Stark control beam, we turn off the probe beam and spectrally resolve any emitted light that is generated by the nm control laser beam. Figure 17(a) shows the total integrated emission within a narrow wavelength range (1293 nm to 1296 nm, covering the cavity mode and QD states and ) as a function of . For pump beam powers as low as nW, significant PL is measured (the smallest pump power levels studied in Fig. 15(d) do not produce detectable emission). The dependence of emission on pump power is clearly nonlinear, with a least-squares-fit estimate of for the power law exponent. This would tend to indicate a nonlinear absorption process is at play here, although multi-photon absorption in bulk GaAs at a wavelength of m is estimated to be negligible Hurlbut et al. (2007). We have also checked, by monitoring the cavity mode quality factor as a function of pump power, that any nonlinear absorption is significantly less than the low-power optical loss of the cavity mode (exponential absorption coefficient cm-1) at all control laser power levels studied here.
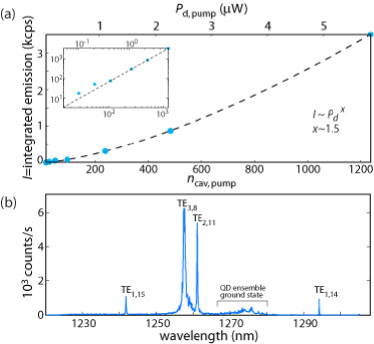
Figure 17(b) plots the photoluminescence spectrum over a broad wavelength range, for a relatively large pump power of W. We see a significant amount of emission into other microdisk cavity modes and into the ensemble of QDs. Evidently the photogenerated carriers are free to populate a large portion of the ensemble of QDs within the microdisk. A possible explanation for the nonlinear PL intensity dependence, instead of nonlinear absorption, may be a carrier density dependence of the relaxation and emission process. The emission process is not well understood for the cavity modes detuned from excitonic lines of the QDs Hennessy et al. (2007), and as shown in Fig. 17(b), cavity mode emission constitutes a large portion of the PL intensity. Moreover, linear absorption from deep level defects in the semiconductor bulk or surface states at the etched edge of the microdisk has been measured to represent a significant fraction of the optical loss in similar GaAs microdisks Michael et al. (2007). Further two-wavelength experiments involving tuning of the pump wavelength and pulsed measurements are being explored to better understand the physical processes involved.
As a final comment, we compare the saturation mechanism of the resonant cavity-QD system in the two-wavelength pump-probe experiment with that of the single-wavelength probe measurements. In particular, we consider the effect this additional saturation mechanism would have on measurements of the resonant response of the system under increasing probe beam power as depicted in Fig. 9 and 15. In the interpretation of these measurements, the saturation was attributed to the coherent interaction of the probe laser with the two-level exciton system, and the limited rate at which a single exciton can spontaneously scatter photons. We now see that, in addition to this effect, there is the second possibility of absorption of the probe beam and the effect of generated free carriers on the QD. However, Figs. 15 and 16 show that this effect is comparatively small until , at which point the coherent saturation of the system has already taken strong effect.
VI Summary
In summary, we have presented experimental results on the coherent optical spectroscopy of fiber-coupled semiconductor microdisk-QD systems. This coherent spectroscopy is achieved by using a fiber taper waveguide to efficiently access the semiconductor microcavity, allowing us to resonantly probe the system and measure its transmission and reflection spectra, and compare our experimental data with the results of a quantum master equation model. Along with measurements of vacuum Rabi splitting and system saturation for less than one intracavity photon, we consider a pump-probe experiment where the system response is monitored as a far red-detuned pump beam is coupled into the cavity and its power is varied. We find that the system saturates here as well, at an intracavity pump photon number that is roughly one order of magnitude larger than the saturation observed when only the resonant probe beam power is varied. Initial measurements indicate that sub-bandgap absorption of the pump beam and subsequent free-carrier generation are the root cause of the saturation of the resonantly coupled cavity-QD response. This suggests that charge fluctuations within and nearby the QD due to sub-bandgap absorption, even at low excitation powers, may be an important factor to consider in future pump-probe and nonlinear spectroscopy experiments of the DWELL-microcavity system. Further studies involving variation of the control laser wavelength, incorporation of bias gates for charge-control of the QD, and treatments of the etched microcavity device surface are planned to better understand and tame this parasitic effect.
VII Acknowledgements
We thank A. Stintz and S. Krishna of the Center for High Technology Materials at the University of New Mexico for providing the quantum dot material growth. This work was partly supported by the DARPA NACHOS program.
References
- Kimble (1998) H. J. Kimble, Physica Scripta T76, 127 (1998).
- Hood et al. (2000) C. J. Hood, T. W. Lynn, A. C. Doherty, A. S. Parkins, and H. J. Kimble, Science 287, 1447 (2000).
- Pinske et al. (2000) P. W. H. Pinske, T. Fischer, P. Maunz, and G. Rempe, Nature 404, 365 (2000).
- Raimond et al. (2001) J. Raimond, M. Brune, and S. Haroche, Rev. Mod. Phys. 73, 565 (2001).
- Walther et al. (2006) H. Walther, B. Varcoe, B.-G. Englert, and T. Becker, Rep. Prog. Phys. 69, 1325 (2006).
- Walraff et al. (2004) A. Walraff, D. Schuster, A. Blais, L. Frunzio, R.-S. Huang, J. Majer, S. Kumar, S. Girvin, and R. Schoelkopf, Nature (London) 431, 162 (2004).
- Aoki et al. (2006) T. Aoki, B. Dayan, E. Wilcut, W. P. Bowen, A. S. Parkins, H. J. Kimble, T. J. Kippenberg, and K. J. Vahala, Nature 443, 671 (2006).
- Reithmaier et al. (2004) J. P. Reithmaier, G. Sek, A. Loffer, C. Hoffman, S. Kuhn, S. Reitzenstein, L. V. Keldysh, V. D. Kulakovskii, T. L. Reinecke, and A. Forchel, Nature (London) 432, 197 (2004).
- Yoshie et al. (2004) T. Yoshie, A. Scherer, J. Hendrickson, G. Khitrova, H. Gibbs, G. Rupper, C. Ell, Q. Schenkin, and D. Deppe, Nature (London) 432, 200 (2004).
- Peter et al. (2005) E. Peter, P. Senellart, D. Martrou, A. Lematre, J. Hours, J. M. Gérard, and J. Bloch, Phys. Rev. Lett. 95, 067401 (2005).
- Jaynes and Cummings (1963) E. T. Jaynes and F. W. Cummings, Proceedings of the IEEE 51, 89 (1963).
- Imamoglu et al. (1999) A. Imamoglu, D. Awshcalom, G. Burkard, D. DiVincenzo, D. Loss, M. Sherwin, and A. Small, Phys. Rev. Lett. 83, 4204 (1999).
- Blais et al. (2007) A. Blais, J. Gambetta, A. Walraff, D. Schuster, S. Girvin, M. Devoret, and R. Schoelkopf, Phys. Rev. A 75, 032329 (2007).
- Sillanpaa et al. (2007) M. Sillanpaa, J. Park, and R. Simmonds, Nature (London) 449, 438 (2007).
- Majer et al. (2007) J. Majer, J. Chow, J. Gambetta, J. Koch, B. Johnson, J. Schreir, L. Frunzio, D. Schuster, A. Houck, A. Walraff, et al., Nature (London) 449, 443 (2007).
- Srinivasan and Painter (2007a) K. Srinivasan and O. Painter, Nature (London) 450, 862 (2007a).
- Hennessy et al. (2007) K. Hennessy, A. Badolato, M. Winger, D. Gerace, M. Atature, S. Guide, S. Falt, E. Hu, and A. Imamoglu, Nature (London) 445, 896 (2007).
- Press et al. (2007) D. Press, S. Gotzinger, S. Reitzenstein, C. Hoffmann, A. Loffler, M. Kamp, A. Forchel, and Y. Yamamoto, Phys. Rev. Lett. 98, 117402 (2007).
- Englund et al. (2007) D. Englund, A. Faraon, I. Fushman, N. Stoltz, P. Petroff, and J. Vučković, Nature (London) 450, 857 (2007).
- Hood et al. (1998) C. J. Hood, M. S. Chapman, T. W. Lynn, and H. J. Kimble, Phys. Rev. Lett. 80, 4157 (1998).
- Boca et al. (2004) A. Boca, R. Miller, K. M. Birnbaum, A. D. Boozer, J. McKeever, and H. J. Kimble, Phys. Rev. Lett. 93, 233603 (2004).
- Kiraz et al. (2004) A. Kiraz, M. Atature, and A. Imamoglu, Phys. Rev. A 69, 032305 (2004).
- Srinivasan and Painter (2007b) K. Srinivasan and O. Painter, Phys. Rev. A 75, 023814 (2007b).
- Santori et al. (2004) C. Santori, D. Fattal, J. Vuckovic, , G. S. Solomon, E. Waks, and Y. Yamamoto, Phys. Rev. B 69, 205324 (2004).
- Thompson et al. (1998) R. J. Thompson, Q. A. Turchette, O. Carnal, and H. J. Kimble, Phys. Rev. A 57, 3084 (1998).
- Walraff et al. (2007) A. Walraff, D. Schuster, A. Blais, J. Gambetta, J. Schreier, L. Frunzio, M. Devoret, S. Girvin, and R. Schoelkopf, Nature (London) 99, 050501 (2007).
- Schuster et al. (2005) D. Schuster, A. Walraff, A. Blais, L. Frunzio, R.-S. Huang, J. Majer, S. Girvin, and R. Schoelkopf, Phys. Rev. Lett. 94, 123602 (2005).
- Muller et al. (2007) A. Muller, E. Flagg, P. Bianucci, X. Wang, D. Deppe, W. Ma, J. Zhang, G. Salamo, M. Xiao, and C. Shih, Phys. Rev. Lett. 99, 187402 (2007).
- Melet et al. (2007) R. Melet, V. Voliotis, A. Enderlin, D. Roditchev, X. Wang, T. Guillet, and R. Grousson, arXiv:0707.3061 (2007).
- Knight et al. (1997) J. C. Knight, G. Cheung, F. Jacques, and T. A. Birks, Opt. Lett. 22, 1129 (1997).
- Borselli (2006) M. Borselli, Ph.D. thesis, California Institute of Technology (2006).
- Barclay et al. (2005) P. E. Barclay, K. Srinivasan, and O. Painter, Opt. Express 13, 801 (2005).
- Manolatou et al. (1999) C. Manolatou, M. J. Khan, S. Fan, P. R. Villeneuve, H. A. Haus, and J. D. Joannopoulos, IEEE J. Quan. Elec. 35, 1322 (1999).
- Spillane et al. (2003) S. M. Spillane, T. J. Kippenberg, O. J. Painter, and K. J. Vahala, Phys. Rev. Lett. 91, 043902 (2003).
- Srinivasan et al. (2005) K. Srinivasan, M. Borselli, T. J. Johnson, P. E. Barclay, O. Painter, A. Stintz, and S. Krishna, Appl. Phys. Lett. 86, 151106 (2005).
- Srinivasan et al. (2004) K. Srinivasan, P. E. Barclay, M. Borselli, and O. Painter, Phys. Rev. B 70, 081306R (2004).
- Painter et al. (2008) O. Painter, K. Srinivasan, M. Winger, A. Badolato, D. Gerace, and A. Imamoglu (2008), manuscript in preparation.
- Akahane et al. (2003) Y. Akahane, T. Asano, B.-S. Song, and S. Noda, Nature 425, 944 (2003).
- Barclay et al. (2006) P. E. Barclay, K. Srinivasan, O. Painter, B. Lev, and H. Mabuchi, Appl. Phys. Lett. 89, 131108 (2006).
- Srinivasan and Painter (2007c) K. Srinivasan and O. Painter, Appl. Phys. Lett. 90, 031114 (2007c).
- Stintz et al. (2000) A. Stintz, G. T. Liu, H. Li, L. F. Lester, and K. J. Malloy, IEEE Photonics Tech. Lett. 12, 591 (2000).
- Liu et al. (2000) G. T. Liu, A. Stintz, H. Li, T. C. Newell, A. L. Gray, P. M. Varangis, K. J. Malloy, and L. F. Lester, IEEE J. Quan. Elec. 36, 1272 (2000).
- Cade et al. (2005) N. I. Cade, H. Gotoh, H. Kamada, T. Tawara, T. Sogawa, H. Nakano, and H. Okamoto, Appl. Phys. Lett. 87, 172101 (2005).
- Cade et al. (2006) N. I. Cade, H. Gotoh, H. Kamada, H. Nakano, and H. Okamoto, Phys. Rev. B 73, 115322 (2006).
- Badolato et al. (2005) A. Badolato, K. Hennessy, M. Atature, J. Dreiser, E. Hu, P. M. Petroff, and A. Imamoglu, Science 308, 1158 (2005).
- Srinivasan et al. (2007) K. Srinivasan, O. Painter, A. Stintz, and S. Krishna, Appl. Phys. Lett. 91, 091102 (2007).
- Srinivasan et al. (2006) K. Srinivasan, M. Borselli, O. Painter, A. Stintz, and S. Krishna, Opt. Express 14, 1094 (2006).
- Bayer and Forchel (2002) M. Bayer and A. Forchel, Phys. Rev. B 65, 041308(R) (2002).
- Mosor et al. (2005) S. Mosor, J. Hendrickson, B. C. Richards, J. Sweet, G. Khitrova, H. Gibbs, T. Yoshie, A. Scherer, O. B. Shchekin, and D. G. Deppe, Appl. Phys. Lett. 87, 141105 (2005).
- Hennessy et al. (2005) K. Hennessy, A. Badolato, A. Tamboli, P. M. Petroff, E. Hu, M. Atature, J. Dreiser, and A. Imamoglu, Appl. Phys. Lett. 87, 021108 (2005).
- Michael et al. (2007) C. Michael, K. Srinivasan, T. Johnson, O. Painter, K. Lee, K. Hennessy, H. Kim, and E. Hu, Appl. Phys. Lett. 90, 051108 (2007).
- Weiss et al. (1995) D. S. Weiss, V. Sandoghdar, J. Hare, V. Lefèvre-Seguin, J.-M. Raimond, and S. Haroche, Opt. Lett. 20, 1835 (1995).
- Kippenberg et al. (2002) T. J. Kippenberg, S. M. Spillane, and K. J. Vahala, Opt. Lett. 27, 1669 (2002).
- Borselli et al. (2005) M. Borselli, T. J. Johnson, and O. Painter, Opt. Express 13, 1515 (2005).
- Strauf et al. (2006) S. Strauf, K. Hennessy, M. T. Rakher, Y.-S. Choi, A. Badolato, L. C. Andreani, E. L. Hu, P. M. Petroff, and D. Bouwmeester, Phys. Rev. Lett. 96, 127404 (2006).
- Carmichael (1993) H. J. Carmichael, An Open Systems Approach to Quantum Optics (Springer-Verlag, Berlin, 1993).
- Xu et al. (2007) X. Xu, B. Sun, P. Berman, D. Steel, A. Bracker, D. Gammon, and L. Sham, Science 317, 929 (2007).
- Kroner et al. (2008) M. Kroner, C. Lux, S. Seidl, A. W. Holleitner, K. Karrai, A. Badolato, P. M. Petroff, and R. J. Warburton, Appl. Phys. Lett. 92, 031108 (2008).
- Jundt et al. (2008) G. Jundt, L. Robledo, A. Hogele, S. Falt, and A. Imamoglu, Phys. Rev. Lett. 100, 177401 (2008).
- Xu et al. (2008) X. Xu, B. Sun, E. D. Kim, K. Smirl, P. Berman, D. G. Steel, A. S. Bracker, D. Gammon, and L. J. Sham, http://arxiv.org/PS_cache/arxiv/pdf/0803/0803.0734v1.pdf (2008).
- Gerardot et al. (2008) B. D. Gerardot, D. Brunner, P. A. Dalgamo, K. Karrai, A. Badolato, P. M. Petroff, and R. J. Warburton, http://arxiv.org/ftp/arxiv/papers/0803/0803.0432.pdf (2008).
- Drexler et al. (1994) H. Drexler, D. Leonard, W. Hansen, J. P. Kotthaus, and P. M. Petroff, Phys. Rev. Lett. 73, 2252 (1994).
- Moreno et al. (2008) P. Moreno, M. Richard, M. Rossetti, M. Portella-Oberli, L. H. Li, B. Deveaud-Pledran, and A. Fiore, Nano Letters 8, 881 (2008).
- Hurlbut et al. (2007) W. Hurlbut, Y.-S. Lee, K. Vodopyanov, P. Kuo, and M. Fejer, Opt. Lett. 32, 668 (2007).