Chandra Observations of the Northeastern Rim of the Cygnus Loop
Abstract
We present results from spatially resolved spectral analyses of the northeastern (NE) rim of the Cygnus Loop supernova remnant (SNR) based on two Chandra observations. One pointing includes northern outermost abundance-enhanced regions discovered by recent Suzaku observations, while the other pointing is located on regions with “normal” abundances in the NE rim of the Cygnus Loop. The superior spatial resolving power of Chandra allows us to reveal that the abundance-enhanced region is concentrated in a 200′′-thickness region behind the shock front. We confirm absolute metal abundances (i.e., relative to H) as well as abundance ratios between metals are consistent with those of the solar values within a factor of 2. Also, we find that the emission measure in the region gradually decreases toward the shock front. These features are in contrast with those of the ejecta fragments around the Vela SNR, which leads us to believe that the abundance enhancements are not likely due to metal-rich ejecta. We suggest that the origin of the plasma in this region is the interstellar medium (ISM). In the “normal” abundance regions, we confirm that abundances are depleted to the solar values by a factor of 5 that is not expected in the ISM around the Cygnus Loop. Introduction of non-thermal emission in our model fitting can not naturally resolve the abundance-depletion problem. The origin of the depletion still remains as an open question.
1 Introduction
The Cygnus Loop is one of the nearest (540 pc: Blair et al. 2005) supernova remnants (SNRs). The angular dimensions are (Leahy et al. 1997) and the age is considered to be 10000 yrs. The low column density of the foreground material makes it an ideal target to study UV and soft X-ray emission from the remnant. The X-ray boundary in the northeastern (NE) rim of the Cygnus Loop is associated with Balmer-dominated filaments which mark current locations of the blast wave (Chevalier 1978). Balmer-dominated filaments in this region have been well studied by optical as well as UV observations (e.g., Raymond et al. 1983; Sankrit et al. 2000; Ghavamian et al. 2001). Hester et al. (1994) studied a Balmer-dominated filament in detail and reported that it was recently (in past 1000 yrs) decelerated from 400 km sec-1 to 180 km sec-1. The rapid deceleration of the shock velocity was considered to be a result of the blast wave hitting the wall of a cavity which surrounded the supernova precursor. The cavity wall/blast wave interaction was also suggested by X-ray observations. For example, Levenson et al. (1999) revealed that a soft spatially thin () shell surrounded almost the entire rim of the Loop based on a ROSAT PSPC hardness map. They concluded that the soft shell occurred where the cavity wall decelerated the blast wave.
ASCA observations of the NE rim of the Cygnus Loop revealed low abundances relative to the solar values by a factor of 5 (Miyata & Tsunemi 1999). A follow-up Suzaku observation of the region confirmed the depleted abundances there (Miyata et al. 2007). Chandra observation of the southwestern rim of the Cygnus Loop revealed that oxygen abundance there is also depleted by the same factor as that observed in the NE rim (Leahy 2004). The low abundances were considered to be a common feature in the rim of the Cygnus Loop. However, recent Suzaku observations of the northern outermost region in NE rim of the Cygnus Loop revealed enhanced abundances: a white dashed polygon in Fig. 1 showed high metal abundances relative to those in the other region: C0.7, N0.7, O0.4, Ne0.6, Mg0.3, and Fe0.3 times the solar values (Katsuda et al. 2008). Neither a circumstellar medium, fragments of ejecta, nor abundance inhomogeneities of the local interstellar medium around the Cygnus Loop can explain the relatively enhanced abundance in the region. The origin of the abundance inhomogeneity in the NE rim remained as an open question.
Here, we present results from Chandra observations of the NE rim of the Cygnus Loop. Utilizing the high spatial resolving power of Chandra, we reveal detailed spatial distributions of metal abundances, emission measure, and thermodynamic parameters from our spatially resolved spectral analysis. In this paper, we attempt to reveal the origin of the abundance enhancements in the northern outermost region of the NE rim as well as to understand the cause of the abundance depletion in the rest of the NE rim.
2 Observations
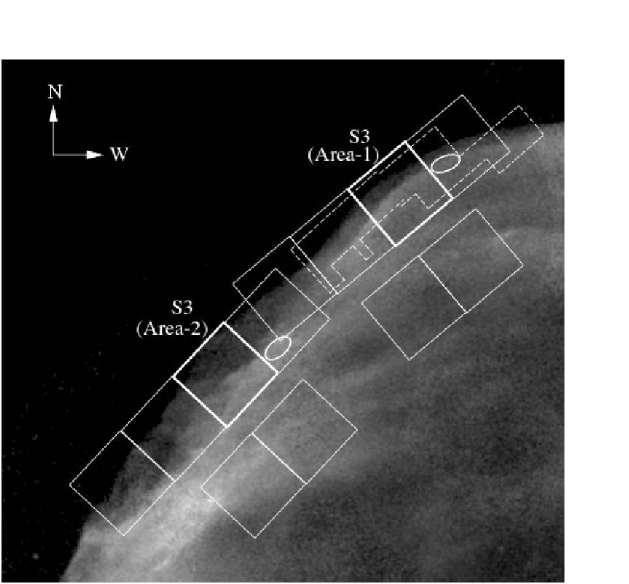
Chandra Advanced CCD Imaging Spectrometer (ACIS) observed the NE rim of the Cygnus Loop in two pointings (PI: Gaetz, T.). The nominal position of one pointing (ObsID. 2821), which covers the northern portion of the NE rim, is [(RA,DEC)=(20h54m38s.8, 32∘16′27′′.9) J2000], while that of the other pointing (ObsID. 2822), which covers the southern portion of the NE rim, is [(RA,DEC)=(20h56m10s.6, 31∘55′19′′.3) J2000]. The observation dates are 2001 December 24 and 16 for ObsID. 2821 and 2822, respectively. The total fields of view (FOV) of twelve CCDs for the two pointings are shown as white boxes in Fig. 1. We start our analysis from level 2 event files processed with calibration data files in CALDB ver. 3.3.0. We exclude the high-background periods for data from ObsID. 2821. On the other hand, there seems no significant background flares for the data from ObsID. 2822 so that we reject no data from the level 2 event file for our analysis. The resulting net exposure times for ObsID. 2821 and 2822 are 35 ks and 59 ks, respectively.
3 Spatially Resolved Spectral Analysis
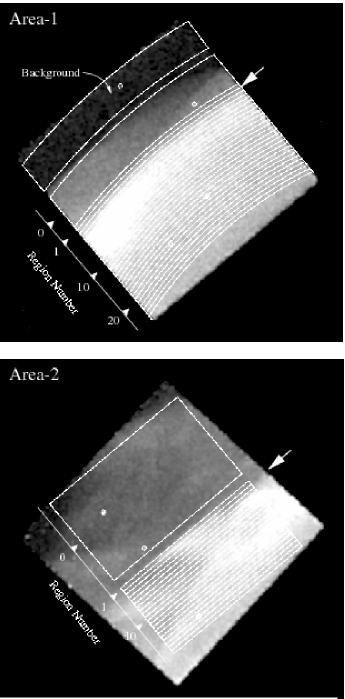
In order to investigate the post-shock plasma structures in detail, we perform spatially resolved spectral analysis for the cleaned Chandra data. To this end, we concentrate on the data taken by the S3 (Back-illuminated: BI) chip, since its energy resolving power is better than that of another BI (S1) chip, and the numbers of photons detected in BI chips are richer than those in Front-illuminated (FI) chips for the spectra from the Cygnus Loop. Figure 2 shows ACIS S3 chip images. We hereafter name the area covered by the S3 chip in ObsID. 2821 as “area-1” (see, Fig. 2 upper), while that covered by the S3 chip in ObsID. 2822 as “area-2” (see, Fig. 2 lower). Area-1 includes the abundance-enhanced region, while area-2 is located on the region with “normal” abundances in the NE rim of the Cygnus Loop. As indicated by arrows in Fig. 2, discontinuities in X-ray intensity can be seen inside the X-ray boundaries in both of the two areas. This fact suggests that the shock structures in these regions can be considered as multiple shocks along the line of sight. We extract spectra from 20′′-spaced (annular for area-1, rectangle for area-2) regions inside the discontinuities of X-ray intensity (from Reg-1 to Reg-26/19 for area-1/2). We arrange the regions such that each region overlaps with each other by half of its size. Outside the discontinuities, X-ray surface brightness is relatively low so that we extract spectra from only one region to obtain enough photons to perform spectral analysis in good statistics. The region is named as Reg-0. We show all the spectral extraction regions in Fig. 2.
We subtract background emission from a source free (i.e., outside the X-ray boundary of the Cygnus Loop) region in the same chip for area-1 (see, Fig. 2 upper). On the other hand, it is quite difficult to subtract background emission from the same chip for area-2, since the X-ray emission from the Cygnus Loop is extended in almost the entire FOV of the chip (see, Fig. 2 lower). We thus subtract background emission from a source free region in the S1 chip of the same observation, after we investigate that the spectral shape and count rate in the energy band of 3–5 keV, where the emission from the Cygnus Loop is negligible, are similar between the S1 and S3 chip. We should note that the background-subtraction method was successfully performed by Miyata et al. (2001). We use data in the energy range of 0.5–2.0 keV for our spectral analysis.
We apply an absorbed non-equilibrium ionization (NEI) model with a single temperature (the wabs; Morrison & McCammon (1983) and the vpshock model (NEI version 2.0); e.g., Borkowski et al. (2001) in XSPEC v 12.3.1). Free parameters are electron temperature, ; ionization timescale, ; emission measure, EM (EM , where and are number densities of electrons and protons, respectively and is the plasma depth); abundances of C, N, O, Ne, Mg, Si, and Fe. Above, is the electron density times the elapsed time after shock heating and the vpshock model assumes a range of from zero up to a fitted maximum value. Based on previous Suzaku observations of these regions (Katsuda et al. 2008), we here fix the values of and abundance of S to be 0.02 cm-2 and 0.2 times the solar value, respectively. We also set abundance ratios of C/O and N/O to be 2 and 1.4 times the solar values which are mean values measured in the NE rim of the Cygnus Loop [calculated from Table 2 in Katsuda et al. (2008)], because emission lines from C and N are not visible in our data. We set abundances of Ni equal to that of Fe. Abundances of other elements included in the vpshock model (i.e., Ar and Ca) are fixed to the solar values (Anders & Grevesse 1989). In this way, we fit all the spectra by the one-component vpshock model. We then find apparent discrepancies between our data and the best-fit model in the energy band around 0.73 keV. Around this energy band, the dominant emission comes from either Fe-L shell lines or K-shell lines from O VII and O VIII. However, the poorly known atomic physics of Fe-L shell lines and missing O-K shell lines in the model employed are reported by Warren & Hughes (2004) and Yamaguchi et al. (2008), respectively. We thus introduce systematic error of 5% on the model in quadrature, following as Warren & Hughes (2004) did. This model give us fairly good fits for all the spectra (reduced ranges from 0.8 to 1.4). Figure 3 shows the example spectra in Reg-3 from both area-1 and area-2. The spectra are remarkably different; emission lines are stronger for the spectrum in area-1 than those for the one in area-2. The best-fit parameters and fit statistics for the two example spectra are summarized in Table 1.
Figure 4 shows abundances of O, Ne, Mg, and Fe, , log(), EM as a function of region number. Data points with open circles are from area-1, while those with open triangles are from area-2. In area-2, abundances are constant at O0.1, Ne0.2, Mg0.15, and Fe0.2, while in area-1 they increase toward the outer region of the Loop. They start to increase from around Reg-10 (200′′ behind the shock front) to the outer regions. Inside Reg-10, the values of abundances are the same level as those in area-1, while they become up to the solar values or even higher than the solar values in the outermost three regions. The electron temperature is almost constant at 0.2 keV in area-2, while it gradually increases from inner regions (0.25 keV) toward outer regions (0.35 keV) in area-1. These values are similar to those of the hot component among the two components revealed by Suzaku data (Miyata et al. 2007). The ionization states for the abundance-enhanced region show NEI conditions that are consistent with the previous results from Suzaku. On the other hand, we find that the other regions show almost collisional ionization equilibrium (CIE) conditions. In contrast to the electron temperature and abundances, the ionization timescale as well as the EM gradually decreases toward the outer regions in area-1.
We can see apparent correlations between abundances and thermodynamic parameters (i.e., and ). Therefore, we investigate whether the abundance enhancements in the outermost (200′′-thickness) region in area-1 are significant or not, by generating confidence contours between O abundance and the thermodynamic parameters. Figure 5 shows the confidence contours of O abundance against and for Reg-3 in area-1 (abundance-enhanced region) and Reg-3 in area-2 (the region with “normal” abundances). We confirm that O abundance for the abundance-enhanced region is significantly higher than that in the region with “normal” abundances. We thus conclude that the metal abundances in the northern outermost region (200′′-thickness regions behind the shock front) of the NE rim are significantly enhanced relative to those in the rest of the NE rim.
The analyses above are all concentrated in data taken by the S3 chip. For the sake of consistency, we analyze data from adjacent FI chips. We extract spectra from two regions which are located in the northernmost chips of ObsID. 2821 and 2822, respectively. These regions are shown in Fig. 1 as white ellipses. Subtracting the background emission from the same chips, we apply the same vpshock model used before. The two spectra with their best-fit models are shown in Fig. 3. The apparent difference between the two spectra is the intensity of line emission, as seen in the two example spectra from the S3 chip in each observation (see, Fig. 3 upper left and upper right). The best-fit parameters and fit statistics are summarized in Table. 1. Both absolute and relative abundances for the northern ellipse are almost consistent with those outside Reg-10 in area-1 (i.e., abundance-enhanced region), whereas those in the southern ellipse are consistent with those in area-2 (i.e., the region with “normal” abundances). Therefore, we confirm that the abundances derived are independent on ACIS chips.
4 Discussion
4.1 Possible Origin of the Plasma in the Abundance-Enhanced Region
We confirm the enhanced abundances in the northern outermost region in the NE rim of the Cygnus Loop and reveal that the abundance-enhanced region is confined in a 200′′-thickness region behind the shock front. The abundances derived here are higher than those derived by Suzaku by factor of 2. The width, 200′′, of the abundance-enhanced region is comparable to the half-power diameter, 120′′, of the Suzaku X-ray telescope (Serlemitsos et al. 2007) so that significant amount of emission from the plasma with “normal” abundances should have contaminated in the abundance-enhanced region for the Suzaku data. The superior spatial resolution of the Chandra XRT allows us to accurately determine the metal abundances in the abundance-enhanced region as well as to reveal the detailed plasma structures there.
Are the abundance enhancements caused by metal-rich ejecta such as fragments of ejecta in the vicinity of the Vela SNR (i.e., Vela shrapnels; Aschenbach et al. 1995)? In the Vela shrapnels A and D, anomalous abundance ratios between heavy elements are observed: Si/O10 times the solar value in the Vela shrapnel A (Katsuda & Tsunemi 2005), Ne/Fe10 times the solar value in the Vela shrapnel D (Katsuda & Tsunemi 2006). On the contrary, we measure abundance ratios among metals in the abundance-enhanced region of the NE rim of the Cygnus Loop to be consistent with the solar values within a factor of 2. Furthermore, the feature that the EM in the abundance-enhanced region gradually decreases toward the shock front is in contrast with those observed in the Vela shrapnels A and D. These facts lead us to consider that the origin of the abundance enhancements in the NE rim is not likely due to fragments of ejecta. Therefore, a natural explanation of the abundance enhancements is the interstellar medium (ISM) origin, since the abundances are roughly consistent with the solar values.
We should note that the electron temperature in the abundance-enhanced region tends to increase toward the shock front. This feature resembles those in the Vela shrapnels A and D, rather than that expected in Sedov phase SNRs where we expect to see temperature decrease toward the shock front as seen in the other NE rim of the Cygnus Loop found in previous observations (e.g., Miyata et al. 1994; Katsuda & Tsunemi 2008).
4.2 Non-Thermal Emission?
What causes such depleted (typically 0.2 times the solar value) abundances observed in the rest of the NE rim? One possibility is resonance scattering which can affect our abundance estimation. Raymond et al. (2003) studied effects of resonance scattering of O VI photons in the NE rim of the Cygnus Loop, by using FUV observations. They concluded that resonance scattering affected O VI intensities by a factor of 2 level. More recently, Miyata et al. (2008) also investigated the resonance-scattering effect by their Suzaku data covering the NE rim of the Cygnus Loop. In their analysis, the abundances derived were all depleted to typically 0.23 times the solar values with exception of O; O is depleted by an additional factor of two, which is well consistent with the results obtained here by Chandra. Miyata et al. (2008) concluded that about a factor of 2 depletion for only O abundance can be attributed to resonance scattering, while it is not sufficient to account for the abundance depletion observed. The other possibility is dust sputtering (Spitzer & Jenkins 1976). However, this mechanism is also ruled out due to the fact that even Ne is measured to be depleted to the solar values; Ne is a rare gas so that there is no observational evidence of Ne depletion. These facts require the other mechanisms for the origin of the abundance depletion.
We here consider effects of non-thermal emission. If the spectra are contaminated by non-thermal emission, we should have overestimated thermal continuum emission in our spectral modeling in which we attempt to reproduce spectra by only thermal emission. This will result in underestimation of metal abundances. We thus investigate whether the spectra require non-thermal emission or not. First, we introduce a power-law model in addition to the vpshock model for the spectral modeling. In this fitting procedure, we fix O abundance to the solar value, since absolute abundances (i.e., relative to H) are not constrained due to difficulty in dividing continuum emission into two (i.e., thermal and non-thermal) components. Free parameters are photon index and normalization of the power-law component and electron temperature, ionization timescale, EM, and abundances of Ne, Mg, Si, and Fe(=Ni) in the vpshock component. Abundances of other elements are fixed to the solar values (Anders & Grevesse 1989). In this way, we re-fit all the spectra by this model. From statistical point of view alone, this model significantly improves the fits for some spectra. As an example, we show the spectrum from Reg-3 in area-1 with the best-fit model in Fig. 6. The best-fit parameters are summarized in Table 1. The improvements of this power-lawvpshock model compared with the previous vpshock model (see, Fig. 3 right) mainly comes from the energy band around 0.73 keV. Since the uncertainty of the plasma code is reported in this energy range, we should carefully judge whether the power-law component is really required or not.
In this context, we evaluate multi-wavelength emission. For this purpose, instead of the power-law model, we employ the srcut model, which describes synchrotron radiation from an exponentially cut off power-law distribution of electrons in a homogeneous magnetic field (Reynolds & Keohane 1999). In this model, we fix radio spectral index to 0.42 (Uyaniker et al. 2004), while rolloff frequency and flux at 1 GHz are left as free parameters. The other parameters are treated as the same in the previous power-lawvpshock model fitting. The best-fit parameters are summarized in Table 1. We find that the derived best-fit value of the flux at 1 GHz obtained in the example spectrum (which is extracted from a small portion of the remnant), 1400 Jy, is about an order of magnitude higher than that estimated in the entire remnant of about 170 Jy (Uyaniker et al. 2004). Therefore, the derived flux of non-thermal emission in the example spectrum seems to be unreasonably high. However, we can not conclude whether or not non-thermal emission is significant in the NE rim of the Cygnus Loop, without radio data for the region which exactly corresponds to our spectral extraction region, as well as a more sophisticated model for non-thermal emission.
4.3 Speculation on the Origin of the Abundance Inhomogeneity in the Rim of the Cygnus Loop
It is believed that the Cygnus Loop is a result from a core-collapse SN (e.g., Miyata et al. 1998) which exploded in a pre-existing cavity (e.g., McCray et al. 1979). There are a number of evidence that the blast wave is recently encountered into a rigid wall of the cavity; the NE rim (Hester et al. 1994; Miyata & Tsunemi 1999), the southeast rim (Graham et al. 1995; Miyata & Tsunemi 2001), the eastern rim (Levenson et al. 1996), and the western rim (Levenson et al. 2002). According to previous X-ray observations, deficient metal abundances are commonly reported in these regions; metal abundances are typically 0.2 times the solar values in the NE rim (e.g., Miyata & Tsunemi 1999; this work), O group abundance is 0.2 times the solar value in the western rim (Leahy 2004). In these regions, the X-ray–emitting plasma should be the shock heated gas originating from either the cavity wall or swept-up matter in the cavity. Although the reason of the depletion still remains as an open question, these plasma seem to show depleted abundances.
Meanwhile, there is an apparent break of the cavity wall that is seen as the south blowout region (see, e.g., figures in Aschenbach & Leahy 1999). The wall of the cavity there is considered to be so thin (or negligible) that the blast wave already overran the wall, although Uyaniker et al. (2002) proposed another possibility, i.e., a different SNR interacting with the Cygnus Loop, for the south blowout region. The similar structure is expected at the circular shell in the northwest of the Cygnus Loop along the line of sight (Tsunemi et al. 2007). Looking at the NE rim of the Loop, we see somewhat large expansion of the X-ray boundary at the abundance-enhanced region (see, Fig. 1). Therefore, we presume that the blast wave here also overran the cavity wall and now is proceeding into the surrounding ISM with about solar metallicity, resulting in relatively enhanced abundances there. In this context, we predict that abundances show about solar values around the X-ray boundaries where cavity wall seems to be broken. This will be checked by future X-ray observations.
5 Conclusion
We analyzed archival Chandra data of the Cygnus Loop NE rim where abundance inhomogeneities were found by recent Suzaku observations (Katsuda et al. 2008). Thanks to the superior spatial resolving power of Chandra, we were able to carry out detailed spatially resolved spectral analyses for the region. We revealed that the abundance-enhanced region was concentrated in a 200′′-thickness region behind the shock front and confirmed that the values of abundances were consistent with the solar values by a factor of 2. Also, we found that the emission measure decreased toward the shock front. These features showed stark contrast with those seen in the Vela shrapnels, indicating that the abundance enhancements in the NE rim of the Cygnus Loop were not likely due to fragments of ejecta. We suggested that the plasma in the abundance-enhanced region originated from the ISM, whereas the plasma in the rest of the NE rim (i.e., abundance-depleted region) originated from the cavity wall or the gas in the cavity.
References
- Anders & Grevesse (1989) Anders, E., & Grevesse, N. 1989, Geochim. Cosmochim. Acta, 53, 197
- Aschenbach et al. (1995) Aschenbach, B., Egger, R., & Trumper, J. 1995, Nature, 373, 587
- Aschenbach & Leahy (1999) Aschenbach, B. & Leahy, D. A. 1999, A&A, 341, 602
- Blair et al. (2005) Blair, W. P., Sankrit, R., & Raymond, J. C., 2005, AJ, 129, 2268
- Borkowski et al. (2001) Borkowski, K. J., Lyerly, W. J., & Reynolds, S. P. 2001, ApJ, 548, 820
- Chevalier & Raymond (1978) Chevalier, R. & Raymond, J. C. 1978, ApJ, 225, 27
- Ghavamian et al. (2001) Ghavamian, P., Raymond, John., Smith, R. C., & Hartigan, P. 2001, ApJ, 547, L995
- Graham et al. (1995) Graham, J. R., Levenson, N. A., Hester, J. J., Raymond, J. C., & Petre, R. 1995, ApJ, 444, 787
- Hester et al. (1994) Hester, J. J., Raymond, J. C., & Blair, W. P. 1994, ApJ, 420, 721
- Katsuda (2005) Katsuda, S., & Tsunemi, H. 2005, PASJ, 57, 620
- Katsuda (2006) Katsuda, S., & Tsunemi, H. 2006, ApJ, 642, 917
- Katsuda et al. (2008) Katsuda, S., Tsunemi, H., Uchida, H., Miyata, E., Nemes, N., Miller, E. D., Mori, K., & Hughes, J. P. 2008, PASJ in press
- Katsuda & Tsunemi (2008) Katsuda, S. & Tsunemi, H. 2008, Adv. Space Res., 41, 383
- Levenson et al. (1996) Levenson, N. A., Graham, J. R., & R. Petre 1996, ApJ, 468, 323
- Leahy et al. (1997) Leahy, D., Roger, R., & Ballantyne, D. 1997, AJ, 114, 2081
- Leahy (2004) Leahy, D. A. 2004, MNRAS, 351, 385
- Levenson et al. (1996) Levenson, N. A., Graham, J. R., Hester, J. J., & Petre, R. 1996, ApJ, 468, 323
- Levenson et al. (1999) Levenson, N. A., Graham, J. R., & Snowden, S. L. 1999, ApJ, 526, 874
- Levenson et al. (2002) Levenson, N. A., Graham, J. R., & Walters, J. L. 2002, ApJ, 576, 798
- McCray & Snow (1979) McCray, R. & Snow, T. P., Jr. 1979, ARA&A, 17, 213.
- Miyata et al. (1994) Miyata, E., Tsunemi, H., Pisarki, R., and Kissel, S. E. 1994, PASJ, 46, L101
- Miyata et al. (1998) Miyata, E., Tsunemi, H., Kohmura, T., Suzuki, S., and Kumagai, S. 1998, PASJ, 50, 257
- Miyata & Tsunemi (1999) Miyata, E., & Tsunemi, H. 1999, ApJ, 525, 305
- Miyata et al. (2001) Miyata, E., Tsunemi, H., Aschenbach, B., & Mori, K. 2001, ApJ, 559, L45
- Miyata & Tsunemi (2001) Miyata, E., & Tsunemi, H. 2001, ApJ, 552, 624
- Miyata et al. (2007) Miyata, E., Katsuda, S., Tsunemi, H., Hughes, J. P., Kokubun, M., & Porter, F. S. 2007, PASJ, 59, S163.
- Miyata et al. (2008) Miyata, E., Masai, K., & Hughes, J. P. 2008, PASJ, in press
- Morrison & McCammon (1983) Morrison, R. & McCammon, D. 1983, ApJ, 270, 119
- Raymond et al. (1983) Raymond, J. C., Blair, W. P., Fesen, R. A., & Gull, T. R. 1983, ApJ, 275, 636
- Raymond et al. (2003) Raymond, J. C., Ghavamian, P., Sankrit, R., Blair, W. P., & Curiel, S. 2003, ApJ, 584, 770
- Raynolds & Keohane (1999) Raynolds, S. P. & Keohane, J. W. 1999, ApJ, 525, 368
- Sankrit et al. (2000) Sankrit, R., Blair, W. P., Raymond, J. C., & Long, K. S. 2000, AJ, 120, 1925
- Serlemitsos et al. (2007) Serlemitsos, P. J. et al. 2007, PASJ, 59, S9
- Spitzer & Jenkins (1976) Spitzer, L., & Jenkins, E. B. 1976, ARA&A, 13, 133
- Tsunemi et al. (2007) Tsunemi, H., Katsuda, S., Nemes, N., & Miller, E. D. 2007, ApJ,
- Uyaniker et al. (2002) Uyaniker, B., Reich, W., Yar, A., Kothes, R., & Furst, E. 2002, A&A, 389, L61
- Uyaniker et al. (2004) Uyaniker, B., Reich, W., Yar, A., & Furst, E. 2004, A&A, 426, 909
- Warren & Hughes (2004) Warren, J. S. & Hughes, J. P. 2004, ApJ, 608, 261
- Yamaguchi et al. (2007) Yamaguchi, H., Koyama, K., Katsuda, S., Nakajima, H., Hughes, J. P., Bamba, A., Hiraga, J. S., Mori, K., Ozaki, M., Tsuru, G. T. 2007, PASJ, in press
- (40)
| Reg-3 in Area-1 | Northern Ellipse | Reg-3 in Area-2 | Southern Ellipse | |||
|---|---|---|---|---|---|---|
| Model | vpshock | vpshock | vpshock | power-lawvpshock | srcutvpshock | vpshock |
| Photon Indexa | 7.0 | 0.42 (fixed) | ||||
| Fluxb | 3.30.1 | 1400 | ||||
| (Hz) | 2.90.6 | |||||
| (keV) | 0.32 | 0.32 | 0.19 | 0.270.05 | 0.26 | 0.23 |
| log | 10.58 | 10.90 | 11.8 | 11.2 | 11.3 | 11.5 |
| O | 1.4 | 0.8 | 0.10 | 1 (fixed) | 1 (fixed) | 0.11 |
| Ne | 2.3 | 1.3 | 0.19 | 1.6 | 1.7 | 0.21 |
| Mg | 1.1 | 0.7 | 0.14 | 1.2 | 1.2 | 0.17 |
| Si | 20 | 0.3 | 1 | 3 | 3 | 0.6 |
| Fe(=Ni) | 1.4 | 0.75 | 0.23 | 1.2 | 1.2 | 0.21 |
| EM ( cm-5) | 0.20 | 0.37 | 6.5 | 0.27 | 0.28 | 7.0 |
| /d.o.f. | 56/52 | 111/92 | 60/54 | 52/52 | 50/52 | 62/70 |
Note. — The best-fit parameters for example spectra in Fig. 3 and Fig. 6. The errors are in the range . Errors for abundances and fluxes in power-law and srcut models are estimated with the EM fixed at the best-fit value. Errors for the EM are estimated with the O abundance fixed at the best-fit value. aPhoton index in the power-law model is determined by the X-ray spectrum, while it is determined in a radio spectrum for the srcut model. bThe units are 10-5 photons cm-2 sec -1 keV-1 at 1 keV for the power-law model, and Jy at 1 GHz for the srcut model.