Connecting Substructure in Galaxy Cluster Cores at z=0.2 with Cluster Assembly Histories
Abstract
We use semi-analytic models of structure formation to interpret gravitational lensing measurements of substructure in galaxy cluster cores () at . The dynamic range of the lensing-based substructure fraction measurements is well matched to the theoretical predictions, both spanning . The structure formation model predicts that is correlated with cluster assembly history. We use simple fitting formulae to parameterize the predicted correlations: and , where and are the predicted lookback times from to when each theoretical cluster had acquired 90% and 50% respectively of the mass it had at . The best-fit parameter values are: , and , . Therefore (i) observed clusters with (e.g. A 383, A 1835) are interpreted, on average, to have formed at and to have suffered mass growth since , (ii) observed clusters with (e.g. A 68, A 773) are interpreted as, on average, forming since and suffering mass growth in the preceding , i.e. since . In summary, observational measurements of can be combined with structure formation models to estimate the age and assembly history of observed clusters. The ability to “age-date” approximately clusters in this way has numerous applications to the large clusters samples that are becoming available.
Subject headings:
gravitational lensing — cosmology:dark matter — galaxies:clusters:individual (A 68, A 209, A 267, A 383, A 773, A 963, A 1763, A 1835, A 2218, A 2219)1. Introduction
The mass growth of clusters is sensitive to the dark energy equation of state parameter , the matter density of the universe and the normalization of the matter power spectrum (e.g. Evrard et al. 1993; Smith et al. 2003; Mantz et al. 2007). Clusters are inferred to grow hierarchically via the ingestion of smaller dark matter halos (that host galaxies) into the more massive parent halo (cluster). The structure of galaxy clusters, specifically the internal substructure of clusters, therefore contains a wealth of cosmological information, including possible clues about the physics of the dark matter particle itself (e.g. Natarajan et al. 2002). From an astrophysical point of view, the mass growth of clusters brings new (generally gas rich) galaxy populations into clusters (e.g. Moran et al. 2007) and may lead to shock-heating of the intracluster medium and/or disruption of cooling in cluster cores (e.g. Poole et al. 2008). Reliable measurement and intepretation of cluster substructure is therefore of broad interest.
The most direct way to detect substructure within clusters is via gravitational lensing. Group-scale substructures within individual clusters were detected in early ground-based strong-lensing studies of individual clusters (Pello et al., 1991; Kneib et al., 1993, 1995) and subsequently measured to high precision using Hubble Space Telescope (HST) data (Kneib et al., 1996). Smith et al. (2005 – hereafter Sm05 – see §2) then measured the structure of a sample of 10 clusters at . In this article we use Taylor & Babul’s (2004 – hereafter TB04) semi-analytical models of structure formation to interpret Sm05’s cluster substructure measurements, as a means of exploring lensing-based substructure measurements as a quantitative probe of cluster age and assembly history.
2. Summary of Observational Results
| Cluster | Redshift | Strong Lensing? | Sm05 Classification | |||||
|---|---|---|---|---|---|---|---|---|
| () | ||||||||
| A 383 | 0.188 | 1 | Confirmed | Undisturbed uni-modal | ||||
| A 963 | 0.206 | 1 | Confirmed | Undisturbed uni-modal | ||||
| A 1835 | 0.253 | 1 | Unconfirmed | Undisturbed uni-modal | ||||
| A 267 | 0.230 | 1 | Unconfirmed | Disturbed uni-modal | ||||
| A 1763 | 0.288 | 1 | No? | Disturbed uni-modal | ||||
| A 209 | 0.209 | 1 | No? | Disturbed uni-modal | ||||
| A 2219 | 0.228 | 3 | Confirmed | Disturbed multi-modal | ||||
| A 2218 | 0.171 | 2 | Confirmed | Disturbed multi-modal | ||||
| A 68 | 0.255 | 2 | Confirmed | Disturbed multi-modal | ||||
| A 773 | 0.217 | 3 | Unconfirmed | Disturbed multi-modal |
Sm05 investigated the projected mass and structure of ten X-ray luminous (, ) cluster cores at (Table 1). Hubble Space Telescope (HST)/WFPC2 imaging and ground-based spectroscopy of gravitational arcs (Smith et al., 2001, 2002; Sand et al., 2005; Richard et al., 2007), were used to characterize the strong and weak gravitational lensing signal of each cluster core. The lensing signals were then used to constrain a detailed parametrized model of the projected mass distribution in each cluster core following Kneib (1993 – see also Kneib et al. 1996 and Smith 2002). Each lens model includes mass components that account for both the underlying dark matter distribution in the cluster (cluster/group-scale mass components) and the cluster galaxies down to . For clarity, we refer to the main central cluster dark matter halo as the cluster-scale mass component, and all other massive substructures associated with infallen clusters and/or groups as group-scale mass components. The typical number of galaxy-scale mass components in each lens model was 30.
The HST data probe out to a typical projected cluster-centric radius of at the cluster redshifts. Sm05 measured the cluster substructure within this radius. Here we define as the fraction of mass associated with substructures, , where is the central mass fraction used by Sm05. For this purpose, “substructures” include group-scale masses and galaxy-scale masses, with the exception of the brightest cluster galaxy (BCG). This is because BCG mass is degenerate with cluster-scale mass in the lens models, and, in any event, Sm05 found no evidence for BCGs being offset from the center of the cluster-scale mass components. The clusters are listed in order of increasing in Table 1, together with , the number of cluster/group-scale mass components in each lens model. As expected, and are correlated, however there is a factor of 3 spread in for sub-samples of clusters with and . Note, that to aide comparison of Sm05’s lens modeling results with predictions, the values of in Table 1 have been adjusted upwards to take account of the fact that the “L”-shaped observed WFPC2 field of view () covers just of a circle of radius (). The WFPC2 observations were originally designed to include the likely group-scale substructures in the cluster cores. The adjustments to therefore account statistically for the galaxy-scale masses not included in Sm05’s analysis, leaving unchanged.
Cluster-to-cluster differences in arise for two reasons: (i) group-scale mass components in the lens models that are associated with massive, likely in-falling structures such as groups of galaxies, and (ii) cluster galaxies that are associated both with the central cluster dark matter halo (and are presumably virialized) and with the in-falling structures. Sm05 broadly interpreted measurements of as indicating the merger history of clusters, however quantitative conclusions on cluster assembly and age were impossible without theoretical models.
3. Summary of Theoretical Models
TB04’s semi-analytic model of halo evolution provides a fast way of generating a large number of model halos for comparison with observations, and agrees well in its preditions with self-consistent n-body simulations (Taylor & Babul, 2005). The model includes two main components, a merger-tree code for determining the assembly history of an individual cluster, and an analytic description of how the main halo and the merging subcomponent evolve after each merger. We will summarize these components here, and refer the reader to TB04 for full details.
The merger tree describing the assembly of a single cluster is generated randomly using the algorithm of Somerville & Kolatt (1999). Starting from a halo of specified mass at , the algorithm chooses an interval to step back in redshift and picks progenitors at this redshift following extended Press-Schechter merger statistics (Lacey & Cole, 1993). Iterating produces a complete history of the mergers through which the final object assembled, down to some limiting mass resolution and back to some redshift. In this article we use a set of 1000 merger trees whose final masses at are randomly drawn from the massive end () of a halo mass function. For the range of concentration parameters derived for our halos (as explained below), this produces projected masses within a cluster-centric radius of (integrating out to the virial radius along the line of sight) in the range , similar to those in the observed sample (Table 1). The merger trees for these systems are followed back to a redshift of , or until they drop below the resolution limit of the final mass.
Given a merger tree, the model of TB04 selects the most massive progenitor in the most recent merger and traces its history back, selecting the most massive progenitor at each time step. This object is considered the “main” system, and is modelled as a spherical halo with a radial density profile similar to the “universal” profile found in simulations (Navarro et al., 1997). To account for some of the centrally concentrated (baryonic) mass in the cluster, we use the fitting formula proposed by Moore et al. (1998), which has a steeper central cusp. In an update to the model presented in TB04, in this work we use the whole mass assembly history of the system, rather than just its instantaneous mass, to derive the value of its concentration parameter at each redshift step, following Wechsler et al. (2002). Each merging subhalo is added to this main system as a smaller spherical object with a Moore profile, and its subsequent orbit and mass-loss history are determined using the analytic description of dynamical friction, tidal stripping and tidal heating in Taylor & Babul (2001). Subhalos are tracked until they are disrupted either by repeated tidal stripping or by passing within of the centre of the main potential. The model also includes simple treatments of sub-substructure (subhalos within subhalos), correlated orbits in infalling groups of objects, and collisions and encounters between objects. See TB04 for a detailed explanation of these elements.
For each merger tree, we use the semi-analytic model to determine how much substructure exists at , and calculate as the fraction of the mass projected within of the halo centre that is contained in the 30 most massive subhalos in the system (to match the observations – see §2). We exclude from the final analysis any substructure which ends up within 5% of of the halo centre, since in a real cluster most such objects would interact strongly and merge rapidly with the dominant central galaxy. We also record several indicators of the mass assembly history of the main system in each merger tree, including and , the lookback times by which it had assembled 90% and 50% respectively of the mass it has at redshift . These thresholds are chosen to probe the recent infall history and cluster age respectively. We show the resulting and distributions in Fig. 1. The observed clusters span a dynamic range of (Table 1), which is comparable with that of the TB04 theoretical models, and consistent with other theoretical estimates of cluster substructure (e.g. Diemand et al. 2004; Gao et al. 2004; Nagai & Kravtsov 2005; van den Bosch et al. 2005).
4. Results
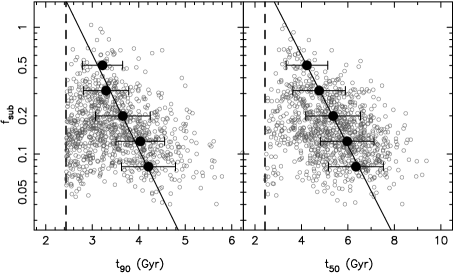
Fig. 1 reveals that the TB04 model predicts that and are correlated, as are and . However, at the distributions of and are bi-modal – some theoretical clusters exhibiting both a low substructure fraction and recent significant infall. The unphysical location of these clusters in Fig. 1 is due to a timing difference between the axes – is sensitive to mass growth within the virialized region of the cluster (approximately a sphere of diameter ); is sensitive to substructures in a cylinder of diameter through the center of the cluster. If an infalling structure has crossed the virial radius but not yet entered the cylinder, then it may appear in the “spike”of clusters at and (or ). We exclude these clusters from the calculations described below.
We have therefore confirmed and considerably extended Sm05’s qualitative interpretation of the lensing results: clusters with high substructure fractions have (i) suffered more pronounced recent infall than clusters with low substructure fractions, and (ii) formed at later times than clusters with lower substructure fractions. To quantify this, we fit the following simple formulae to the theoretical data: and , where and parameterize the dependence of and respectively on ; and are the intercepts at . We first bin up the individual theoretical data points in bins of width , and then weight each bin in the fit by the reciprocal of the sample variance in the respective bin. The best fit parameter values obtained in this way are: , and , . The and parameters are measurements of the timing difference between the axes in Fig. 1 discussed above, and are well-matched to the infall timescale of .
The best-fit models were then used to interpret quantitatively the observed substructure fractions from Sm05 listed in Table 1 – i.e. to estimate the age () and recent infall history () of each cluster – see Table 1. The uncertainties on and quoted in Table 1 incorporate errors on and on the best-fit parameter values derived above, and are dominated by the scatter on and . The typical uncertainty on cluster age is , with ages spanning . Cluster with the largest substructure fractions, i.e. formed within the Gyr preceding , i.e. since , and had not assembled 90% of the mass they had at until , i.e. just Myr before . In contrast, clusters with the lowest subtructure fractions, i.e. formed before , i.e. at . and then went on to assemble of their mass within the ensuing , and suffered negligible mass growth in the prior to , i.e. since . Therefore we interpret clusters with the lowest as being, on average, almost fully () assembled by the time that the clusters with highest had barely formed (i.e. assembled half of their mass).
5. Caveats
TB04 make some simplifying assumptions that may affect our results: (i) dark matter halos are assumed to be spherical, whereas real dark matter halos are likely triaxial; (ii) all matter is treated as collisonless, thus ignoring baryonic physics including adiabatic contraction due to gas cooling and the dynamical effects of galaxies; (iii) matter outside the cluster virial radius is ignored; in contrast, lensing is sensitive to all the matter along the line of sight, including chance foreground and background projections. We will consider these complications in more detail in future work.
The main systematic uncertainty on the observed substructure fractions is the completeness of Sm05’s lens models as a function of sub-halo mass. A detailed study of this issue will be published in the future (Hamilton-Morris et al., in prep.). Here we identify how many of Sm05’s models may suffer from incompleteness. Incompleteness is most likely to arise from features in the dark matter distribution not identified in the luminous properties of the clusters within , including group-scale dark matter halos in which the cluster galaxies may be embedded. Strong lensing has been detected in eight of the ten observed clusters (Table 1); group-scale dark matter halos are detected in three of the eight by the measurable way they alter the appearance of strongly-lensed arcs compared to simpler mass distributions. Clusters in which strong-lensing has not been detected are therefore of greatest concern, as pointed out in Sm05’s discussion of the filament feeding A 1763; see also Mercurio et al.’s (2003) discussion of the complex dynamical structure of A 209. Gross substructure incompleteness may therefore be a concern for of the observed sample.
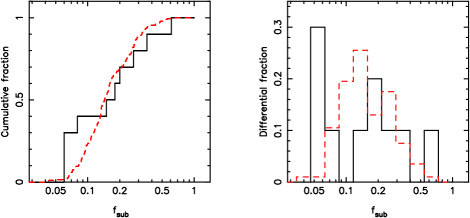
We also consider whether there is any evidence in the respective distributions for systematic differences between Sm05’s X-ray selected sample and TB04’s mass-selected sample. To address this we compare the cumulative and differential distributions in Fig. 2. A KS test obtains a probability of 20% that the observed and theoretical distributions are drawn from the same parent distribution, i.e. formally evidence of systematic differences between the samples at significance. The small observed sample size of just 10 clusters is clearly a limiting factor here. The right panel of Fig. 2 helps somewhat, as it highlights more clearly the possible bias of the observed sample to very high and very low values of . Such a bias would be plausible because cluster-cluster mergers and cool cores both suffer an excess of X-ray flux at a fixed mass over a non-merging, non-cool core cluster. A much larger observational sample is required to investigate this issue further.
6. Conclusions and Future Prospects
We have combined theoretical models of structure formation (TB04) with gravitational lens models of galaxy clusters (Sm05) to explore how measurements of cluster substructure from lensing observations can be interpreted in the context of the age and assembly history of clusters. The main result is that , the fraction of cluster mass within a projected cluster-centric radius of associated with substructure (galaxies and group-scale halos), as can be measured from lensing data, is predicted to be strongly correlated with the age and recent mass growth of galaxy clusters. We fitted the the following simple formulae to the theoretical data to quantify the predicted behavior in a convenient form: and , where and are the lookback times at which a cluster had acquired 90% and 50% of its mass at . The best fit parameter values are: , and , . Low- clusters (; e.g. A 383, A 1835) are therefore interpreted as, on average, having formed at and having suffered mass growth in the 2 Gyr preceding , i.e. since . In contrast, high- clusters (; e.g. A 68, A 773) are interpreted, on average, to have formed just before , i.e. since , and suffered mass growth in the preceding , i.e. since .
Our synthesis therefore demonstrate that lensing-based measurements of can be combined with semi-analytic structure formation models to estimate the average age and assembly history of observed clusters. This suggests numerous avenues for further exploration, including: (i) expansion of the observed samples by at least an order of magnitude, (ii) calibration of the completeness of the lensing-based mass function of sub-halos in clusters, (iii) investigation of how lensing-based cluster age and assembly history estimates might allow new cosmological constraints to be derived, for example, on the dark energy equation of state parameter , (iv) analysis of cluster galaxy populations and cluster scaling relations as a function of cluster age.
References
- Diemand et al. (2004) Diemand, J., Moore, B., & Stadel, J. 2004, MNRAS, 352, 535
- Evrard et al. (1993) Evrard, A. E., Mohr, J. J., Fabricant, D. G., & Geller, M. J. 1993, ApJ, 419, L9+
- Gao et al. (2004) Gao, L., White, S. D. M., Jenkins, A., Stoehr, F., & Springel, V. 2004, MNRAS, 355, 819
- Kneib (1993) Kneib, J.-P. 1993, Ph.D. Thesis, Université Paul Sabatier, Toulouse, France
- Kneib et al. (1996) Kneib, J.-P., Ellis, R. S., Smail, I., Couch, W. J., & Sharples, R. M. 1996, ApJ, 471, 643
- Kneib et al. (1993) Kneib, J. P., Mellier, Y., Fort, B., & Mathez, G. 1993, A&A, 273, 367
- Kneib et al. (1995) Kneib, J. P., Mellier, Y., Pello, R., Miralda-Escude, J., Le Borgne, J.-F., Boehringer, H., & Picat, J.-P. 1995, A&A, 303, 27
- Lacey & Cole (1993) Lacey, C. & Cole, S. 1993, MNRAS, 262, 627
- Mantz et al. (2007) Mantz, A., Allen, S. W., Ebeling, H., & Rapetti, D. 2007, ArXiv e-prints, 709
- Mercurio et al. (2003) Mercurio, A., Girardi, M., Boschin, W., Merluzzi, P., & Busarello, G. 2003, A&A, 397, 431
- Moore et al. (1998) Moore, B., Governato, F., Quinn, T., Stadel, J., & Lake, G. 1998, ApJ, 499, L5+
- Moran et al. (2007) Moran, S. M., Ellis, R. S., Treu, T., Smith, G. P., Rich, R. M., & Smail, I. 2007, ApJ, 671, 1503
- Nagai & Kravtsov (2005) Nagai, D. & Kravtsov, A. V. 2005, ApJ, 618, 557
- Natarajan et al. (2002) Natarajan, P., Loeb, A., Kneib, J.-P., & Smail, I. 2002, ApJ, 580, L17
- Navarro et al. (1997) Navarro, J. F., Frenk, C. S., & White, S. D. M. 1997, ApJ, 490, 493
- Pello et al. (1991) Pello, R., Sanahuja, B., Le Borgne, J., Soucail, G., & Mellier, Y. 1991, ApJ, 366, 405
- Poole et al. (2008) Poole, G. B., Babul, A., McCarthy, I. G., Sanderson, A. J. R., & Fardal, M. A. 2008, ArXiv e-prints, 804
- Richard et al. (2007) Richard, J., Kneib, J.-P., Jullo, E., Covone, G., Limousin, M., Ellis, R., Stark, D., Bundy, K., Czoske, O., Ebeling, H., & Soucail, G. 2007, ApJ, 662, 781
- Sand et al. (2005) Sand, D. J., Treu, T., Ellis, R. S., & Smith, G. P. 2005, ApJ, 627, 32
- Smith (2002) Smith, G. P. 2002, Ph.D. Thesis, University of Durham, UK
- Smith et al. (2003) Smith, G. P., Edge, A. C., Eke, V. R., Nichol, R. C., Smail, I., & Kneib, J. 2003, ApJ, 590, L79
- Smith et al. (2001) Smith, G. P., Kneib, J., Ebeling, H., Czoske, O., & Smail, I. 2001, ApJ, 552, 493
- Smith et al. (2005) Smith, G. P., Kneib, J.-P., Smail, I., Mazzotta, P., Ebeling, H., & Czoske, O. 2005, MNRAS, 359, 417
- Smith et al. (2002) Smith, G. P., Smail, I., Kneib, J.-P., Davis, C. J., Takamiya, M., Ebeling, H., & Czoske, O. 2002, MNRAS, 333, L16
- Somerville & Kolatt (1999) Somerville, R. S. & Kolatt, T. S. 1999, MNRAS, 305, 1
- Tasitsiomi et al. (2004) Tasitsiomi, A., Kravtsov, A. V., Gottlöber, S., & Klypin, A. A. 2004, ApJ, 607, 125
- Taylor & Babul (2001) Taylor, J. E. & Babul, A. 2001, ApJ, 559, 716
- Taylor & Babul (2004) —. 2004, MNRAS, 348, 811
- Taylor & Babul (2005) —. 2005, MNRAS, 364, 535
- van den Bosch et al. (2005) van den Bosch, F. C., Tormen, G., & Giocoli, C. 2005, MNRAS, 359, 1029
- Wechsler et al. (2002) Wechsler, R. H., Bullock, J. S., Primack, J. R., Kravtsov, A. V., & Dekel, A. 2002, ApJ, 568, 52