A young, dusty, compact radio source within a Ly halo
Abstract
We report here on the discovery of a red quasar, J004929.4+351025.7 at a redshift of , situated within a large Ly emission-line halo. The radio spectral energy distribution implies that the radio jets were triggered years prior to the time at which the object is observed, suggesting that the jet triggering of the active galactic nucleus is recent. The loosely biconical structure of the emission-line halo suggests that it is ionised by photons emitted by the central quasar nucleus and that the central nucleus is obscured by a dusty torus with . The large spatial extent of the Ly halo relative to the radio emission means this could only have occurred if the radio jets emerged from an already established highly-accreting black hole. This suggests that the radio-jet triggering is delayed with respect to the onset of accretion activity on to the central supermassive black hole.
keywords:
galaxies: active – galaxies: halos – galaxies: high-redshift – quasars: individual: J004929+3510251 Introduction
Most quasars exhibit a blue optical and ultraviolet continuum, broad emission lines, and narrow forbidden emission lines of highly ionised elements (e.g. Schneider et al., 2003). However, there is also a population of reddened quasars predicted by the unification schemes (Urry & Padovani, 1995), and which have been known for a number of years (e.g. Webster et al., 1995). The origin of red quasars and their fraction relative to normal quasars is still subject of debate: we still do not know the fraction that are intrinsically red, e.g. in radio-loud quasars the synchrotron tail can extend into the near-infrared and optical wavebands (Whiting et al., 2001), or the fraction that are reddened by dust (e.g. Richards et al., 2003). For the dusty quasars, it is not clear if the dust is typically situated in a dusty torus around the central quasar nucleus (e.g. Antonucci, 1993), or whether it is distributed more widely throughout the host galaxy (e.g. Martínez-Sansigre et al., 2006).
Determining the fraction of very red quasars (red, reddened or both) in the total population is essential for a precise determination of the quasar Luminosity Function (LF) and also for understanding the evolution of quasars and the nature of the quasar-galaxy connection. If a large fraction is eliminated from optical surveys by simple dust reddening then the relative comoving space density of such objects may be much higher and would have a much more profound effect on the evolution of massive galaxies.
Historically optical surveys, relying on the ultraviolet-excess and power-law shape of the typical (i.e. blue) quasar spectrum, have failed to discover this red population, principally due to the fact that the blue excess is not present in reddened quasars (Richards et al., 2004). Unsurprisingly, recent radio and infrared surveys have shown a better promise in finding red quasars over all redshifts (Glikman et al., 2007). Although previous large area attempts have suffered from incompleteness, this is still the most promising approach.
Many powerful, high-redshift radio-loud active galactic nuclei (AGN), are now known to be surrounded by large-scale, highly-luminous, Ly emission-line haloes (Chambers et al., 1988; Villar-Martín et al., 2002; Reuland et al., 2003). Similar Ly emission haloes have also been found around a radio-quiet quasar (Weidinger et al., 2005), and submillimetre galaxies (Steidel et al., 2000; Chapman et al., 2004; Bower et al., 2004; Geach et al., 2005). This suggests that giant Ly halos may be associated with the onset of quasar and/or starburst activity (see also Haiman & Rees, 2001; Ohyama et al., 2003; Wilman et al., 2005). However, the recent discovery of a number of large diffuse Ly haloes around seemingly quiescent galaxies (Nilsson et al., 2006; Smith & Jarvis, 2007; Saito et al., 2007) suggests a model in which the origin of some Ly haloes is cold gas accreting on to the dark-matter halo of a massive galaxy (Fardal et al., 2001; Dijkstra et al., 2006). There may therefore be several mechanisms responsible for giant Ly haloes. However, most of the large kpc haloes discovered so far seem to surround massive galaxies, thus the large haloes may be a product or a requisite ingredient in the formation of massive galaxies at high redshift, regardless of the mechanism behind their ionisation.
In this paper we report the discovery of a reddened quasar that conforms to the idea that red, young, radio quasars at might pick out dusty, possibly star-forming, massive galaxies within giant Ly haloes. In section 2 we present the photometric and spectroscopic data and in section 3 we discuss the properties of this object. In section 4 we make some concluding remarks concerning the implications of this object for jet-triggering in AGN. We assume throughout that and . All quoted magnitudes are in the Vega system.
2 Data & observations
| Survey | Frequency / | Flux Density/ | |
| GHz | mJy | ||
| VLA | 8.4 | 33.4 | 1.4 |
| GB6 | 4.85 | 67 | 9 |
| NVSS | 1.4 | 122.0 | 3.7 |
| WENSS | 0.325 | 101 | 18 |
| 6C | 0.151 | 400 | |
| VLSS | 0.074 | 500 | |
2.1 Quasar discovery
J004929.4+351025.7 (hereafter J0049+3510) was initially found by cross-matching the 325 MHz Westerbork Northern Sky Survey (WENSS; Rengelink et al., 1997) and the 1.4 GHz Northern VLA Sky Survey (NVSS; Condon et al., 1998) radio source catalogues as part of our survey for quasars (Jarvis et al., 2004). It has a 325 MHz flux density of and a 1.4GHz flux-density of mJy, giving an inverted radio spectrum between 325MHz and 1.4GHz, . As inspection of the Digitized Sky Survey showed no optical counterpart at the radio position, it was marked for follow up in the optical and near-infrared wavebands as a candidate quasar.
2.2 Radio data
A search in the literature showed counterparts for J0049+3510 in the GB6 4.85 GHz survey (Gregory et al., 1996) but no counterparts in the 6C 151 MHz survey (Hales et al., 1993), nor the VLSS 74 MHz survey (Cohen et al., 2007). The source position is not covered by the FIRST survey (Becker et al., 1995).
Archive observations from the VLA, in A-array, X-band (), were recovered and a map made from the data available. This revealed a compact radio source (unresolved at 0.3 arcsec resolution) with a flux density mJy (see Table 1). The radio-spectrum of J0049+3510 is shown in Figure 1, and it is apparent that the SED is peaked around 1.2 GHz. Given the compact nature and the peak of the SED at 1.2 GHz we classify this quasar as a Giga-Hertz-Peaked-Spectrum (GPS; O’Dea, 1998) source.
| Date | Telescope & | Filter | Exposure | Seeing | Aperture | Magnitude |
|---|---|---|---|---|---|---|
| Instrument | (s) | (arcsec) | (arcsec) | Vega | ||
| 2004-12-13 | INT–WFC | 1800 | 1.1 | 10 | 19.56 0.15 | |
| 2003-08-28 | HJST-IGI | 150 | 1.2 | 2 | 23.9 | |
| 2003-09-22 | WHT–PFIP | 1200 | 1.2 | 2 | 24.5 | |
| 2004-11-04 | WHT–LIRIS | 3000 | 0.6 | 2 | 21.06 0.20 | |
| 2003-09-26 | UKIRT–UFTI | 540 | 0.7 | 2 | 18.69 0.15 | |
| 2003-09-15 | UKIRT–UFTI | 540 | 0.5 | 2 | 17.62 0.07 |

2.3 Optical and near-infrared imaging
The quasar was subsequently observed at Harlan J. Smith Telescope (HJST) at McDonald Observatory for 150 s in the -band. The data were bias-subtracted, flat-fielded, and combined with standard iraf packages. For flux calibration we used standard stars observed on the same night. Aperture photometry was performed using the iraf apphot package with a 2 arcsec diameter aperture. No identification was found at the position of the radio source, implying that our source was fainter than mag at the level.
Following our search method, we targeted it with near-infrared -band imaging on the UK Infrared Telescope (UKIRT) with good seeing conditions ( arcsec). The UKIRT imaging was carried out with the UKIRT Fast-Track Imager (UFTI) using the standard nine-point jitter pattern and reduced using oracdr pipeline, which subtracts the dark current and flat-fields the data with a median sky-flat constructed from the individual science frames. These observations showed an unresolved source within 0.5 arcsec of the radio position with (Fig. 2).
J0049+3510 was then targeted in - and -bands, again, with the UKIRT-UFTI using the same strategy as for the -band observations, which showed that it was also identified in the -band with , however the -band observations were carried out in poor conditions and an accurate -band magnitude could not be obtained.
Subsequent deep optical -band imaging on the William Herschel Telescope (WHT) produced blank fields with a limit of (). Deep -band observations were also carried out with the Long-slit Intermediate Resolution Infrared Spectrograph (LIRIS) on the WHT, these observations showed a point source with in 0.6 seeing. A summary of the optical and near-infrared photometry data is presented in Table 2.
At this stage J0049+3510 was considered a good candidate for a quasar as the optical and near-infrared SED suggested the presence of a steep spectral break between the near-infrared and optical bands. This would correspond to the Gunn-Peterson trough, with the Ly line redshifted between the - and -bands. We therefore sought spectroscopy in order to determine the redshift and nature of this source.

2.4 Optical and near-infrared spectroscopy
Near-Infrared spectroscopy observations were performed with the UKIRT Imaging Spectrometer (UIST) using the standard ‘ABBA’ nodding sequence (with a nod of 12 arcsec) on the night of 2004-09-16. The total exposure time was 160 minutes and the data were reduced with oracdr. The spectrum was extracted over 1.2 arcsec (the pixel scale is ) with the iraf apextract packages. We identified a broad emission line at , first identified, in view of the optical and near-infrared SED, as the MgII line redshifted to . No other obvious lines were identified in the Spectrum, but continuum was present throughout the wavelength range. Figure 3 shows the extracted one-dimensional near-infrared spectrum of the quasar. The spectrum also shows tentative evidence for a second emission line at 1.74 m which we later confirmed to be the [Oiii] doublet at a redshift of , thus suggesting that the bright emission line may be H. If the redshift were indeed or , then we should be able to detect the Ly line with optical spectroscopy.
Optical spectroscopy was carried out with the Gemini Multi–Object Spectrograph (GMOS) on Gemini North. We used a 0.75 arcsec long slit with PA of 78 with a nodding of 10 arcsec. We selected the G150 grating centred at 750 nm for a total exposure time of 1200 s. The data was reduced with iraf and a spectrum was wavelength-, flux-calibrated and extracted over 1.5 arcsec (the spatial scale was ) with our own idl routines. The spectrum showed no lines but a very faint continuum roughly between 4800 and 8000 Å. The seeing, measured as the Full Width Half Maximum (FWHM) of a gaussian fit to the spatial profile of an unresolved object on the slit, was 1.3 arcsec.
2.5 The Ly Halo
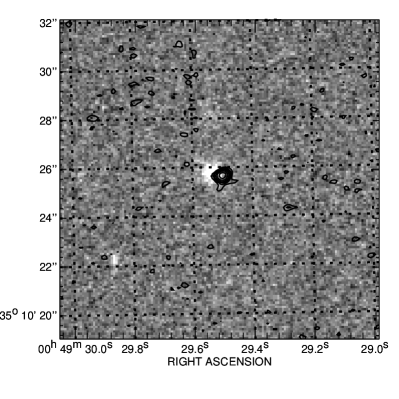
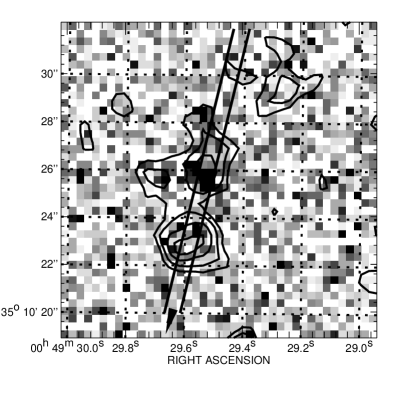
The quasar was observed using the Sloan Gunn () filter used with the Isaac Newton Telescope Wide-field camera (INT–WFC) for 1800 s during the night of 2003-12-13. The image showed extended diffuse structure to the south of the quasar position in addition to some emission co-spatial with the unresolved -band identification which we take to be dominated by line emission; we refer to these as the south and central blobs respectively. Figure 2 shows the -band image overlayed with the radio contours and also with the contours representing the -band image. There is also tentative evidence for further Ly emission towards the north of the source, which is much fainter than the central and southern components. However, we believe it to be part of the halo, although deeper observations are needed to confirm this.
Subsequent WHT–ISIS spectroscopy on 2004-12-09 targeted the brightest two (central and south) blobs using a 2 arcsec slit with position angle of east of north, with a total exposure time of 40 min. We used the R300B grating, giving a spectral resolution of Å. The ISIS spectra were reduced with iraf, wavelength calibrated with a CuAr+CuNe arc and flux calibrated using observations of the SP1942+261 standard star. The one-dimensional spectrum was extracted with the iraf apextract task for several different apertures.
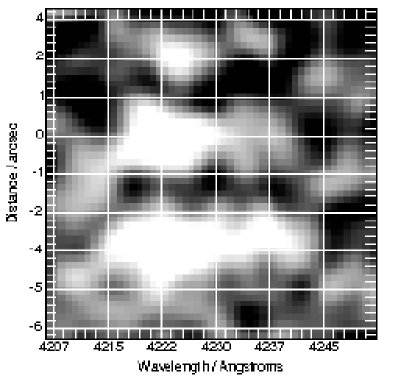
Figure 4 shows the two-dimensional spectrum, where three separate emissions lines can be identified, associated with the three blobs present in the -band image; together with one-dimensional spectra extracted from each blob. We find an emission line at 4222 Å in the central and southern blobs, which we identify as Ly, corresponding to a redshift of . No other lines (e.g. C iv, He ii, C iii, etc.) could be found associated with either blob. The combined flux from all of the Ly blobs, after correcting for the aperture and the edge of the filter, can account for 90% of the flux seen in the -band image. Furthermore, the spectrum taken with GMOS-N, where only the central blob is positioned on the slit, shows some faint continuum of the order 22; which corresponds to 30% of the contribution of the central blob.
This result is consistent with the -band emission line being H at ; and not Mgii as it was first thought. With this established, the tentative line in the spectrum is now confirmed as the [O iii]4959/5007 doublet at (Fig. 3). We, therefore, use the redshift determined form the [O iii]5007 line (i.e. z = 2.48), as the best estimate for the redshift of our source. We chose not to trust the redshift from the Ly line as this could be affected by absorption and thus its position is more uncertain, while the H line is likely to be contaminated with other emission lines, e.g. [Nii]. The emission line properties are summarised in Table 3.

| Line | / | FWHM/ | Line Flux |
|---|---|---|---|
| Å | km s-1 | W m-2 | |
| H | 22920 | % | |
| O iii | 17340,17423 | – | % |
| Ly (north) | 4224 | % | |
| Ly (central) | 4222 | % | |
| Ly (south) | 4222 | % |
The southern blob extends to arcsec ( kpc) from the central -band identification, with the overall extent of the Ly emission, including the northern component, spanning arcsec ( kpc), suggesting this object is embedded in a very extended Ly halo. The de-convolved velocity widths of the Ly lines extracted over the central and southern blob are very similar, with FWHM of and km s-1 (see Table 3). However, it is clear from Fig. 4 that there is evidence for a broader wing redward of the main Ly emission compared to the blue side, at least in the southern component and at lower signal-to-noise ratio, possibly due to dust obscuration associated with the host galaxy extinguishing the LyA line, in the central component. Broad red-wings are indicative of inflows/outflows and have been seen in superwind galaxies (e.g. Ajiki et al., 2002; Dawson et al., 2002; Saito et al., 2007). Alternatively, such a profile could also indicate the presence of a neutral hydrogen absorbing screen similar to those seen around radio galaxies of small projected linear size (e.g. van Ojik et al., 1997; Jarvis et al., 2003; Wilman et al., 2004; Binette et al., 2006). Our near-infrared spectroscopy does not have the requisite signal-to-noise ratio with which to determine the shape of the H line accurately. However, the fact that we see very little sign of a broadened red component in H leads us to suggest that the broadened red wing component, when compared to the blue side, is due to associated absorption in the blue wing of the Ly emission.
To summarise, J004929.4+351025.7 is a radio-loud GPS source at , reasonably bright in , and but invisible in both and down to limiting magnitudes of and . It has a broad H emission line with a very weak [O iii], and it lies within Ly emitting halo.
3 Discussion
3.1 Origin of the Ly halo
The radio SED of J0049+3510 (Fig. 1) shows that it is a powerful (L W Hz-1 sr-1) GPS radio source with a rest-frame peak at GHz. Using equation 1 of O’Dea (1998) to estimate the electron lifetime of a typical GPS source we find that J0049+3510 is probably a very young radio source, viewed after the jet-triggering event. We can also use the strong anti-correlation between the turnover frequency and the projected linear size of the source (e.g. Fanti et al., 1990) to estimate the linear size of the radio emission in J0049+3510. Using equation 4 in O’Dea (1998), for a rest-frame turnover frequency of 4.2 GHz, we find that the projected linear size would be , which is consistent with jet hotspots advancing at (as it has been measured in compact symetric radio sources; Owsianik & Conway, 1998) for . The inferred limit on the size is also consistent (at ) with the arcsec limiting spatial resolution of the 8.4 GHz radio observations.
If we were to consider a model in which accretion activity, and hence the optical quasar nucleus, was triggered at the same time as the radio jet; then the ionising photons could have reached no further than arcsec from the nucleus and, as such, the quasar nucleus would have not be able to ionise the Ly halo that we observe. Thus, if we expect the Ly halo to be ionised by the central AGN, a longer living source of ionising photons (e.g. a pre-existing accreting super-massive black hole and/or a starburst) would be required to explain the presence of Ly emission 40 kpc from the nucleus. Indeed, it would take a minimum of years for the photons to reach the furthermost parts of the Ly halo. This is shorter than the expected duty cycle of a typical AGN lifetime (e.g. Martini & Schneider, 2003), thus the Ly halo could easily be photoionised by an obscured quasar, in place before the current jet activity was triggered.
3.2 Estimating the extinction
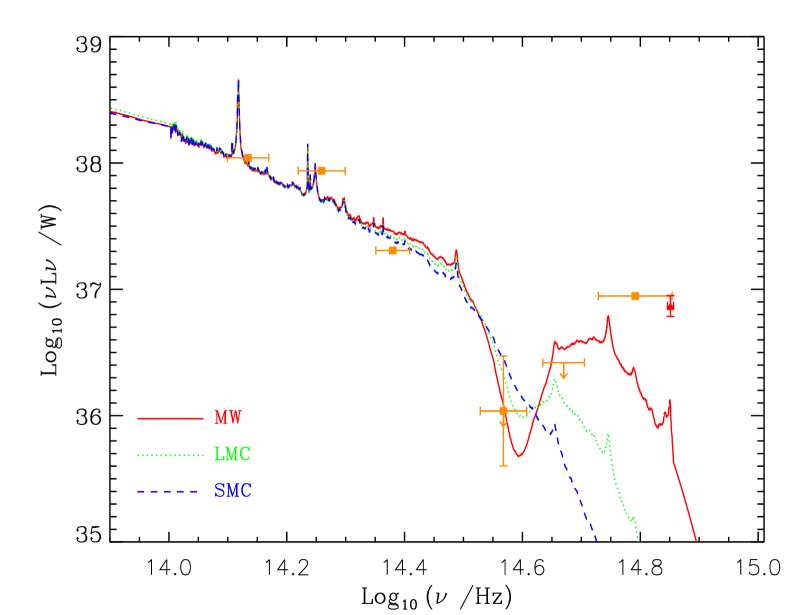
In order to investigate the reddening of the optical and near-infrared SED, we have used a simple -fitting technique to estimate the amount of extinction. We used the SDSS composite quasar template (Vanden Berk et al., 2001) combined with the AGN spectral energy distribution from Elvis et al. (1994). To this, we applied extinction corrections for three different types of dust (Milky Way MW, Large Magellanic Cloud LMC, and Small Magellanic Cloud SMC) as in Pei (1992). We have neglected any contribution from a host galaxy principally because any such component would peak in the observed-frame SED around band, where the emission is spatially unresolved, and secondly the host would have to be unreasonably massive (, corresponding to a elliptical after accounting for passive evolution) to contribute even at the level. Furthermore, the – relation for a typical radio galaxy at predicts a magnitude of (Jarvis et al., 2001; Willott et al., 2003), 1.5 mag fainter than our source.
For the fitting we used our three near infrared photometry points plus the band non-detection, which was included, following Martínez-Sansigre et al. (2006), by assigning a flux density and an error both equal to half the flux density limit (so ). The best fits for the quasar extinction are shown in Figure 5. They are almost independent of dust type and yield values for the rest-frame extinction of . The marginalised probability for the extinction parameter for the 3 different types of dust is: Av for MW and LMC and Av for SMC.
The Ly/H line ratio might give extra information on extinction on this object. However, as discussed in Eales & Rawlings (1993) it is not easy to obtain a reliable intrinsic extinction value because of the effects of resonant scattering of Ly. Therefore, we will only use this line ratio as an independent verification of our fitting results. The line ratio measured from the central blob is 1.8; similar to those found in high–redshift radio galaxies (HzRG) by Eales & Rawlings (1993). Moreover, if we assume an intrinsic Ly/H=8 line ratio and apply an extinction of Av=3 with a MW type dust, the Ly/H line ratio we should observe is 1.9, indicating that our fitting suggests a similar extinction to the optical continuum of the quasar and the narrow emission lines. We note that this level of reddening could be due to the edge of an obscuring torus, or could be due to dust in the host galaxy, although the latter is preferred as the narrow lines too appear to be reddened.
It is also plausible that the large diffuse line emission could be caused by gas cooling on to the dark matter halo of the galaxy (e.g. Fardal et al., 2001; Dijkstra et al., 2006; Nilsson et al., 2006; Smith & Jarvis, 2007; Smith et al., 2008). However, the distribution of the ionised gas suggests a loosely biconical ionisation front, as would be expected from a central AGN, with an obscuring torus where the ionising photons can only escape through the opening angle of the dusty torus. This biconical structure is seen in other radio galaxies, and most convincingly in Cygnus A (Tadhunter et al., 2003). This spatial distribution could also, in principle, be caused by a large halo of absorbing gas around the galaxy as seen in many radio galaxies with small angular sizes (e.g. van Ojik et al., 1997; Jarvis et al., 2003; Wilman et al., 2004; Jarvis et al., 2001). However, evidence suggests that such haloes may be roughly spherical in nature (Jarvis et al., 2003), and thus do not have a preferred orientation, although such gas may account for the observed broader redward component in the Ly emission-line profile. Furthermore, there is no evidence of any other extended emission around the central source apart from in the biconical direction shown in Fig. 2.
4 Conclusions
During our search for radio-loud quasars we have discovered an obscured quasar at embedded in a large Ly halo. The ionising source of the large-scale Ly halo is most likely to be the central AGN, with a dusty torus or a dusty galaxy obscuring the AGN along our line-of-sight. The dusty torus would also explain the structure of the Ly emission-line halo, with the ionising photons essentially being forced into a biconical distribution according to the opening angle of the torus.
Using the peak of the radio spectral energy distribution to estimate the age of the radio jet, we find that the radio source has been active for years. assuming a jet speed of . This implies that the accretion activity must have started prior to the radio-jet triggering event, suggesting that the triggering mechanism for the optical quasar is different, or at least not coincident in time with, the triggering of the radio jet.
Further work on J0049+3510, including integral field spectroscopy, will allow us to map the emission line profiles across the halo and examine the nature of the ionised gas. Higher-resolution radio observations would also allow us to test whether the ionising photons are being emitted in the same direction as the young radio-jet.
Completion of the follow-up for the rest of the ‘red’ candidates quasars will quantify how common these type of sources are, and hopefully find some genuine radio-loud quasars.
acknowledgments
FEBM was funded by sisco research training network part of European Commission’s 5th Framework Improving Human Potential programme. MJJ is supported by a Research Council UK fellowship. The work of SC was performed under the auspices of the U.S Department of Energy by the University of California, Lawrence Livermore National Laboratory under contract No.W-7405-ENG-48. SC acknowledges support for radio galaxy studies at UC Merced, including the work reported here, with the Hubble Space Telescope and Spitzer Space Telescope via NASA grants HST #10127, SST #1264353, SST #1265551, and SST #1279182. AM acknowledges support from grant AYA 20043136 from the Spanish Ministerio de Educación y Ciencia. The United Kingdom Infrared Telescope is operated by the Joint Astronomy Centre on behalf of the Science and Technology Facilities Council of the U.K, some of the data reported here were obtained as part of the UKIRT Service Programme. The William Herschel Telescope and the Isaac Newton Telescopes are operated on the island of La Palma by the Isaac Newton Group in the Spanish Observatorio del Roque de los Muchachos of the Instituto de Astrof sica de Canarias. The Digitized Sky Surveys were produced at the Space Telescope Science Institute under U.S. Government grant NAG W-2166. The images of these surveys are based on photographic data obtained using the Oschin Schmidt Telescope on Palomar Mountain and the UK Schmidt Telescope. The plates were processed into the present compressed digital form with the permission of these institutions. Based on observations obtained at the Gemini Observatory, which is operated by the Association of Universities for Research in Astronomy, Inc., under a cooperative agreement with the NSF on behalf of the Gemini partnership: the National Science Foundation (United States), the Science and Technology Facilities Council (United Kingdom), the National Research Council (Canada), CONICYT (Chile), the Australian Research Council (Australia), Minist rio da Ci ncia e Tecnologia (Brazil) and SECYT (Argentina).
References
- Ajiki et al. (2002) Ajiki, M., et al. 2002, ApJL, 576, L25
- Becker et al. (1995) Becker, R. H., White, R. L., & Helfand, D. J. 1995, ApJ, 450, 559
- Binette et al. (2006) Binette, L., Wilman, R. J., Villar-Martín, M., Fosbury, R. A. E., Jarvis, M. J., Röttgering, H. J. A. 2006, A&A, 459, 31
- Bower et al. (2004) Bower, R. G., Morris, S. L., Bacon, R., Wilman, R. J., Sullivan, M., Chapman, S., Davies, R. L., de Zeeuw, P. T., & Emsellem, E. 2004, MNRAS, 351, 63
- Antonucci (1993) Antonucci, R. 1993, ARA&A, 31, 473
- Chambers et al. (1988) Chambers, K. C., Miley, G. K., & van Breugel, W. J. M. 1988, ApJL, 327, L47
- Chapman et al. (2004) Chapman, S. C., Scott, D., Windhorst, R. A., Frayer, D. T., Borys, C., Lewis, G. F., & Ivison, R. J. 2004, ApJ, 606, 85
- Cohen et al. (2007) Cohen, A. S., Lane, W. M., Cotton, W. D., Kassim, N. E., Lazio, T. J. W., Perley, R. A., Condon, J. J., & Erickson, W. C. 2007, ArXiv e-prints, 706, arXiv:0706.1191
- Condon et al. (1998) Condon, J. J., Cotton, W. D., Greisen, E. W., Yin, Q. F., Perley, R. A., Taylor, G. B., & Broderick, J. J. 1998, AJ, 115, 1693
- Dawson et al. (2002) Dawson, S., Spinrad, H., Stern, D., Dey, A., van Breugel, W., de Vries, W., & Reuland, M. 2002, ApJ, 570, 92
- Dijkstra et al. (2006) Dijkstra, M., Haiman, Z., & Spaans, M. 2006, ApJ, 649, 14
- Dunlop & Peacock (1990) Dunlop, J. S. & Peacock, J. A. 1990, MNRAS, 247, 19
- Eales & Rawlings (1993) Eales, S. A. & Rawlings, S. 1993, ApJ, 411, 67
- Eales & Rawlings (1996) —. 1996, ApJ, 460, 68
- Elvis et al. (1994) Elvis, Wilkes, McDowell, Green, Bechtold, Willner, Oey, Polomski, & Cutri 1994, ApJS, 95, 1
- Fanti et al. (1990) Fanti, R. and Fanti, C. and Schilizzi, R. T. and Spencer, R. E. andNan Rendong and Parma, P. and van Breugel, W. J. M. and Venturi, T., 1990, A&A, 231, 333-346
- Fardal et al. (2001) Fardal, M. A., Katz, N., Gardner, J. P., Hernquist, L., Weinberg, D. H., & Davé, R. 2001, ApJ, 562, 605
- Geach et al. (2005) Geach, J. E., et al. 2005, MNRAS, 363, 1398
- Glikman et al. (2007) Glikman, E. and Helfand, D. J. and White, R. L. and Becker, R. H. and Gregg, M. D. and Lacy, M., 2007, ApJ, 667, 673-703
- Gregory et al. (1996) Gregory, P. C., Scott, W. K., Douglas, K., & Condon, J. J. 1996, ApJS, 103, 427
- Gunn & Peterson (1965) Gunn, J. E. & Peterson, B. A. 1965, ApJ, 142, 1633
- Haiman & Rees (2001) Haiman, Z., & Rees, M. J. 2001, ApJ, 556, 87
- Hales et al. (1993) Hales, S. E. G., Masson, C. R., Warner, P. J., Baldwin, J. E., & Green, D. A. 1993, MNRAS, 262, 1057
- Jarvis et al. (2001) Jarvis, M. J. and Rawlings, S. and Eales, S. and Blundell, K. M. and Willott, C. J. 2001, in QSO Hosts and Their Environments, 333–+
- Jarvis et al. (2001) Jarvis, M. J. and Rawlings, S. and Lacy, M. and Blundell, K. M. and Bunker, A. J. and Eales, S. and Saunders, R. and Spinrad, H. and Stern, D. and Willott, C. J. 2001, MNRAS, 326, 1563-1584
- Jarvis et al. (2003) Jarvis, M. J., Wilman, R. J., Röttgering, H. J. A., & Binette, L. 2003, MNRAS, 338, 263
- Jarvis et al. (2004) Jarvis, M., Rawlings, S., Barrio, F., Hill, G., Bauer, A., & Croft, S. 2004, in ASP Conf. Ser. 311: AGN Physics with the Sloan Digital Sky Survey, 361–+
- Martínez-Sansigre et al. (2006) Martínez-Sansigre, A., Rawlings, S., Lacy, M., Fadda, D., Jarvis, M. J., Marleau, F. R., Simpson, C., & Willott, C. J. 2006, MNRAS, 370, 1479
- Martini & Schneider (2003) Martini, P., & Schneider, D. P. 2003, ApJL, 597, L109
- Nilsson et al. (2006) Nilsson, K. K., Fynbo, J. P. U., Møller, P., Sommer-Larsen, J., & Ledoux, C. 2006, A&A, 452, L23
- O’Dea (1998) O’Dea, C. P. 1998, PASP, 110, 493
- Ohyama et al. (2003) Ohyama, Y., et al. 2003, ApJL, 591, L9
- Owsianik & Conway (1998) Owsianik, I. & Conway, J. E. 1998, A&A, 337, 69
- Pei (1992) Pei, Y. C. 1992, ApJ, 395, 130
- Rengelink et al. (1997) Rengelink, R. B., Tang, Y., de Bruyn, A. G., Miley, G. K., Bremer, M. N., Röttgering, H. J. A., & Bremer, M. A. R. 1997, A&AS, 124, 259
- Reuland et al. (2003) Reuland, M., van Breugel, W., Röttgering, H., de Vries, W., Stanford, S. A., Dey, A., Lacy, M., Bland-Hawthorn, J., Dopita, M., & Miley, G. 2003, ApJ, 592, 755
- Richards et al. (2003) Richards, G. T. and Hall, P. B. and Vanden Berk, D. E. and Strauss, M. A. and Schneider, D. P. and Weinstein, M. A. and Reichard, T. A. and York, D. G. and Knapp, G. R. and Fan, X. and Ivezić, Ž. and Brinkmann, J. and Budavári, T. and Csabai, I. and Nichol, R. C., 2003, AJ, 126, 1131-1147
- Richards et al. (2004) Richards, G. T. and Nichol, R. C. and Gray, A. G. and Brunner, R. J. and Lupton, R. H. and Vanden Berk, D. E. and Chong, S. S. and Weinstein, M. A. and Schneider, D. P. and Anderson, S. F. and Munn, J. A. and Harris, H. C. and Strauss, M. A. and Fan, X. and Gunn, J. E. and Ivezić, Ž. and York, D. G. and Brinkmann, J. and Moore, A. W., 2004, ApJS, 155, 257-269
- Saito et al. (2007) Saito, T., Shimasaku, K., Okamura, S., Ouchi, M., Akiyama, M., Yoshida, M., & Ueda, Y. 2007, ArXiv e-prints, 705, arXiv:0705.1494
- Schneider et al. (2003) Schneider, D. P. and Fan, X. and Hall, P. B. and Jester, S. and Richards, G. T. and Stoughton, C. and Strauss, M. A. and SubbaRao, M. and Vanden Berk, D. E. and Anderson, S. F. and Brandt, W. N. and Gunn, J. E. and Gray, J. and Trump, J. R. and Voges, W. and Yanny, B. and Bahcall, N. A. and Blanton, M. R. and Boroski, W. N. and Brinkmann, J. and Brunner, R. and Burles, S. and Castander, F. J. and Doi, M. and Eisenstein, D. and Frieman, J. A. and Fukugita, M. and Heckman, T. M. and Hennessy, G. S. and Ivezić, Ž. and Kent, S. and Knapp, G. R. and Lamb, D. Q. and Lee, B. C. and Loveday, J. and Lupton, R. H. and Margon, B. and Meiksin, A. and Munn, J. A. and Newberg, H. J. and Nichol, R. C. and Niederste-Ostholt, M. and Pier, J. R. and Richmond, M. W. and Rockosi, C. M. and Saxe, D. H. and Schlegel, D. J. and Szalay, A. S. and Thakar, A. R. and Uomoto, A. and York, D. G., 2003, AJ, 126, 2579-2593
- Smith & Jarvis (2007) Smith, D. J. B., & Jarvis, M. J. 2007, ArXiv Astrophysics e-prints, arXiv:astro-ph/0703522
- Smith et al. (2008) Smith D.J.B, Jarvis M.J., Lacy M., Martinez-Sansigre A., 2008, MNRAS, submitted
- Steidel et al. (2000) Steidel, C. C., Adelberger, K. L., Shapley, A. E., Pettini, M., Dickinson, M., & Giavalisco, M. 2000, ApJ, 532, 170
- Tadhunter et al. (2003) Tadhunter, C., Marconi, A., Axon, D., Wills, K., Robinson, T. G., & Jackson, N. 2003, MNRAS, 342, 861
- Urry & Padovani (1995) Urry, C. M. and Padovani, P., 1995, PASP, 107, 803-+
- Vanden Berk et al. (2001) Vanden Berk, Richards, Bauer, Strauss, Schneider, Heckman, York, Hall, Fan, Knapp, Anderson, Annis, Bahcall, Bernardi, Briggs, Brinkmann, Brunner, Burles, Carey, Castander, Connolly, Crocker, Csabai, Doi, Finkbeiner, Friedman, Frieman, Fukugita, Gunn, Hennessy, Ivezić, Kent, Kunszt, Lamb, Leger, Long, Loveday, Lupton, Meiksin, Merelli, Munn, Newberg, Newcomb, Nichol, Owen, Pier, Pope, Rockosi, Schlegel, Siegmund, Smee, Snir, Stoughton, Stubbs, SubbaRao, Szalay, Szokoly, Tremonti, Uomoto, Waddell, Yanny, & Zheng 2001, AJ, 122, 549
- Owsianik & Conway (1998) wsianik, I. & Conway, J.E. 1998, A&A, 337, 69
- van Ojik et al. (1997) van Ojik, R., Röttgering, H. J. A., Miley, G. K., & Hunstead, R. W. 1997, A&A, 317, 358
- Villar-Martín et al. (2002) Villar-Martín, M., Vernet, J., di Serego Alighieri, S., Fosbury, R., Pentericci, L., Cohen, M., Goodrich, R., & Humphrey, A. 2002, MNRAS, 336, 436
- Webster et al. (1995) Webster, R. L. and Francis, P. J. and Peterson, B. A. and Drinkwater, M. J. and Masci, F. J. 1995, Nature, 375, 469-+
- Weidinger et al. (2005) Weidinger, M., Møller, P., Fynbo, J. P. U., & Thomsen, B. 2005, A&A, 436, 825
- Willott et al. (2003) Willott, C. J. and Rawlings, S. and Jarvis, M. J. and Blundell, K. M. 2003, MNRAS, 339, 173
- Whiting et al. (2001) Whiting, M. T., Webster, R. L., & Francis, P. J. 2001, MNRAS, 323, 718
- Wilman et al. (2004) Wilman, R. J., Jarvis, M. J., Röttgering, H. J. A., & Binette, L. 2004, MNRAS, 351, 1109
- Wilman et al. (2005) Wilman, R. J., Gerssen, J., Bower, R. G., Morris, S. L., Bacon, R., de Zeeuw, P. T., & Davies, R. L. 2005, Nature, 436, 227