GROUND-BASED OPTICAL AND SPITZER INFRARED IMAGING OBSERVATIONS OF COMET 21P/GIACOBINI-ZINNER
Abstract
We present ground-based optical and Spitzer Space Telescope infrared imaging observations of the ecliptic (Jupiter-family) comet 21P/Giacobini-Zinner, the parent body of the Draconid meteor stream, during its 2005 apparition. Onset of nucleus activity occurred at a pre-perihelion heliocentric distance, AU, while post-perihelion 21P was dusty (peak cm-1) and active out to heliocentric distances AU following a logarithmic slope with of . Coma colors, are redder than solar, yet comparable to colors derived for other Jupiter-family comets. A nucleus radius of km is derived from photometry at quiescence. Spitzer images post-perihelion exhibit an extensive coma with a prominent dust tail, where excess emission (over the dust continuum) in the 4.5 µm IRAC image arises from volatile gaseous CO and/or CO2. No dust trail was detected ( surface brightness upper-limit of 0.3 MJy sr-1 pixel-1) along the projected velocity vector of comet 21P in the MIPS 24 µm image suggesting that the number density of trail particles is m-3. The bolometric albedo of 21P derived from the contemporaneous optical and Spitzer observations is , slightly lower than values derived for other comets at the same phase angle.
1 INTRODUCTION
Comet nuclei formed beyond the protoplanetary disk frost line (heliocentric distances, 5 AU; Lunine & Gautier, 2004), among the giant planets and were scattered into the Kuiper Belt and beyond into the Oort Cloud (OC). Since their formation, the interiors and surfaces of most comets have remained at temperatures below 140 K while in “cold storage” in the Kuiper Belt or the OC (Meech & Svoreň, 2004). Moreover, most nucleus surfaces have remained below 400 K even during perihelion passage. At such low temperatures, dust mineralogy remains stable and each comet nucleus retains a record of the minerals, ices, and volatiles extant in the comet agglomeration zones in the early solar system. Furthermore, comet nuclei may retain their primordial compositional inhomogeneities so that different topographic regions would have different compositions (e.g., Dello Russo et al., 2007), leading to variations in volatile production rates as a function of nucleus rotation. Nucleus heterogeneities are apparent in the fly-by imagery of ecliptic comet 9P/Tempel 1. Regions of distinct topography (Belton et al., 2007), and spatially distinct sites of water and CO2 release (Feaga et al., 2007; A’Hearn et al., 2005) are evident, as well as heterogeneities in surface and subsurface composition (Harker et al., 2007; Kadono et al., 2007).
There are two general dynamical families of comets, classified by derived orbital elements (i.e., Tisserand parameter, ) based on current observations. Nearly-isotropic comets (NICs; ) have orbits that are approximately uniformly distributed in inclination, and are derived from the OC. Ecliptic comets (EC) have orbits that are confined to inclinations near the ecliptic plane, , and originate in the Kuiper Belt. Resulting from frequent perihelion passage over the 4.0 – 4.5 Gyr period since their formation, EC comets have become noticeably less active than OC comets, characterized by lower gas and dust production rates. Multi-epoch spectral energy distributions (SEDs) of ECs, from which comae dust properties can be constrained, are needed to assess the possible interrelationships between their reduced activity levels and dust properties.
The study of the physical properties of cometary nuclei and comae both are equally important to our understanding of the outer solar system environment during the era of icy planetesimal formation, and complement efforts to discern conditions extant in early protoplanetary disks during the epoch of planetesimal formation. We present new optical and contemporaneous Spitzer observations of comet 21P/Giacobini-Zinner obtained during its 2005 apparition obtained as part of a larger survey of both ECs and NICs (e.g., Kelley et al., 2006). Ground-based optical observations enabled us to obtain precise optical photometry to asses variations in dust productivity with heliocentric distance and to study the the comet’s near-nucleus structures, including its jets and coma. Spitzer images at mid-infrared wavelengths enable the study of the spatial distributions of volatiles and dust in the coma, as well as facilitating investigation of comet trail properties. We describe our observations in §2, and discuss analysis of our optical and infrared (IR) observations in §3, while our conclusions are summarized in §4.
2 OBSERVATIONS AND REDUCTION
Comet 21P/Giacobini-Zinner was discovered by the French astronomer Michel Giacobini in 1900 and rediscovered two apparitions later, in 1913, by the German astronomer Ernst Zinner. 21P, the parent body of the Draconids (also know as the Giacobinids) meteor shower (Beech, 1986), is a Jupiter-family (i.e., EC with a short-period) comet with an orbital period of 6.61 years and an aphelion distance just exterior to Jupiter’s orbit. In 1933 a spectacular Giacobini meteor storm was visible across Europe. The 1946 apparition of 21P was especially noteworthy as the comet passed only 0.26 AU from Earth in late September with a visible magnitude . In early October, an unexpected outburst of activity caused the comet to brighten to sixth magnitude. Every alternate apparition of comet 21P presents favorable observing geometries for observers on Earth, with integrated coma visual magnitudes as high as 7. 21P was also the first comet visited by a spacecraft when the International Cometary Explorer (ICE) flew past at distance of 7,800 km on 1985 September 11 (Brandt et al., 1988).
2.1 Ground-based Optical
Optical images of comet 21P/Giacobini-Zinner were obtained on the University of Hawai‘i (UH) 2.2 m telescope on Mauna Kea, using a Tektronix CCD camera at the focus of the telescope (image scale of 0.219″ pixel-1) through a Kron-Cousins filters set (: Å, = 836Å; : Å, = 1245Å; : Å, = 1888Å), during multiple observing runs from 2004 June, 2005 October and December, and 2006 March. The camera read-noise was 6.0 with a gain of 1.74 per ADU. Non-sidereal guiding at the cometary rates of motion, derived from the JPL/Horizons ephemeris, was used during all image observations. Specific observational details, including orbital geometry for 21P, filters, number of exposures, individual exposure times, and sky conditions are summarized in Table 1.
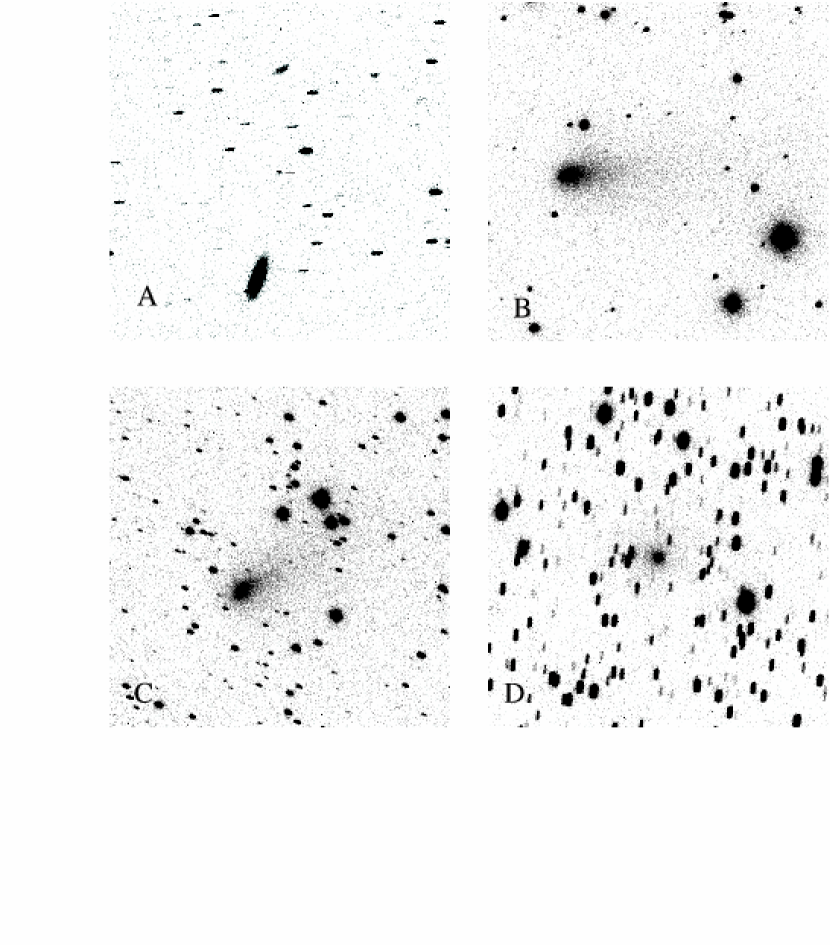
The optical CCD frames were reduced with standard IRAF111IRAF is distributed by the National Optical Astronomy Observatory, which is operated by the Association of Universities for Research in Astronomy (AURA) under cooperative agreement with the National Science Foundation. routines. All the images were reduced using flat field images taken during the evening and morning twilight sky and cleaned of bad pixels and cosmic rays. The frames were calibrated with the standard stars of Landolt (1992), which were observed on each photometric night. Observations of typically 20 standard stars were obtained over a range of air-masses, and with a wide dispersion of color to fit for both extinction and color terms. Apparent magnitudes of twenty to thirty stars field stars of equal or greater brightness to the comet on each frame were measured in order to do relative photometry. After correcting the measured magnitudes for extinction, we used the deviations of the field star magnitudes in each frame from their nightly average values to correct for frame-to-frame extinction in the comet’s measured signal. Figure 1 shows selected individual optical images for each ground-based observing run.
2.2 Spitzer Imaging
We observed comet 21P with the Infrared Array Camera (IRAC; Fazio et al., 2004) and the Multiband Imaging Photometer for Spitzer (MIPS; Rieke et al., 2004) on the Spitzer Space Telescope (Werner et al., 2004), post-perihelion as summarized in Table 1. The MIPS astronomical observation request (AOR) used the 24 µm array in mapping mode to assess the existence of the comet’s dust trail (AOR key 0015734784 (catalog ADS/Sa.Spitzer#0015734784), map). A duplicate MIPS observation was taken 25 hr later to observe the sky background after the comet had moved out of the frame (AOR key 0015734528 (catalog ADS/Sa.Spitzer#0015734528)). The IRAC AOR utilized the 4.5 and 8.0 µm arrays to obtain complementary deep photometry of the coma (AOR key 0013820160 (catalog ADS/Sa.Spitzer#0013820160), map).
The IRAC and MIPS observations were calibrated with Spitzer pipelines S13.2.0 and S13.0.1, respectively. The images were mosaicked in the rest frame of the comet with the MOPEX software (Makovoz & Kahn, 2005) at the native IRAC and MIPS pixel scales (1.22″ pixel-1 for IRAC, 2.5″ pixel-1 for MIPS 24 µm). The MIPS background observation was mosaicked with the same size, scale, and orientation as the primary observation, then subtracted from the primary. Before mosaicking, all images were masked to remove cosmic rays and bad pixels. No additional corrections were necessary.
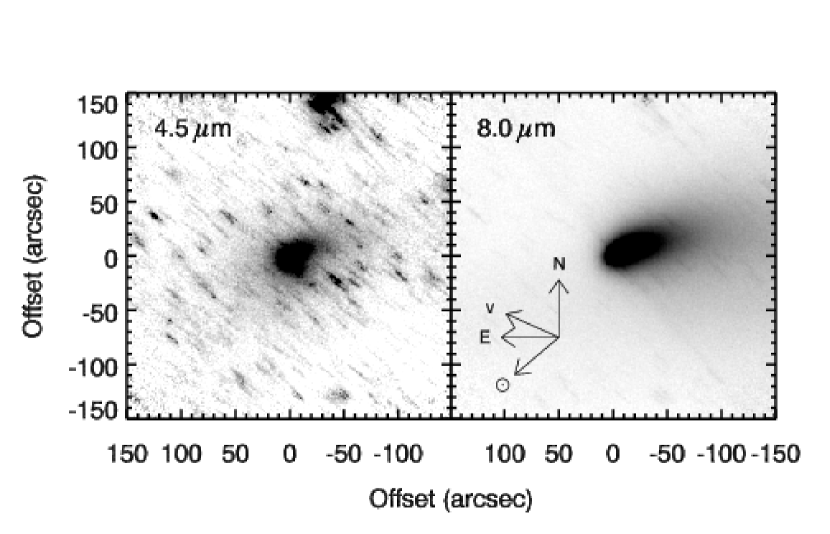
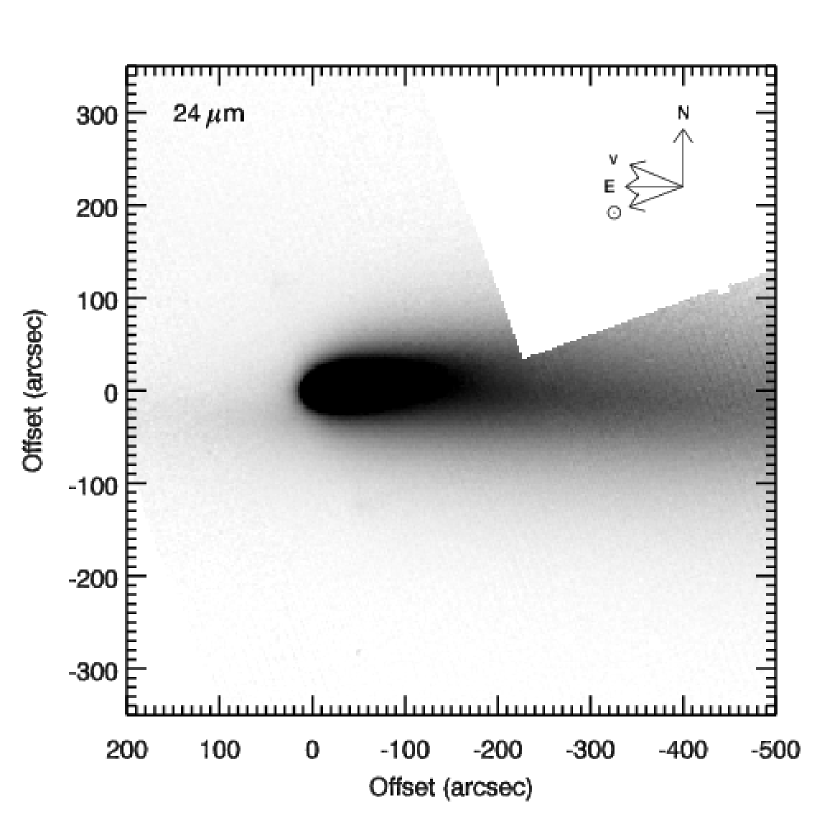
Our IRAC image of comet 21P was obtained at a post-perihelion distance of AU. Analysis of the secular optical light curves of 21P by Ferrín (2005) suggests that the nucleus turn-on time (marking the onset of steady coma activity) occurs pre-perihelion near 3.7 AU, whereas onset of nucleus turn-off may not occur until 21P reaches 5.4 AU. Indeed Tancredi et al. (2000) argue that 21P is active at 4.5 AU. The IRAC 4.5 µm image, Fig. 2, shows an extended coma surrounding the nucleus. Discussion of this extended emission is presented in §3.7. The Spitzer MIPS 24 µm image is presented in Fig. 3.
3 DISCUSSION
3.1 Optical Photometry
The photometry derived from our optical images enable investigation of cometary activity with heliocentric distance, estimation of dust production rates (; A’Hearn et al., 1984), determination of the coma color, and construction of rotational light curves.
The stellar and comet fluxes were extracted from the optical CCD frames using the IRAF photometry routine “PHOT” with a circular aperture. This routine automatically finds the centroid of the image within the user-specified photometry aperture, with the sky background determined in an annulus lying immediately outside the photometry aperture (for stellar images), or selected from an average of many sky positions outside the extent of any coma. Photometric apertures between 1″– 5″ were used for the comet photometry with the average sky background determined using sky annuli with an inner radii of 8.0″ – 10″, with widths of 4.0″ – 5.0″. Averaging many sky background positions adjacent to the comet also enabled rejection of any bad pixels or field stars found in individual sky annuli circumscribing the aperture used to determine the comet surface brightness. The smallest possible aperture that minimized contamination from extended surface brightness of the coma while including most of the flux from the nucleus (with respect to the full-width half-maximum seeing determined from stellar point sources on the frame) was 3″. A 4″ aperture was also used for the field stars used for differential photometry. After correcting the measured magnitudes for extinction, we used the deviations of the field stars from their nightly average magnitudes in each frame to correct for frame-to-frame extinction variations in the comet’s measured signal.
For the non-photometric data (Table 1) from the nights of 2004 June 21 and 22, and 2006 March 05, the comet fields were re-imaged under photometric conditions on 2005 May 18 and 2006 June 03 for “boot-strap” calibration. Multiple () field stars were measured on both the calibration images and the non-photometric images and differential photometry was used to compute the photometrically-calibrated brightness of the comet. This technique works well for up to mag of extinction.
3.2 Heliocentric Activity
The most direct indicator of nucleus activity is the appearance of visible coma around a comet nucleus. Our first observations of 21P (Fig. 1a) were obtained on 2004 June ( days before perihelion) when the comet was at a large heliocentric distance, AU. No coma was evident on individual images, nor on the composite image created by mosaicking the 2 to 3 images obtained on each night to increase the signal-to-noise ratio of any diffuse coma emission. Absence of a detectable coma days before perihelion is consistent with 1991 apparition observations of Mueller (1992) who found no coma at days before perihelion, yet a clearly detectable coma at days. Our observations indicate that the heliocentric turn-on point for 21P nucleus activity this apparition was similar to the behavior observed in the 1991.
The average -band magnitude measured for 21P on a given night are summarized in Table 2, column [3], as is the reduced magnitude, column [6]. The reduced magnitude, , i.e., the observed magnitude normalized to unit heliocentric distance, , and geocentric distance, , for zero phase angle, , was derived from the relationship for active comets
| (1) |
where is the -band photometric magnitude measured in a 3″ circular aperture, the linear phase coefficient = 0.035 mag deg-1, and and are constants, taken to be unity and 2 respectively. Nominally, values for these two latter constants ( being dependent on dust grain production, coma shape and size) are derived from modeling a given comet at a variety of heliocentric distances if there are sufficient observational data. Equation 1 also is appropriate for expressing the brightness of an active comet with a spherical coma around the nucleus (measured in a circular aperture, as described by Meech & Svoreň, 2004), as opposed to the relation used by Ferrín (2005) which is the proscription for the brightness of bare nuclei (non-active stage). Computation of the reduced magnitude is a standard method that enables of photometric data of an individual comet obtained at a variety of heliocentric distances (different activity level) to be intercompared. For 21P, we obtained observations of the comet when there was no visible coma, when the comet exhibited a small coma around the nucleus, and when the comet was highly active displaying a significant, spatially extended coma with an elongated tail. To properly intercompare variations in the integrated aperture surface brightness, the -band photometric magnitudes were determined by measuring the comet’s brightness in a small 3″ circular aperture centered on the nucleus. Use of this small nucleo-centric aperture minimized the coma contribution to the measured flux density, and allowed estimation of the nucleus brightness consistent with the uniform azimuthally-averaged surface brightness profile.
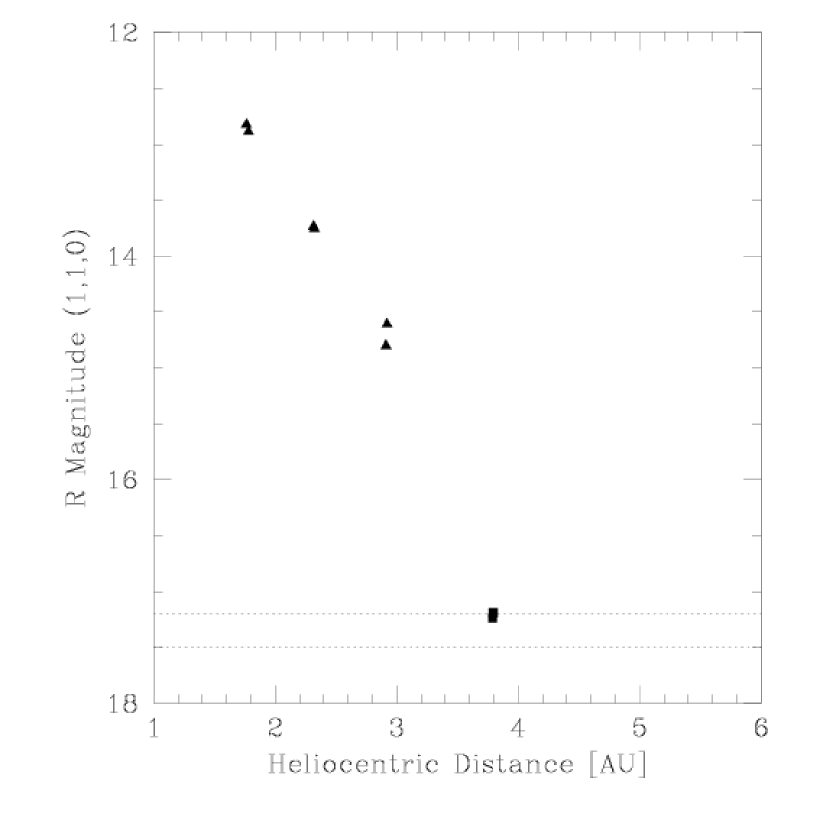
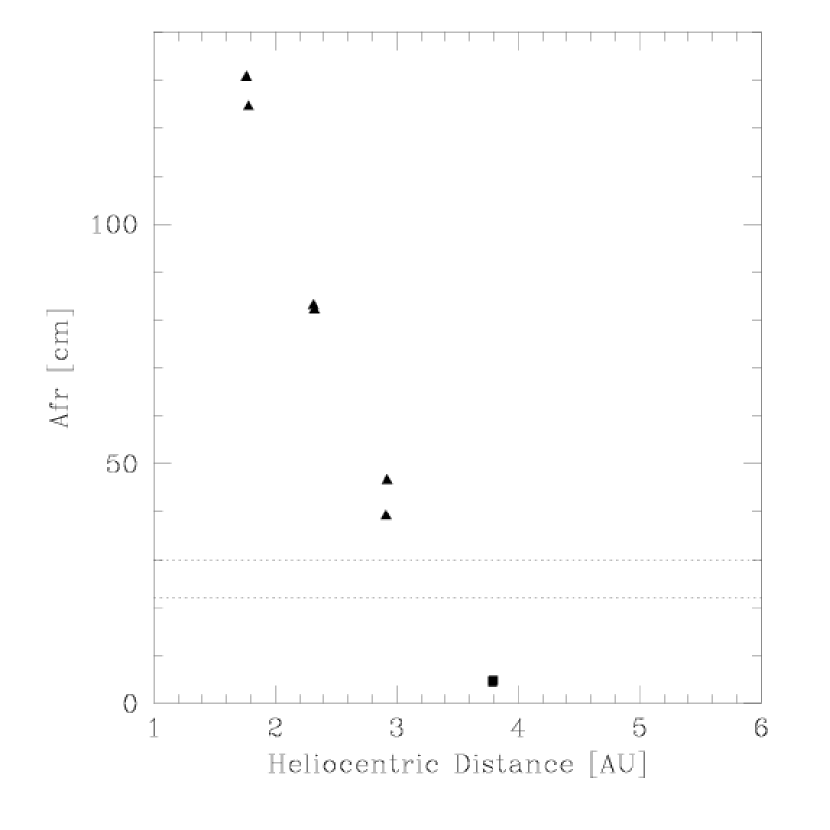
Our observations of 21P span a range of heliocentric distance, both pre- and post-perihelion (Table 1), thus we can examine trends in with . Figure 4 shows the variation in the reduced magnitude as a function of derived from -band photometry, where the dotted horizontal lines represent the likely brightness range for a bare nucleus, calculated from our photometry data when no coma was seen. Evidently, cometary activity commenced near AU this apparition of 21P, and the majority of our optical observations and all of our Spitzer images were obtained while the comet was in an active state.
3.3 Coma Colors
Average coma color differences (, ) are also listed in Table 2 for dates when multi-wavelength observations were conducted. The average colors of comet 21P, , are redder than the respective solar colors, 0.36 and 0.28, in the Krons-Cousins system, transforming the Johnson solar colors (Allen, 1973) using the relation of Fernie (1983). Band emission from gaseous molecular species, such as C2 (Å), NH2 (Å), and CN (Å), or atomic O I ( Å 1D) potentially could contribute significantly to the flux density of comet comae observed within our broadband filters. However, optical spectra of Fink & Hicks (1996) indicates that band and line emission from these species is relatively weak in the coma of 21P.
21P also lies along the versus color-color trend line of Jupiter-family comet nuclei attributed by Snodgrass et al. (2005) to albedo variation (in § 3.5 we derive an dust albedo estimate for 21P), although we cannot quote a precise value for the nucleus color of 21P due to coma contamination. Broad-band colors of cometary nuclei are related to surface properties of the nucleus (Davidsson & Skorov, 2002) and provide a metric to compare cometary nuclei to other small solar system bodies and to assess which parent body populations give rise to Jupiter-family comets. The bluer color of 21P and other Jupiter-family comets, as compared to the mean color of Kuiper-Belt Object/Trans-Neptunian Object populations, (Snodgrass et al., 2005), suggests that cometary activity and surface processing in the inner solar system have altered the primitive surfaces of these nuclei agglomerated from materials in the Kuiper Belt (e.g., Jewitt, 2002; Wooden et al., 2004).
3.4 Dust Production Rates
The quantity of a comet, a proxy describing the dust production rate (A’Hearn et al., 1984), is often used to describe nucleus activity vigor, and to distinguish between dusty and inactive comet taxonomies. is given by
| (2) |
where is the wavelength-dependent albedo of dust particles, is the filling factor of grains (total cross-section), is the linear radius of the aperture at the comet, and are heliocentric and geocentric distance (AU), is the angular diameter of the field of view (in arcseconds), is the observed cometary flux and is the solar flux. The parameter is typically expressed in centimeters. By providing a metric to quantify a comet’s level of dust output (large values indicate higher activity), one can ascertain the dust contribution to a set of photometric measurements and assess the heliocentric dependence of dust production rates in a given comet.
-band values of for 21P derived from our photometry are summarized in column [7] of Table 2 and are plotted as a function of in Fig. 5. Peak dust production rates of 131 cm-1 occurred just post-perihelion. We fit the post-perihelion values with a function of the form using the least absolute deviation method (Press et al., 1992). Our best-fit values are cm, . The pre-perihelion observations do not span a large enough range of to derive a slope. Our post-perihelion slope () is comparable to the pre-perihelion value of derived by A’Hearn et al. (1995) based on observations obtained when 21P was at a AU. However, A’Hearn et al. (1995) find a significantly larger value () when the 21P is interior to 1.86 AU post-perihelion suggesting that the comet’s activity peaks just after perihelion passage.
3.5 IR Photometry, Optical to IR SED, and the Dust Albedo
We measured the flux of comet 21P in the MIPS and IRAC images using the aper.pro procedure of the IDL Astronomy User’s Library (Landsman, 1993). The 2005 December IRAC, MIPS, and optical photometry are all measured at different heliocentric distances ( AU), observing geometries ( AU), and spatial resolutions. However, differences in observational circumstances are small such that simple scaling laws can be applied to the photometry to create a composite 0.5–24 µm SED of comet 21P. For reasons discussed below, we elect to correct the IR photometry (§ 2.2) to match the observing conditions of the optical measurements (§ 2.1).
First, we correct the IR photometry for the limited resolution of the Spitzer telescope, as compared to the optical data. The IRAC and MIPS images are diffraction limited and stellar sources have full-width half maximum ″, 2.0″, and 6″ at 4.5, 8.0, and 24 µm (Fazio et al., 2004; Rieke et al., 2004). The 24 µm point-spread-function (PSF) is too broad to compare to the 3″ -band photometry in Table 2 (column [3]), and the IRAC PSF is marginally appropriate. To derive the IR photometry in an aperture size of 3741 km (corresponding to the optical photometry, 3″ at 1.72 AU), we measure the comet’s IR coma with increasingly larger apertures and use a curve-of-growth analysis to estimate the fluxes at apertures comparable to or smaller than the resolution of the Spitzer instruments. We examined the logarithmic profile of the optical data to verify that the coma slope at moderate sized apertures (″) extends into the inner-coma (″). The photometry at 10″ and the coma logarithmic slopes are presented in Table 3.
Next we correct the IRAC and MIPS photometry for the differences in observer-comet distance. The correction is simply : 0.93 for IRAC, and 1.18 for MIPS.
Finally, we scale the IRAC and MIPS photometry to match the heliocentric distance ( AU) of the optical observations. There are two effects that depend on : the temperature of the dust, and the dust production of the comet. To correct for changes in the dust production, we scale the photometry using the heliocentric distance trend derived for 21P, (§3.4). The MIPS photometry is scaled by a factor of 0.86 and the IRAC photometry scaled by 1.08. To correct for the dust temperature, we scale the photometry by , where is the Planck function, and and are the dust temperatures at the optical and IR heliocentric distances, which we set to the blackbody temperature, K. The scale factors are: 1.37 for µm, 1.20 for µm, and 0.88 for µm for the IRAC and MIPS data respectively.
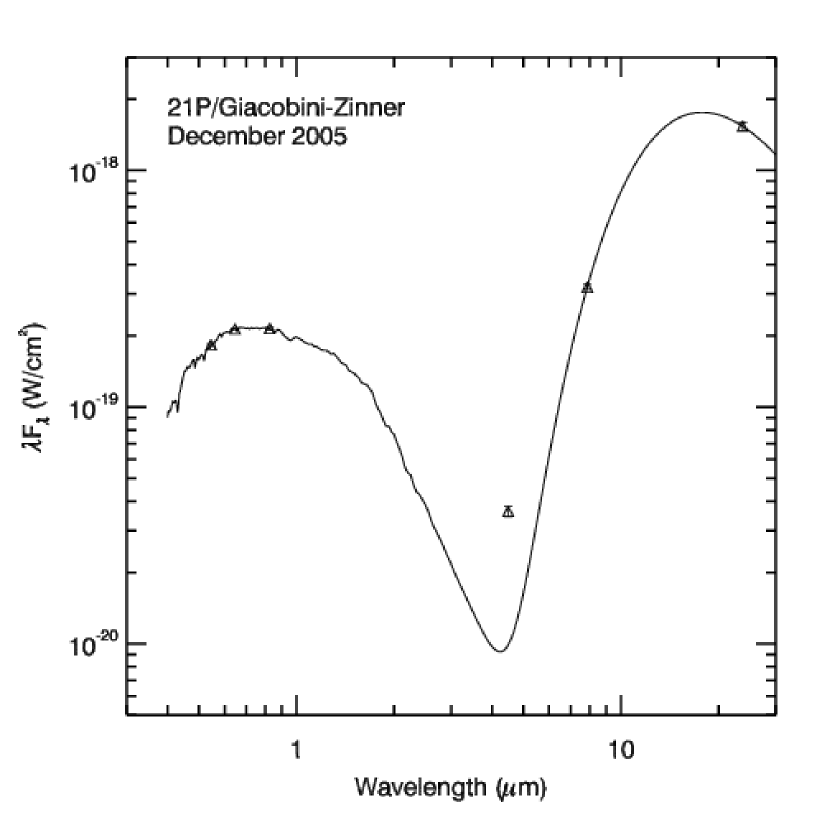
Our measured fluxes, azimuthally averaged surface brightness profile logarithmic slopes, and the corrected photometry is presented in Table 3. The total SED of the comet is presented in Fig. 6. The optical magnitudes of Table 2 were converted to flux units using the zero magnitude flux densities of 3600 Jy (-band), 3090 Jy (-band), and 2550 Jy (-band). We fit the SED with a scaled, reddened solar spectrum to represent the scattered light at the optical wavelengths, plus a scaled Planck function, to represent the thermal emission from the IR wavelengths. We exclude the gas contaminated 4.5 µm data point (§3.7) from the fit. Solar spectrum reddening (the spectral slope) is typically expressed as percent per 0.1 µm (e.g., Jewitt & Meech, 1986). A negative spectral slope represents a bluing of the spectrum. Our observations constrain the scattered light reddening between the - and -bands, and the - and -bands. Following Jewitt & Meech (1986), we express the reddening with the linear slope expressed as % per 0.1 µm. At optical wavelengths, our computed slopes for comet 21P (see Table 2) are % per 0.1 µm, and % per 0.1 µm. The former slope of the reflectivity gradient is in good agreement with the average value of % per 0.1 µm derived by Jewitt & Meech (1986) for comets, while the latter slope value agrees with the general trend of bluer scattering at longer wavelengths (see Fig. 4 of Jewitt & Meech, 1986). Indeed, Jewitt & Meech (1986) observed 21P in the near-IR and found % per 0.1 µm and % per 0.1 µm. The fit has no degrees of freedom, so we do not present errors or a analysis. The best-fit dust temperature is 206 K (% warmer than a blackbody). We derive a bolometric albedo for the dust of comet 21P using Eqs. 6 and 7 from Gehrz & Ney (1992). The bolometric albedo of 21P is , slightly lower than values derived for other comets at the same phase angle (, Kolokolova et al., 2005), but not unusual.
3.6 Nucleus Size & Light Curves
The size of the equivalent spherical nucleus, , can be estimated from the apparent mean magnitude of comet 21P measured at heliocentric distances when the comet is relatively inactive. Pre-perihelion, (Table 2) and can be derived from the standard relation
| (3) |
where is the geometric albedo, (AU) the heliocentric distance, (AU) the geocentric distance, the -band magnitude of the Sun (Russel, 1916), (mag deg-1) the linear phase coefficient, and is the phase angle. For 21P, we adopt value of (Lamy et al., 2005; Fernández et al., 2001) and mag deg-1 which is generally used for most comets with unknown ; however, Ferrín (2005) argue that a may be more appropriate based on the observed phase coefficient for 10 comets. We find km, commensurate with other estimates nucleus size ranging from 1.0 km derived by Tancredi et al. (2000) or km value of derived from the snapshot survey of Mueller (1992), assuming .
In principle, variations in the photometric brightness derived from the -band individual images obtained over hr intervals during the period of 2005 December 21 through 22 (Table 2) can be used to generate a composite light curve yielding estimates of nucleus rotational periods. However, our composite light curve of 21P at this epoch, AU exhibits little periodic variation and we are unable to determine a rotational period. 21P was also very active during this epoch, with a significant coma contribution which could mask subtle variations ( mag) in nucleus flux. A rotational period of hr for 21P has been reported by (Leibowitz & Brosch, 1986).
3.7 Volatiles CO+CO2
Volatiles are frozen as ices or trapped as gases in amorphous water ice in the nuclei of comets (Capria, 2002; Prialnik, 2002). Cometary activity occurs when gases are released through sublimation or through the exoergic crystallization of amorphous water ice. Water sublimation primarily drives vigorous activity at AU (Meech & Svoreň, 2004), but other volatiles can still be important drivers. At 1.5 AU, Feaga et al. (2007) found that CO2 gas was correlated with comet 9P/Tempel’s southern hemisphere — the location of the strongest dust jet (Farnham et al., 2007) — yet water vapor was more strongly associated with the northern hemisphere.
Some molecular species (e.g., CO) are released not only from the nucleus (native source), but also from within the coma (“distributed” or “extended” source). In the extensively studied, bright OC comet C/1995 O1 (Hale-Bopp), there was evidence for distributed CO sources, possibly arising from icy grains in the coma (Gunnarsson et al., 2003) at large , whereas at AU the strong distributed sources probably arise from the desorption of an organic grain component (Crovisier, 1999). Although icy grains may be the distributed source of the CO (Gunnarsson, 2003; Bockelée-Morvan et al., 2002), pure-CO ice grains do not survive transport into the coma because of their low sublimation temperatures, 20–100 K (Prialnik et al., 2004).
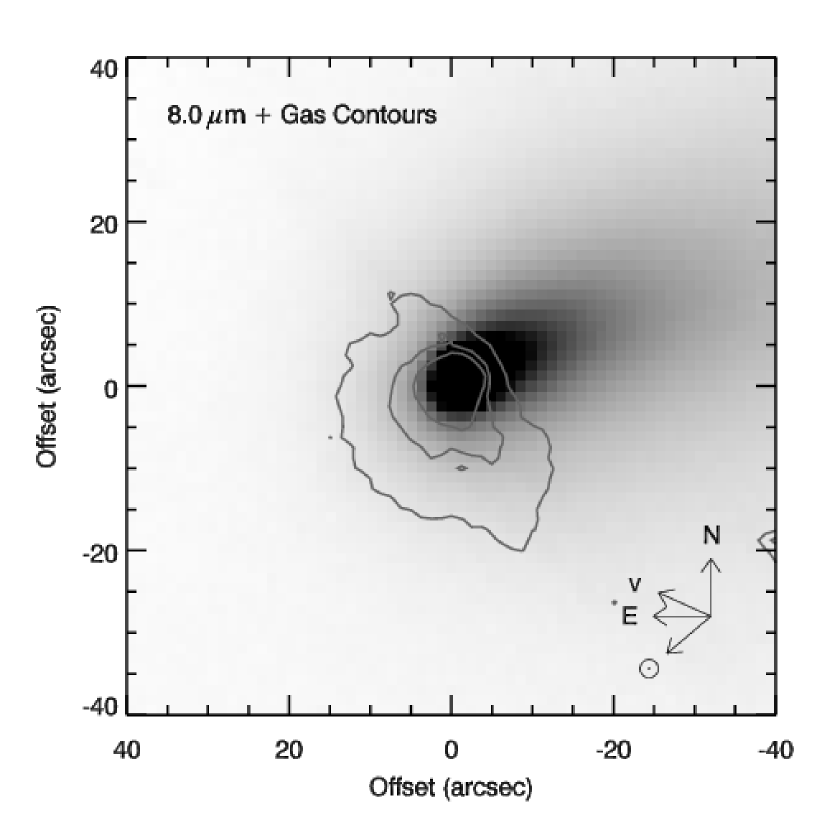
The IRAC 4.5 µm bandpass encompasses the CO2 -band and the CO 1–0 fundamental band at 4.26 and 4.67 µm respectively. The CO and CO2 bands are observed as the dominate components at 3–4 µm in excess of the dust continuum emission in ISO spectra of comets Hale-Bopp and 103P/Hartley (Crovisier et al., 1999a, b) and in the ambient coma of 9P/Tempel (Feaga et al., 2007). After removing the dust continuum, the IRAC images can be used to map the CO and CO2 spatial distributions in the comet coma. In principle, the emission from the two molecules can be decoupled when we consider that CO and CO2 have different lifetimes in the coma and therefore produce different radial distributions. With a measured radial distribution, we can also test for evidence of an extended source of CO or CO2. Emission from other prominent volatiles, such as water (Woodward et al., 2007), lie outside the bandpass of the IRAC 4.5 µm filter.
The slope of the CO CO2 emission in the Spitzer images at pixels (corresponding to projected cometocentric distances of km to km) can be determined by subtracting a scaled IRAC 8.0 µm image from the IRAC 4.5 µm image (Fig. 2). The IRAC 8.0 µm image is dominated by thermal emission from dust, whereas the 4.5 µm image is a combination of emission from gas, dust thermal emission, and sunlight scattered by dust. The color of sunlight scattered by comet dust varies with wavelength (Jewitt & Meech, 1986; Kolokolova et al., 2005), and we cannot constrain the spectral slope of the scattered light at 4.5 µm with our data. Rather than estimating the 4.5 µm dust flux from our best-fit SED (§3.5), we subtract a scaled 8.0 µm image from the 4.5 µm image to yield an image of the gas emission (Fig. 7). Our best scale factor is , which we derived from the ratio of the 4.5 µm and 8.0 µm images. We measured the ratio along a 3 pixel wide rectangle positioned on the dust tail from 5 to 40 pixels from the nucleus. The error in the scale factor is the standard deviation of the pixels in the rectangle. We fit the residual surface brightness profile (emission from the gas) in 24° azimuthal steps. The mean surface brightness logarithmic slope is (median , error in the mean ). The derived gas profile is consistent with a long-lived species ejected in a constant outflow from the nucleus, i.e, it shows no evidence for an extended source.
The lifetimes of CO and CO2 at 2.4 AU are CO days and CO days (Huebner et al., 1992). For an outflow velocity of 1.0 km s-1, the characteristic length scales are km (CO) and km (CO2). In our dust subtracted image, there appears to be emission out to 60 pixels from the nucleus ( km), but background stars make it difficult to measure the logarithmic slope beyond 20 pixels. Both species are long lived on scale lengths pixels even if the outflow velocity is 0.1 km s-1. From our analysis, both CO and CO2 are equally viable candidates for the 4.5 µm excess in the difference image, Fig. 7. For comparison, in comet Hale-Bopp (Crovisier et al., 1999a), CO2 was the dominant emission species at 2.9 AU (comet 21P was observed at 2.4 AU).
We can measure the intensity of the gaseous emission and derive upper-limits to the CO2 and CO contributions. We have attempted to remove the dust from the 4.5 µm image; however, emission from the nucleus has not been removed. Although we derived an effective radius from our optical observations (§3.6), the orientation, shape, and temperature distribution of the nucleus is unknown at the epoch of the IRAC images. Rather than measuring the flux inside a circular aperture centered on the nucleus, we avoid contamination from the nucleus by measuring the gas coma inside an annulus with an inner-radius of 6 pixels, and an outer-radius of 8 pixels. We convert the measured annular flux density, erg s-1 cm-2 Hz-1, into line emission fluxes following the IRAC prescriptions discussed by the Spitzer Science Center (2006), where we perform a linear interpolation of values given in the IRAC spectral response tables222http://ssc.caltech.edu/irac/spectralresponse.html near the wavelength position of our lines, assuming the residual emission within the effective bandpass of the IRAC 4.5 µm filter is either entirely from either CO2 ( µm) or CO ( µm). We find erg s-1 cm-2, and erg s-1 cm2. The errors include the IRAC absolute calibration uncertainty of 3%, and a dust subtraction uncertainty of 11%.
The gaseous coma has an azimuthally average profile surface brightness slope of (see Table 3), thus we can convert the flux at 6–8 pixels to a flux inside a circular aperture of projected radius 7 pixels, , where pixels, is the flux measured in the annulus, and is the area of the annulus in square pixels (e.g., Jewitt & Danielson, 1984). The total emission inside this 7 pixel aperture yields an average column density, , in cm-2, assuming optically thin emission from the expression
| (4) |
where is the observer-comet distance in cm, (µm) is the wavelength of the emission, is Planck’s constant (erg s), is the speed of light (µm s-1), is the heliocentric distance in AU, is the solar fluorescence -factor at 1 AU in units of s-1, and is the projected radius of the aperture, here in units of cm. We have adopted -factors given by Crovisier & Encrenaz (1983) of s-1 for the CO2 band, and s-1 for the CO 1–0 band, noting that other cited literature values for these -factors differ by 10%. From Eqn. 4, we derive average column densities of: cm-2, if the emission is solely from CO2 and cm-2, if the emission is solely from CO.
Bockelée-Morvan et al. (1990) measured OH radio emission profiles in spectra of several comets as a function of , including comet 21P, to derive the expansion velocity of that species. For most low production rate comets () the expansion velocities are constant for AU. Radio measurements of the OH production rates of 21P during the 1985 apparition indicate that molecules s-1, with little change in the derived expansion velocity, km s-1 (see Table 4; Bockelée-Morvan et al., 1990) over a range of . Given the lack of a strong dependency of at distance greater than 1.4 AU, we will adopt km s-1 for the parent expansion velocity to estimate the expansion velocities of CO2 and CO for 21P at 2.4 AU from the Sun. With this velocity, we can derive the production rates, , in molecules s-1, for each species:
| (5) |
where is measured in km, and in km s-1. The production rates are: molecules s-1, and molecules s-1. We note that these are upper-limits to the production rates for each species as we cannot distinguish between the two.
Mumma et al. (2000) detected CO at 4.67 µm in the coma of comet 21P at AU (pre-perihelion) in October 1998 — the first IR detection of this volatile in a Jupiter-family comet. However, two weeks later Weaver et al. (1999) did not detect CO at the same wavelengths. Mumma et al. (2000) suggest that comet 21P has a chemically heterogeneous nucleus, and that the CO was limited to a vent that was not illuminated during the observations conducted by Weaver et al. (1999). This explanation seems reasonable as the comet was near perihelion when seasonal variations of insolation are the greatest. Our IRAC images of comet 21P were obtained at a post-perihelion distance of AU. If the vent responsible for the decrease in CO production remains inactive out to 2.4 AU, CO2 would remain the favored molecule responsible for the IRAC 4.5 µm excess.
3.8 Dust Trails
Determining the cometary dust fraction of the zodiacal dust complex is becoming increasingly important. Recent Spitzer discoveries of dust surrounding white dwarfs (Becklin et al., 2005) suggest that mass-loss from cometary bodies (in Kuiper Belt or Oort Cloud analogs) or tidal disruption of asteroidal objects are feeding their circumstellar dust complexes (Su et al., 2007; Reach et al., 2005). Comets lose a large fraction of their mass in dust grains µm (Kelley et al., 2008; Reach, Kelley, & Sykes, 2007; Ishiguro et al., 2007; Sykes & Walker, 1992). These grains weakly respond to solar radiation pressure and form distinct dynamical structures known as dust trails (Sykes et al., 1988). Trails typically appear to follow their parent nucleus along the comet’s projected orbit, although the “trail” may also lead the comet. Dust trails are ubiquitous in Jupiter-family comets, but remain unobserved in OC comets. The existence of OC dust trails is inferred from meteor stream studies of Halley-type comets, which are derived from the OC. For example, the Halley-type comet 55P/Tempel-Tuttle is the parent body of the Leonid meteor stream and at least 80% of JFCs have dust trails (Reach, Kelley, & Sykes, 2007).
The existence of dust trails in comets with perihelia near 1-2 AU has interesting astrobiological significance. Reach, Kelley, & Sykes (2007) demonstrate that comets have trail mass production rates that are: (1) similar to water mass production rates, and (2) greater than the small grain (radii µm) mass production rates. If the composition of the comet’s coma approximates the comet interior, then comet nuclei are mostly refractory in nature (dust-to-ice mass ratio ), which limits the amount of water a comet could deliver to the surface of a young terrestrial planet. Comet 21P is the parent body of the Draconid meteor stream (Beech, 1986), which can produce exceptionally active meteor showers ( meteors per hour; Jenniskens, 1995). The outburst activity is strongly associated with years when the Earth and 21P closely approach each other, suggesting that the comet is presently ejecting meteoroids.
Thermal radiation from large grains in a comet trail is easily detected at IR wavelengths from space-based telescopes (Reach, Kelley, & Sykes, 2007; Sykes & Walker, 1992), where the emission from warm ( K) dust peaks. We examined our MIPS 24 µm image of 21P (obtained at 2.4 AU) for dust trail emission along the projected velocity vector of the comet (Fig. 8). No trail is detected with a surface brightness upper-limit of 0.3 MJy sr-1 pixel-1. Assuming a typical trail grain temperature of K (Sykes & Walker, 1992), the latter surface brightness corresponds to an IR optical depth of . Our upper-limit is larger than the typical comet trail observed in other Spitzer MIPS images (Reach, Kelley, & Sykes, 2007), thus it is possible that 21P still has a dust trail. Miura et al. (2007), using deep -band imaging of 21P, do not detect the presence of brightness enhancements at the expected position of the dust trail, and derive a upper-limit to the number density of trail grains to be m-3. Using similar assumptions (typical grain size of 1 mm), and assuming a typical trail thickness of km (Reach, Kelley, & Sykes, 2007), our MIPS optical depth limit suggests a number density m-3 — slightly lower than the optically determined value. Miura et al. (2007) also estimate the dust trail number density from meteor shower activities. Their lower-limit ( m-3) is about 4 orders of magnitude smaller than our upper-limit. For comparison, the trail grain number density for 81P/Wild is m-3 (Ishiguro et al., 2003), and for 67P/Churyumov-Gerasimenko is m-3 (Kelley et al., 2008). Altogether, the evidence suggests comet 21P has a dust trail fainter than the detectable limits of the available observations.
4 CONCLUSIONS
We have presented new optical and Spitzer infrared observations of comet 21P/Giacobini-Zinner obtained during its 2005 apparition. Analysis of optical imagery indicates that 21P was dusty (peak cm-1) and active out to heliocentric distances AU following a logarithmic slope with of . Onset of nucleus activity occurred at a pre-perihelion distance AU ( days pre-perihelion), similar in behavior to that observed in the 1991 apparition. The derived average coma colors, are slightly redder than solar, comparable to colors derived for other Jupiter-family comets. Pre-perihelion observations during quiescence yields a nucleus radius of km.
Spitzer IRAC images obtained at AU, post-perihelion exhibit an extensive coma with a prominent dust tail, where excess emission (over the dust continuum) in the 4.5 µm image at cometocentric distances of km likely arises from CO2, although a distributed source of CO cannot be discounted. The upper limits to the production rates are molecules s-1 and molecules s-1. The surface brightness of the gas emission is observed to peak along the sun angle, while the dust tail peaks near the anti-sunward angle. A search for dust trail emission along the projected velocity vector of comet 21P using our MIPS 24 µm image ( AU), yielded no trail ( surface brightness upper-limit of 0.3 MJy sr-1 pixel-1), suggesting that the number density of trail particles (typical particle size mm) is m-3. The bolometric albedo of 21P derived from the contemporaneous optical and Spitzer observations is , slightly lower than values derived for other comets at the same phase angle.
References
- Allen (1973) Allen, C.W., 1973. Astrophysical Quantities. 3rd ed. (Athlone Press: London), p.162
- A’Hearn et al. (2005) A’Hearn, M. F., et al. 2005, Science, 310, 258
- A’Hearn et al. (1995) A’Hearn, M. F., et al. 1995, Icarus, 118, 223
- A’Hearn et al. (1984) A’Hearn, M. F., Schleicher, D. G., Feldman, P. D., Millis, R. L., & Thompson, D. T. 1984, AJ, 89, 579
- Beech (1986) Beech, M. 1986, AJ, 91, 159
- Becklin et al. (2005) Becklin, E. E., Farihi, J., Jura, M., Song, I., Weinberger, A. J., & Zuckerman, B. 2005, ApJ, 632, L119
- Belton et al. (2007) Belton, M. J. S., et al. 2007, Icarus, 191, 573
- Bockelée-Morvan et al. (2002) Bockelée-Morvan, D., et al. 2002, Earth, Moon, & Planets, 89, 53l
- Bockelée-Morvan et al. (1990) Bockelée-Morvan, D., Crovisier, J., & Gerard, E. 1990, A&A, 238, 382
- Brandt et al. (1988) Brandt, J. C., Farquhar, R. W., Maran, S. P., Niedner, M. B., Jr., & von Rosenvinge, T. T. 1988, in Exploration of Halley’s Comet
- Capria (2002) Capria, M. T. 2002, Earth, Moon, & Planets, 89, 161
- Crovisier (1999) Crovisier, J. 1999, Nature, 399, 640
- Crovisier & Encrenaz (1983) Crovisier, J., & Encrenaz, T. 1983, A&A, 126, 170
- Crovisier et al. (1999a) Crovisier, J., et al. 1999a, in The Universe as Seen by ISO, eds. P. Cox & M. F. Kessler, ESA-SP 427, 137
- Crovisier et al. (1999b) Crovisier, J., et al. 1999b, in The Universe as Seen by ISO, eds. P. Cox & M. F. Kessler, ESA-SP 427, 161
- Davidsson & Skorov (2002) Davidsson, B. & Skorov, Y. 2002, Icarus, 156, 223
- Dello Russo et al. (2007) Dello Russo, N., Vervack, R. J., Weaver, H. A., Biver, N., Bockelée-Morvan, D., Crovisier, J., & Lisse, C.M. 2007, Nature, 448, Issue 7150, 172
- Farnham et al. (2007) Farnham, T. L., et al. 2007, Icarus, 191, 146
- Fazio et al. (2004) Fazio, G. G., et al. 2004, ApJS, 154, 10
- Feaga et al. (2007) Feaga, L. M., A’Hearn, M. F., Sunshine, J. M., Groussin, O., & Farnham, T. L. 2007, Icarus, 190, 345
- Fernández et al. (2001) Fernández, Y., Jewitt, D. C., & Sheppard, S. S. 2001, ApJ, 553, L197
- Fernie (1983) Fernie, J. D. 1983, PASP, 95 782
- Ferrín (2005) Ferrín, I. 2005, Icarus, 178, 493
- Fink & Hicks (1996) Fink, U., & Hicks, M. D. 1996, ApJ, 459, 729
- Gehrz & Ney (1992) Gehrz, R. D., & Ney, E. P. 1992, Icarus, 100, 162
- Gunnarsson (2003) Gunnarsson, M. 2003, A&A, 398, 353
- Gunnarsson et al. (2003) Gunnarsson, M., et al. 2003a, A&A, 402, 383
- Hanner (1981) Hanner, M. S. 1981, Icarus, 47, 342
- Harker et al. (2007) Harker, D. E., Woodward, C. E., Wooden, D. H., Trujillio, C., & Fisher, S. 2007, Icarus, 190, 432
- Huebner et al. (1992) Huebner, W. F., Keady, J. J., & Lyon, S. P. 1992, Ap&SS, 195, 1
- Ishiguro et al. (2007) Ishiguro, M., Sarugaku, Y., Ueno, M., Miura, N., Usui, F., Chun, M.-Y., & Kwon, S. M. 2007, Icarus, 189, 169
- Ishiguro et al. (2003) Ishiguro, M., Kwon, S. M., Sarugaku, Y., Hasegawa, S., Usui, F., Nishiura, S., Nakada, Y., & Yano, H. 2003, ApJ, 589, L101
- Jenniskens (1995) Jenniskens, P. 1995, A&A, 295, 206
- Jewitt & Meech (1986) Jewitt, D. C., & Meech, K. J. 1986, ApJ, 310, 937
- Jewitt & Danielson (1984) Jewitt, D. C., & Danielson, G. E. 1984, Icarus, 60, 435
- Jewitt (2002) Jewitt, D. C. 2002, AJ, 123, 1039
- Kelley et al. (2008) Kelley, M. S., Reach, W. T., & Lien, D. J. 2008, Icarus, 193, 572
- Kelley et al. (2006) Kelley, M. S., Woodward, C. E. et al. 2006, ApJ, 651, 1256
- Kadono et al. (2007) Kadono, T., Sugita, S., Sako, S., Ootsubo, T., Honda, M., Kawakita, H., Miyata, T., Furusho, R., Watanabe, J. 2007, ApJ, 661, L89
- Kolokolova et al. (2005) Kolokolova, L., Hanner, M. S., Levasseur-Regourd, A.-C., & Gustafson, B. Å. S. 2005, in Comets II, eds. M. Festou, H. U. Keller, and H. A. Weaver, (University of Arizona Press: Tucson), p.577
- Lamy et al. (2005) Lamy, P., Toth, I., Fernández, Y., & Weaver, H. 2005, in Comets II, eds. M. Festou, H. U. Keller, and H. A. Weaver, (University of Arizona Press: Tucson), p.115
- Landolt (1992) Landolt, A. U. 1992, AJ, 104, 340
- Landsman (1993) Landsman, W. B. 1993, Astronomical Data Analysis Software and Systems II, 52, 246
- Leibowitz & Brosch (1986) Leibowitz, E. M., & Brosch, N. 1986, Icarus, 68, 430
- Lunine & Gautier (2004) Lunine, J. L. & Gautier, D. 2004, in Comets II, eds. M. Festou, H. U. Keller, and H. A. Weaver, (University of Arizona Press: Tucson), p.105
- Makovoz & Kahn (2005) Makovoz, D. & Khan, I. 2005, in Astronomical Data Aanalysis Software and Systems XIV, eds. P. Shopbell, M. Britton, and R. Ebert, ASP Conf. Ser. 347 (ASPC: San Francisco), p.81
- Meech & Svoreň (2004) Meech, K. & Svore, J. 2004, in Comets II, eds. M. Festou, H. U. Keller, and H. A. Weaver, (University of Arizona Press: Tucson), p.317
- Miura et al. (2007) Miura, N., Ishiguro, M., Sarugaku, Y., Usui, F., & Ueno, M. 2007, Dust in Planetary Systems, 643, 23
- Mueller (1992) Mueller, B. E. A. 1992, in Proc. Asteriods, Comets, Meteors, (Houston: LPI), p.425
- Mumma et al. (2000) Mumma, M. J., DiSanti, M. A., Dello Russo, N., Magee-Sauer, K., & Rettig, T. W. 2000, ApJ, 531, L155
- Press et al. (1992) Press, W. H., Teukolsky, S. A., Vetterling, W. T., & Flannery, B. P. 1992, (Cambridge: University Press), —c1992, 2nd ed.
- Prialnik (2002) Prialnik, D. 2002, Earth, Moon, & Planets, 89, 27
- Prialnik et al. (2004) Prialnik, D., et al. 2004, in Comets II, eds. M. Festou, H. U. Keller, and H. A. Weaver, (University of Arizona Press: Tucson), p.359
- Reach, Kelley, & Sykes (2007) Reach, W. T., Kelley, M. S., & Sykes, M. V. 2007, Icarus 191, 298
- Reach et al. (2005) Reach, W. T., et al. 2005, ApJ, 635, L161
- Rieke et al. (2004) Rieke, G. H., et al. 2004, ApJS, 154, 25
- Russel (1916) Russel, H. 1916, ApJ, 43, 173
- Snodgrass et al. (2005) Snodgrass, C., Fitzsimmons, A., & Lowry, S. C. 2005, A&A, 444, 287
- Sykes et al. (1988) Sykes, M. V., Lebofsky, L. A., Hunten, D. M., & Low, F. 1988, Science, 232, 1115
- Spitzer Science Center (2006) Spitzer Science Center. 2006, Infrared Array Camera Data Handbook (Pasadena: SSC), http://ssc.spitzer.caltech.edu/irac/dh/
- Su et al. (2007) Su, K. Y. L., et al. 2007, ApJ, 657, L41
- Sykes & Walker (1992) Sykes, M. V., & Walker, R. G. 1992, Icarus, 95, 180
- Tancredi et al. (2000) Tancredi, G., Fernández, J. A., Rickman, H., & Licandro, J. 2000, A&AS, 146, 73
- Weaver et al. (1999) Weaver, H. A., Chin, G., Bockelée-Morvan, D., Crovisier, J., Brooke, T. Y., Cruikshank, D. P., Geballe, T. R., Kim, S. J., & Meier, R. 1999, Icarus, 142, 482
- Werner et al. (2004) Werner, M. W., et al. 2004, ApJS, 154, 1
- Wooden et al. (2004) Wooden, D. H., Charnley, S. B., & Ehrenfreund, P. 2004, in Comets II, eds. M. Festou, H. U. Keller, and H. A. Weaver, (University of Arizona Press: Tucson), p.33
- Woodward et al. (2007) Woodward, C. E., Kelley, M. S., Bockelée-Morvan, D., & Gehrz, R. D. 2007, ApJ, 671, 1065
| Observation | ||||||||
|---|---|---|---|---|---|---|---|---|
| Date | aaPhase angle (Sun-Comet-Earth) or (Sun-Comet-Spitzer). | FWHMbbSeeing measured from stellar point sources. | Filter | Integration | ||||
| (UT) | Telescope | (AU) | (AU) | (deg) | (″) | Exposures | (sec) | SkyccSky shows either cirrus (C) or photometric (P) conditions. |
| Pre-Perihelion | ||||||||
| 2004 Jun 21 | UH2.2 m | 3.80 | 3.21 | 13.61 | 0.80 | 1200 | C | |
| 2004 Jun 22 | UH2.2 m | 3.79 | 3.21 | 13.76 | 0.80 | 300 | C | |
| Post-Perihelion | ||||||||
| 2005 Oct 20 | UH2.2 m | 1.76 | 1.74 | 33.02 | 0.60 | 30 | P | |
| 2005 Oct 22 | UH2.2 m | 1.78 | 1.74 | 32.80 | 0.76 | , | 90 | P |
| 2005 Dec 02 | Spitzer | 2.14 | 1.94 | 28.19 | MIPS24 | 10 | ||
| 2005 Dec 21 | UH2.2 m | 2.32 | 1.72 | 22.56 | 0.71 | , | 200 | P |
| 2005 Dec 22 | UH2.2 m | 2.32 | 1.72 | 22.32 | 0.65 | , | 150 | P |
| 2005 Dec 31 | Spitzer | 2.40 | 1.89 | 23.61 | IRAC4.5 | 30 | ||
| 2005 Dec 31 | Spitzer | 2.40 | 1.89 | 23.61 | IRAC8.0 | 30 | ||
| 2006 Mar 05 | UH2.2 m | 2.91 | 2.24 | 16.37 | 0.84 | , | 500 | C |
| 2006 Mar 06 | UH2.2 m | 2.92 | 2.25 | 16.45 | 0.73 | , | 400 | P |
| Observation | ||||||
|---|---|---|---|---|---|---|
| Date | -bandaaAverage color measured in a 3″ circular aperture. | aaAverage color measured in a 3″ circular aperture. | aaAverage color measured in a 3″ circular aperture. | |||
| (UT) | (AU) | (mag) | (mag) | (mag) | (mag) | (cm) |
| Pre-Perihelion | ||||||
| 2004 Jun 21 | 3.80 | 21.890.04 | 17.19 | 4.80 | ||
| 2004 Jun 22 | 3.79 | 21.950.06 | 17.24 | 4.55 | ||
| Post-Perihelion | ||||||
| 2005 Oct 20 | 1.76 | 15.910.01 | 12.82 | 130.66 | ||
| 2005 Oct 22 | 1.78 | 16.050.01 | 0.530.01 | 0.490.01 | 12.89 | 124.47 |
| 2005 Dec 21 | 2.32 | 17.050.01 | 0.490.01 | 13.74 | 83.00 | |
| 2005 Dec 22 | 2.32 | 17.070.01 | 0.520.01 | 0.480.01 | 13.76 | 82.07 |
| 2006 Mar 05 | 2.91 | 16.370.01 | 0.480.01 | 14.80 | 39.06 | |
| 2006 Mar 06 | 2.92 | 18.480.01 | 14.61 | 46.50 | ||
| Instrument / | S.B. | |||
|---|---|---|---|---|
| Wavelength | aa measured in a 10″ radius () aperture. | Slope, kbbThe logarithmic slope of the azimuthally averaged, surface brightness profile. | cc equivalent to a 3741 km radius aperture with the same observing circumstances as the 2005 Dec 22 UT optical observations (i.e., corrected for Spitzer-comet distances, dust temperature, and activity rate (). | |
| (µm) | (AU) | ( W cm-2 µm-1) | ( W cm-2 µm-1) | |
| IRAC 4.5 | 2.40 | |||
| IRAC 8.0 | 2.40 | |||
| MIPS 24.0 | 2.14 |