Fast nuclear spin hyperpolarization of phosphorus in silicon
Abstract
We experimentally demonstrate a method for obtaining nuclear spin hyperpolarization, that is, polarization significantly in excess of that expected for a thermal equilibrium. By exploiting a modified Overhauser process, we obtain more than 68% nuclear anti–polarization of phosphorus donors in silicon. This polarization is reached with a time constant of seconds, at a temperature of 1.37 K and a magnetic field of 8.5 T. The ability to obtain such large polarizations is discussed with regards to its significance for quantum information processing and magnetic resonance imaging.
pacs:
76.90.+d 76.30.-v 61.72.ufPhosphorus doped crystalline silicon (Si:P) is a model system for investigating spin effects in the solid state and at the same time is a point defect with great technological importance. Si:P has been used since the beginning of the semiconductor industry in the early 1950’s for applications ranging from the ubiquitous (thin film transistors) to the conceptual (single electron transistors). The ability to hyperpolarize the spins in this material is important for a number of its applications. Utilizing the nuclear spin of phosphorus donors as quantum bits 1, 2 relies on the ability to obtain a well characterized initial state 3, which can be obtained by hyperpolarization. Spin polarized silicon microparticles may also have applications for magnetic resonance imaging techniques4, similar to other hyperpolarized systems, such as xenon 5. Whilst it is reasonably simple to obtain large electron spin polarization, for example by using moderate magnetic fields at liquid 4He temperatures, doing the same with nuclear spins is difficult due to their much smaller Zeeman splitting. There are a number of schemes used to obtain nuclear spin polarization in excess of the thermal polarization. Dynamic nuclear polarization using off–resonance radiation has been studied extensively 6, 4. Complex pulses or adiabatic passage effects may be used to manipulate spin states, leading to large polarizations7, 8. Electrical injection of hot carriers has been used to obtain positive polarizations 9, however this requires electrical contact to the sample. Optical excitation with linearly polarized sub-bandgap light has given small (%) polarization of 29Si nuclei in silicon with a natural isotopic abundance 10.
In this letter, we demonstrate anti–polarization of phosphorus donor nuclei in silicon of up to . The scheme used is simple, fast and does not involve resonant manipulation of either the nuclear or electronic spin. Instead, the relative populations are modified using photoexcited carriers, generated using white light, at low temperatures (about 4He temperature) and in magnetic fields ( T) significantly smaller than those required to obtain an equivalent thermal nuclear spin polarization.
Phosphorus in silicon can be described by the spin () of its donor electron that is coupled to the spin () of the 31P nucleus. This model provides a system with four energy levels, as shown in Fig. 1 for the presence of strong magnetic fields when the nuclear Zeeman splitting exceeds the nuclear to donor electron hyperfine interaction. At T, the donor electron Zeeman splitting is GHz whereas the nuclear Zeeman energy is MHz and the hyperfine interaction MHz.
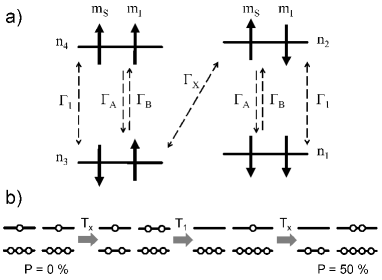
Figure 1(a) shows the relevant spin relaxation processes that occur in the 31P donor atom. is the rate coefficient associated with longitudinal relaxation of the electron magnetization towards thermal equilibrium with the crystal lattice at temperature . is the rate coefficient associated with the Overhauser spin relaxation process (a flip-flop) between the electron and nuclear spins 11. The dependence of the Overhauser rate on temperature and magnetic field has been described by Pines et al. 12 who derived an expression
| (1) |
where is the sound velocity of silicon, is the mass density of silicon, a multiplicative factor in the range 10 to 100, the nuclear spin and the hyperfine constant while is the Larmor frequency of the electrons with and representing the electron Landé–factor and Bohr’s magneton, respectively and the applied magnetic field. It is important to note that the Overhauser relaxation process serves to return the two spin populations and to thermal equilibrium with the phonon reservoir, with a temperature , which is not necessarily the same as the spin temperature . Due to the constant generation of new excess charge carriers by the illumination, a steady state will be established in which a constant density of hot electrons persists. As these hot electrons cascade towards the lattice temperature, they will emit phonons at a constant rate and thus . Note that the phonons will also increase , however, this effect is minimal due to the thermal mass of the silicon, which is held constant by the helium bath. Differences between and have previously been demonstrated using electrical injection of hot carriers13. Additionally, the photoexcited carriers may scatter with the bound donor electrons 14, 15, causing spin relaxation. We capture this process in our rate picture by introducing (), the rate coefficient for scattering between spin up (down) free electrons and spin down (up) bound electrons.
Feher has previously discussed the effect of the phonon reservoir temperature on the polarization of phosphorus in silicon 13. If the two characteristic temperatures of our system are equal, , then the thermally (hardly) polarized equilibrium population distribution is obtained. However, forcing by photoexcitation of charge carriers, we change the steady state population distribution. The Overhauser process will try to achieve thermal equilibrium between states and at a temperature , and the longitudinal relaxation process will force states ( and ) and ( and ) to thermal equilibrium at temperature . See Fig. 1(b) for a sketch outlining this process. The result of this situation is that the population of becomes much larger than the population of all other states, resulting in a net nuclear antipolarization, since . Numerical modelling of this process with realistic values for and and indicate that polarization near 100% is achievable.
To investigate this effect, we have undertaken electron spin resonance (ESR) and electrically detected magnetic resonance (EDMR) experiments at T, corresponding to a resonant frequency, GHz 16, 17. Similar experiments have been described by us elsewhere 18, 19. The samples used in this study were similar to those described in reference 18. They consist of crystalline silicon with (111) surface orientation with a phosphorus doping density cm-3, with aluminum surface contacts to allow EDMR.
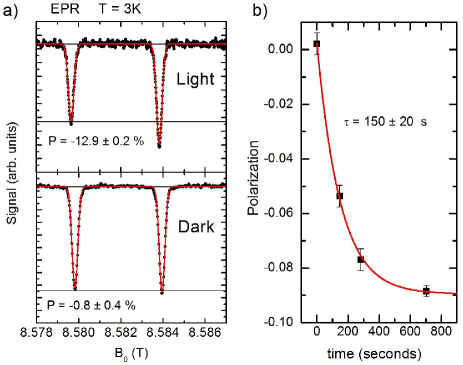
Figure 2(a) shows two ESR spectra recorded at T and K. The spectra were recorded by sweeping through the expected resonance fields. We fit the two observed resonances with two gaussian line shapes. We can be sure the signal is from phosphorus donor electrons due to both the –factor and hyperfine splitting of 4.17mT. The low-field (high-field) resonance is due to nuclear spins aligned (anti-aligned) with the external field, which we will call spin up, (spin down, ). The resonances are saturated due to the long relaxation times, however, we assume that the relaxation times are the same and, as a result, can take the area of the resonance as a measure of the number of spins that contribute to it 8. We thus determine the polarization of the sample, . The lower spectrum was recorded in the dark, and shows a nuclear polarization . Next, light from a mercury discharge lamp was shone onto the top side of the sample through an optical fibre, and the ESR spectra was remeasured (upper spectrum). Again, two resonances are visible, however, they have different intensities. Here, we determine the nuclear spin polarization . This is a change in polarization over the expected thermal polarization by a factor . A similar result is obtained sweeping in the opposite direction, indicating that the polarization is not a passage effect12.
The polarization model discussed above predicts that the time taken to reach a steady–state polarization should be limited by the Overhauser rate, since . By using previously measured 20 low magnetic field ( mT) values for , and extrapolating to the field used in the experiments presented here using Equ. 1, we obtain for the Overhauser time s, for and GHz. Figure 2(b) shows the polarization measured via ESR after light was applied to the sample. The data shows a gradual approach to a non–equilibrium steady state. The fit of these data with a single exponential decay function shows excellent agreement and yields a time constant of s. We believe this is in very good agreement with the predictions of the Overhauser rate made by Pines et al.12, given the uncertainty of the low field value ( hours) at a higher donor density, and the extrapolation over nearly two orders of magnitude of the magnetic field on which the Overhauser rate depends quadratically.
One aspect of the experiment above suggests that the polarization measured with ESR poses a lower limit on the maximum polarization obtained. ESR measures the polarization in the entire sample; however, only the surface is illuminated. We expect that, whilst the charge carriers will diffuse throughout the sample, they will thermalize while they diffuse. This will lead to a strong depth inhomogeneity of the reservoir temperature and hence a depth dependence of the polarization. While the polarization will be biggest near the surface which is being illuminated it will be minimized on the opposite sample surface.
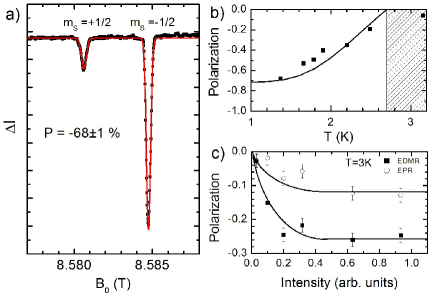
EDMR is a magnetic resonance detection scheme which is sensitive to spins close to the illuminated sample surface. EDMR relies on the current through a sample being influenced by the observed spin state. In Si:P at high magnetic fields, we have shown19 that EDMR is able to be observed due to to the spin dependent capture/emission mechanism described by Thornton and Honig 21, which we have included in our polarization model with and . The effect of this process is to decrease the current through the sample when resonant excitation of the donor electrons occurs. To measure EDMR, we thus require free charge carriers, which are provided by the illumination used to polarize the nuclear spins. Figure 3a) shows an EDMR spectrum recorded at K, the lowest temperature we were able to access. The spectrum was measured with illumination by a xenon discharge lamp, and a device current, nA. The microwaves were chopped at a frequency of 908 Hz, and the change in current was recorded with a lock-in amplifier. As with the ESR measurements, the spectrum is well fit by two gaussian lineshapes separated by the hyperfine splitting. Again, we use the area of the resonances as a measure of the population in each nuclear spin state. The polarization measured here is . This corresponds to an enhancement over the equilibrium polarization of , and to an effective nuclear spin temperature of mK.
EDMR measurements allow the observation of a 31P subensemble with a significantly more homogeneous reservoir temperature than the ESR measurements. We therefore use EDMR to test some of the qualitative properties of the polarization model described, namely, the lattice temperature dependence and the illumination intensity (and hence reservoir temperature) dependence of the observed nuclear polarization. Fig. 3b) shows the 31P polarization as a function of the lattice temperature. It is found to increase monotonically below K. Based on the rate model presented in Fig. 1, we calculated the polarization using the measured lattice temperature and a constant reservoir temperature whose value was chosen to fit the experimental data. The simulation results are also shown in Fig. 3b). The best fit of the simulated values to the measured values was achieved for , in agreement with the expectation that hyperpolarization vanishes when . Note that there is significant discrepancy between the fit and the data for temperatures above K. While the calculated data predicts no polarization, the measured data shows a clear hyperpolarization of P=-6% at K. This discrepancy can be attributed to our assumption of a constant used in the calculation. Note that for these experiments. Hence, the assumption of a constant K becomes unrealistic at K.
In order to further test the polarization model we changed the excitation spectrum of the excess charge carriers from the xenon lamp used for the acquisition of the data in Fig. 3(a) and (b) to a mercury lamp which has a higher spectral temperature. For the latter we measured polarization with both EDMR and ESR at a constant lattice temperature of K. As shown in Figure 3c), the EDMR spectra recorded with the mercury lamp yield a significantly higher polarization of up to P=-24% (instead of 6% at K), independently of the intensity over a range of almost one order of magnitude. As expected, at low intensities, when the excess charge carrier densities drop into a range where the Overhauser process is dominated by , the nuclear polarization vanishes and equilibrium appears. The polarization measured with ESR was consistently % of that measured with EDMR, confirming again the inhomogeneity of the reservoir temperature throughout the sample.
Note that while we have demonstrated polarization above %, our model predicts the possibility of even higher anti–polarization at lower temperatures and higher optical excitation rates. The technical simplicity of this polarization method suggests that it may be beneficial for a variety of technical applications. For instance, silicon microparticles are biologically inert which makes them prime candidates as contrast agents for in vivo magnetic resonance imaging. We see no obvious reason why the polarization technique presented above will not provide the same level of polarization in microparticles as we have demonstrated in bulk material. Given room temperature spin lifetimes minutes for 31P nuclei in a-Si:H, a disordered material with a bigger defect density and a larger hyperfine interaction than crystalline silicon, we expect polarization lifetimes of over an hour for this material, easily allowing implementation of such experiments22. Also, the rapid polarization of 31P nuclear spins demonstrated may offer an initialization mechanism for 31P in silicon spin qubits.
In conclusion, the data presented above demonstrates that hyper (anti-) polarization of phosphorous donor nuclear spins in crystalline silicon can be achieved rapidly (of the order of a few minutes) by irradiation with above silicon bandgap light at low temperatures and high magnetic fields. Polarization in excess of 68% was demonstrated, and discussed in terms of a model arising from the increased reservoir temperature driven by phonon emission during thermalization of photoexcited carriers. The qualitative predictions of this model for the polarization dependence on lattice temperature, illumination temperature and intensity have been verified and technical applications of this effect have been discussed.
This work was supported by a Visiting Scientist Program Grant 7300-100 from the National High Magnetic Field Laboratory. GWM was supported by the EPSRC through grants GR/S23506 and EP/D049717/1.
References
- Kane 1998 B. E. Kane, Nature 393, 133 (1998).
- Morton et al. 2008 J. J. L. Morton, A. M. Tyryshkin, R. M. Brown, S. Shankar, B. W. Lovett, A. Ardavan, T. Schenkel, E. E. Haller, J. W. Ager, and S. A. Lyon, eprint arXiv:0803.2021v1 (2008).
- DiVincenzo 2000 D. P. DiVincenzo, Fortschritte der Physik 48, 771 (2000).
- Dementyev et al. 2008 A. E. Dementyev, D. G. Cory, and C. Ramanathan, Phys. Rev. Lett. 100, 127601 (2008).
- Schroder et al. 2006 L. Schroder, T. J. Lowery, C. Hilty, D. E. Wemmer, and A. Pines, Science 314, 446 (2006).
- Abragam and Goldman 1978 A. Abragam and M. Goldman, Rep. Prog. Phys. 41, 395 (1978).
- Feher and Gere 1959a G. Feher and E. A. Gere, Phys. Rev. Lett. 3, 135 (1959a).
- Morley et al. 2007 G. W. Morley, J. van Tol, A. Ardavan, K. Porfyrakis, J. Zhang, and G. A. D. Briggs, Phys. Rev. Lett. 98, 220501 (2007).
- Clark and Feher 1963 W. G. Clark and G. Feher, Phys. Rev. Lett. 10, 134 (1963).
- Verhulst et al. 2005 A. S. Verhulst, I. G. Rau, Y. Yamamoto, and K. M. Itoh, Physical Review B 71, 235206 (2005).
- Overhauser 1953 A. W. Overhauser, Phys. Rev. 92, 411 (1953).
- Pines et al. 1957 D. Pines, J. Bardeen, and C. P. Slichter, Phys. Rev. 106, 489 (1957).
- Feher 1959 G. Feher, Phys. Rev. Lett. 3, 135 (1959).
- Honig and Moroz 1978 A. Honig and M. Moroz, Rev. Sci. Inst. 49, 183 (1978).
- Ghosh and Silsbee 1992 R. N. Ghosh and R. H. Silsbee, Phys. Rev. B 46, 12508 (1992).
- van Tol et al. 2005 J. van Tol, L.-C. Brunel, and R. J. Wylde, Rev. Sci. Instrum. 76, 074101 (2005).
- Morley et al. 2008a G. W. Morley, L.-C. Brunel, and J. van Tol, Rev. Sci. Instrum. 79, 064703 (2008a).
- McCamey et al. 2008 D. R. McCamey, G. W. Morley, H. Seipel, L. C. Brunel, J. van Tol, and C. Boehme, Phys. Rev. B p. to be published (2008).
- Morley et al. 2008b G. W. Morley, D. R. McCamey, H. Seipel, L. C. Brunel, J. van Tol, and C. Boehme, eprint arXiv:0806.3431v1 (2008b).
- Feher and Gere 1959b G. Feher and E. A. Gere, Phys. Rev. 114, 1245 (1959b).
- Thornton and Honig 1973 D. D. Thornton and A. Honig, Phys. Rev. Lett. 30, 909 (1973).
- McCarthy and Reimer 1987 M. J. McCarthy and J. A. Reimer, Phys. Rev. B 36, 4525 (1987).