Emission lines of Fe X in active region spectra obtained with the Solar Extreme-ultraviolet Research Telescope and Spectrograph
Abstract
Fully relativistic calculations of radiative rates and electron impact excitation cross sections for Fe x are used to derive theoretical emission-line ratios involving transitions in the 174–366 Å wavelength range. A comparison of these with solar active region observations obtained during the 1989 and 1995 flights of the Solar Extreme-ultraviolet Research Telescope and Spectrograph (SERTS) reveals generally very good agreement between theory and experiment. Several Fe x emission features are detected for the first time in SERTS spectra, while the 3s23p5 2P3/2–3s23p4(1S)3d 2D3/2 transition at 195.32 Å is identified for the first time (to our knowledge) in an astronomical source. The most useful Fe x electron density (Ne) diagnostic line ratios are assessed to be 175.27/174.53 and 175.27/177.24, which both involve lines close in wavelength and free from blends, vary by factors of 13 between Ne = 108 and 1011 cm-3, and yet show little temperature sensitivity. Should these lines not be available, then the 257.25/345.74 ratio may be employed to determine Ne, although this requires an accurate evaluation of the instrument intensity calibration over a relatively large wavelength range. However, if the weak 324.73 Å line of Fe x is reliably detected, the use of 324.73/345.74 or 257.25/324.73 is recommended over 257.25/345.74. Electron densities deduced from 175.27/174.53 and 175.27/177.24 for the stars Procyon and Cen, using observations from the Extreme-Ultraviolet Explorer (EUVE) satellite, are found to be consistent and in agreement with the values of Ne determined from other diagnostic ratios in the EUVE spectra. A comparison of several theoretical extreme-ultraviolet Fe x line ratios with experimental values for a -pinch, for which the plasma parameters have been independently determined, reveals reasonable agreement between theory and observation, providing some independent support for the accuracy of the adopted atomic data.
keywords:
atomic data – Sun: activity – Sun: corona – Sun: ultraviolet.1 Introduction
Emission lines arising from transitions in Fe x have been widely detected in solar extreme-ultraviolet (EUV) spectra (see, for example, Dere 1978; Thomas & Neupert 1994). Jordan (1965) first proposed the use of Fe x lines to determine the electron density in the solar corona, while Jordan (1966) employed EUV transitions of Fe x and other Fe ions to derive both the electron density and coronal Fe abundance. Since then, several authors have undertaken analyses of the solar EUV spectrum of Fe x, including for example Nussbaumer (1976) and Bhatia & Doschek (1995). To date, the most complete study is probably that of Del Zanna, Berrington & Mason (2004), which also provides an excellent review of previous work on Fe x. The theoretical line ratios calculated by Del Zanna et al. employ radiative rates generated with the superstructure code by either Bhatia & Doschek (1995) or themselves. For electron impact excitation rates, they use results for transitions among the lowest 31 fine-structure levels of Fe x calculated with the Breit-Pauli rmatrx code, either by Pelan & Berrington (2001) or once again by themselves.
Recently, Aggarwal & Keenan (2004, 2005) have used the fully relativistic grasp and Dirac rmatrx codes to calculate radiative rates and electron impact excitation cross sections, respectively, for transitions among the energetically lowest 90 fine-structure levels of Fe x. In this paper we use these results, plus additional atomic data presented here, to generate theoretical emission-line ratios for Fe x, and compare these with high resolution spectra from the Solar Extreme-ultraviolet Research Telescope and Spectrograph (SERTS). Our aims are threefold, namely to (i) assess the importance of blending in the SERTS observations, (ii) detect new Fe x emission lines, and (iii) identify the best Fe x line ratios for use as electron density diagnostics.
This work is of particular relevance due to the recent launch of the Hinode mission, which has on board the EUV Imaging Spectrometer (EIS), covering the 170–211 Å and 246–292 Å wavelength ranges (Culhane et al. 2007), similar to the SERTS spectral coverage of 170–225 Å and 235–450 Å (Thomas & Neupert 1994). It is clearly important that emission lines observed by the EIS are fully assessed, and the best diagnostics identified. SERTS provides the ideal testbed for this, due to its larger wavelength coverage, allowing more lines from the same species to be detected and compared with theoretical predictions. Furthermore, the best SERTS spectral resolution is about 0.03 Å [full width at half-maximum (FWHM)], obtained for the 170–225 Å wavelength range observed in second-order (Brosius, Davila & Thomas 1998a), which is a full factor of two better than the 0.065–0.075 Å resolution available from EIS (Young et al. 2007). Hence the SERTS data sets should allow emission features to be resolved and assessed which are blended in EIS spectra. Indeed, this is illustrated by our previous work on Fe xiii (Keenan et al. 2007), where we resolved the 203.79 and 203.83 Å features which are blended in EIS observations (Young et al. 2007).
2 Observational data
SERTS has had a total of 10 successful flights over the period 1982–2000, each featuring a somewhat different set of optical components and observing targets. We have selected data from two of these for analysis here, as they provide the most complete sequence of well-observed Fe x emission lines.
The flight on 1989 May 5 (henceforth referred to as SERTS–89) carried a standard gold-coated toroidal diffraction grating, and was the first to observe a strong solar active region, NOAA 5464. It detected hundreds of first-order emission lines in the 235–450 Å wavelength range, plus dozens of features spanning 170–225 Å, which appeared in second-order among the 340–450 Å first-order lines (Thomas & Neupert 1994). The spectrum was recorded on Kodak 101–07 emulsion, at a spectral resolution of 50–80 mÅ (FWHM) in first-order, and a spatial resolution of approximately 7 arcsec (FWHM). This combination of high spectral resolution, strong signal, and broad wavelength coverage remains unsurpassed even today as the best available data set for investigating imaged solar emission features over the full wavelength range of 235–450 Å, and hence are used in the present paper. Subsequent SERTS flights employed either a multilayer-coated diffraction grating or CCD-detector arrays which provided important technical advantages, but which also restricted the spectral bandpass that could be covered, making their data less suitable for the present study (see Keenan et al. 2007 and references therein).
The one exception was the flight on 1995 May 15 (henceforth referred to as SERTS–95) which incorporated a multilayer-coated toroidal diffraction grating that enhanced its sensitivity to second-order features in the 170–225 Å wavelength range (Brosius et al. 1998a). It observed active region NOAA 7870, again using Kodak 101–07 emulsion, and had an improved spatial resolution of approximately 5 arcsec. Its unique shortwave multilayer coating led to the detection of many second-order emission lines not seen on previous SERTS flights (Thomas & Neupert 1994; Brosius et al. 1996), and furthermore obtained the highest spectral resolution (0.03 Å FHWM) ever achieved for spatially resolved active region spectra in this wavelength range. The SERTS–95 data therefore provide the best observations for investigating Fe x emission lines in the 170–225 Å region, and hence are employed in this paper.
Further details of the SERTS–95 observations, and the wavelength and absolute flux calibration procedures employed in the data reduction, may be found in Brosius et al. (1998a,b). Similar information for the SERTS–89 spectrum is available from Thomas & Neupert (1994). We note that although the relative intensity calibration curves in both cases involved fitting to calculations of insensitive line-ratio pairs, Fe x lines made up less than 10% of the points utilized in those procedures. Furthermore, detailed comparisons of line ratio calculations for many ions with SERTS measurements have revealed generally very good agreement between theory and observation, providing support for the SERTS intensity calibrations (see, for example, Keenan et al. 2007 and references therein). Thus, even without fully independent intensity calibrations, the SERTS results still provide a valid test for the new Fe x calculations presented here. It should also be noted that the SERTS–95 first-order calibration curve was extrapolated from its fitted range of 238–336 Å to cover its complete bandpass. Hence there is some extra uncertainty in the intensities of lines with wavelengths greater than 340 Å measured from this flight. However, no such problem exists with the SERTS–89 measurements of these lines.
We have searched for Fe x emission lines in the SERTS–89 and SERTS–95 spectra using the detections of Thomas & Neupert (1994) and Brosius et al. (1998b), supplemented with those from other sources, including the NIST database,111http://physics.nist.gov/PhysRefData/ the latest version (V5.2) of the chianti database (Dere et al. 1997; Landi et al. 2006), the Atomic Line List of van Hoof,222http://www.pa.uky.edu/peter/atomic/ and in particular the excellent summary of line identifications by Del Zanna et al. (2004). The latter provides not only a comprehensive list of wavelengths for well-observed Fe x transitions, but also indicates alternative wavelengths where previous identifications are not consistent with their conclusions. In Table 1 we list the Fe x transitions found in the SERTS–89 and SERTS–95 spectra, along with their measured wavelengths. We also indicate possible blending features or alternative identifications as suggested by Thomas & Neupert or Brosius et al. in their original line lists.
| Wavelength (Å) | Transition | Notea |
|---|---|---|
| 174.53 | 3s23p5 2P3/2–3s23p4(3P)3d 2D5/2 | |
| 175.27 | 3s23p5 2P1/2–3s23p4(3P)3d 2D3/2 | |
| 175.48 | 3s23p5 2P3/2–3s23p4(3P)3d 2P1/2 | |
| 177.24 | 3s23p5 2P3/2–3s23p4(3P)3d 2P3/2 | |
| 180.38 | 3s23p5 2P1/2–3s23p4(3P)3d 2P1/2 | Blended with Fe xi 180.38 + Fe xvi 360.76 (first-order). |
| 184.53 | 3s23p5 2P3/2–3s23p4(1D)3d 2S1/2 | |
| 190.05 | 3s23p5 2P1/2–3s23p4(1D)3d 2S1/2 | |
| 193.72 | 3s23p5 2P3/2–3s23p4(1S)3d 2D5/2 | |
| 195.32 | 3s23p5 2P3/2–3s23p4(1S)3d 2D3/2 | |
| 201.56 | 3s23p5 2P1/2–3s23p4(1S)3d 2D3/2 | |
| 220.26 | 3s23p5 2P3/2–3s23p4(3P)3d 2F5/2 | |
| 256.43 | 3s23p5 2P3/2–3s23p4(3P)3d 4D3/2 | |
| 257.25 | 3s23p5 2P3/2–3s23p4(3P)3d 4D5/2,7/2 | |
| 324.73 | 3s23p4(3P)3d 4D7/2–3s3p5(3P)3d 4F9/2 | |
| 337.24 | 3s23p4(3P)3d 2F7/2–3s3p5(3P)3d 2F7/2 | Listed as Ar viii by Thomas & Neupert (1994). |
| 345.74 | 3s23p5 2P3/2–3s3p6 2S1/2 | |
| 365.57 | 3s23p5 2P1/2–3s3p6 2S1/2 |
aFrom Brosius et al. (1998b) or Thomas & Neupert (1994).
Intensities and line widths (FWHM) of the Fe x features are given in Tables 2 and 3 for the SERTS–89 and SERTS–95 active regions, respectively, along with the associated 1 errors. These were measured using modified versions of the Gaussian fitting routines employed by Thomas & Neupert (1994), as discussed by Keenan et al. (2007). As a consequence, the intensities, FWHM values and their uncertainties listed in Tables 2 and 3 are somewhat different from those originally reported in Thomas & Neupert and Brosius et al. (1998b). Also, a uniform factor of 1.24 has been applied here to all SERTS–89 intensities, reflecting a more recent re-evaluation of its absolute calibration scale. Even so, in all directly comparable cases, the resulting line intensity values usually differ only slightly from those previously obtained. For the SERTS–95 data set, several of the stronger first-order Fe x lines could also be detected, and their measurements are therefore included in Table 3 along with the second-order results. However, for the SERTS–89 spectrum only the first-order Fe x features could be reliably identified.
| Wavelength | Intensity | Line width |
|---|---|---|
| (Å) | (erg cm-2 s-1 sr-1) | (mÅ) |
| 256.43 | 174.8 62.5 | 94 28 |
| 257.25 | 166.2 38.3 | 86 12 |
| 324.73 | 12.2 3.2 | 54 8 |
| 337.24 | 16.5 7.9 | 73 21 |
| 345.74 | 93.6 11.9 | 98 4 |
| 365.57 | 53.1 7.3 | 113 7 |
| Wavelength | Intensity | Line width |
|---|---|---|
| (Å) | (erg cm-2 s-1 sr-1) | (mÅ) |
| 174.53 | 655.4 82.0 | 41 3 |
| 175.27 | 133.5 30.5 | 27 5 |
| 175.48 | 79.4 20.9 | 41 9 |
| 177.24 | 335.2 41.9 | 39 3 |
| 180.38 | 3345.1 373.0 | 48 3 |
| 184.53 | 163.6 19.6 | 33 3 |
| 190.05 | 47.6 8.4 | 41 5 |
| 193.72 | 6.1 2.9 | 16 6 |
| 195.32 | 6.8 2.4 | 25 3 |
| 201.56 | 71.4 14.0 | 78 12 |
| 220.26 | 32.9 21.0 | 67 20 |
| 256.43 | 223.7 68.0 | 62 16 |
| 257.25 | 159.2 48.5 | 44 10 |
| 345.74 | 92.7 37.1 | 50 15 |
| 365.57 | 35.7 16.6 | 53 21 |
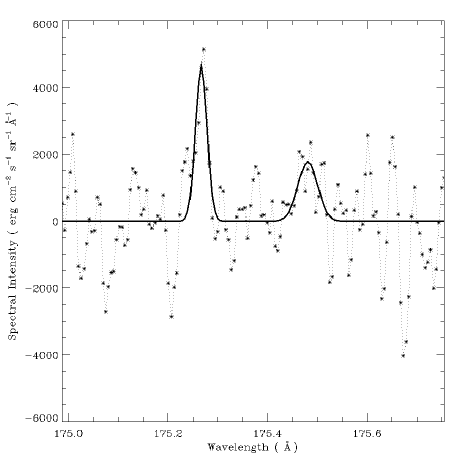
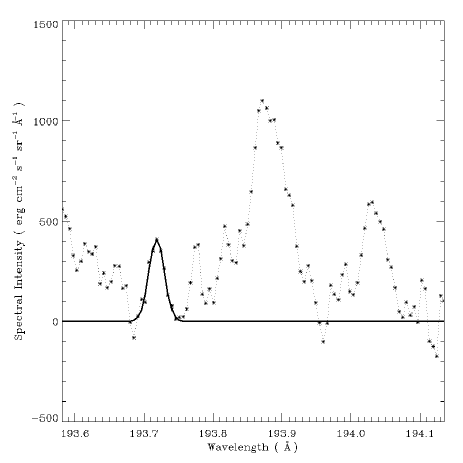
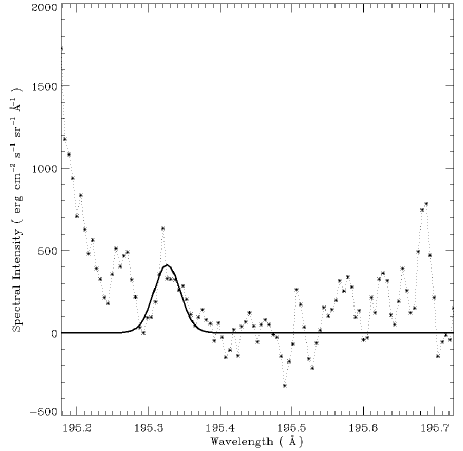
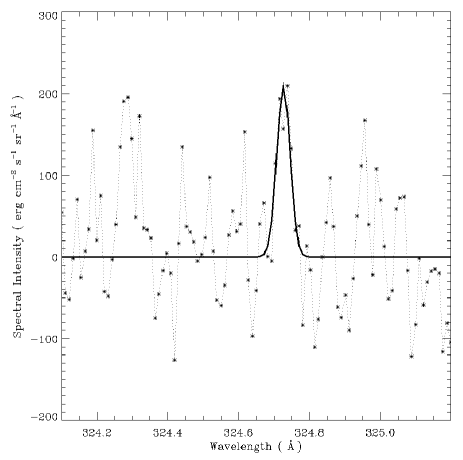
In Figs 1–5 we plot portions of the SERTS–89 and SERTS–95 spectra containing Fe x transitions, focusing on emission lines which have not previously been identified in SERTS data sets. We note that several of these features have line intensities and widths comparable to the noise fluctuations. In these instances, the reality of the feature was confirmed by a visual inspection of the original SERTS film. However, the lines are weak and clearly further observations to strengthen these identifications would be desirable.

3 Theoretical line ratios
The model ion for Fe x consisted of the 90 energetically lowest fine-structure levels. These are listed in table 1 of Aggarwal & Keenan (2005), and comprise levels arising from the 3s23p5, 3s3p6, 3s23p43d, 3s3p53d and 3s23p33d2 configurations. Where available, energies for these levels were taken from the experimental compilation in the NIST database. For the remainder, the theoretical values of Aggarwal & Keenan were adopted. Test calculations including higher-lying levels, such as those arising from the 3s23p44s configuration, were found to have a negligible effect on the theoretical line ratios considered in this paper.
The electron impact excitation cross sections employed in the present paper are those calculated using the fully relativistic Dirac rmatrx code by Aggarwal & Keenan (2005). For Einstein A-coefficients, Aggarwal & Keenan (2004) employed the fully relativistic grasp code to generate results for all transitions among the 54 fine-structure levels of the 3s23p5, 3s3p6, 3s23p43d and 3s3p53d configurations of Fe x. Subsequently, Aggarwal & Keenan (2005) extended this work to include the additional 36 levels arising from the 3s23p33d2 configuration, but did not publish their results, and instead noted that these were available from the authors on request. However, we provide these calculations in Table 4. A complete version of the table is available in the electronic version of this paper, with only sample results included in the hardcopy edition. The indices used to represent the lower and upper levels of a transition have been defined in table 1 of Aggarwal & Keenan (2005). We note that radiative data for all 4005 transitions among the 90 levels considered in our calculations are available in electronic form on request from one of the authors (K.Aggarwal@qub.ac.uk). These results have been adopted for all the Fe x transitions, apart from 3s23p5 2P3/2–3s23p5 2P1/2, where we have employed the A-value determined by Träbert, Saathoff & Wolf (2004) based on the extrapolation of experimental measurements for Co xi, Ni xii and Cu xiii. However, we note that this extrapolated result differs by less than 0.7 per cent from the calculation of Aggarwal & Keenan (2004).
| AE1 | fE1 | AE2 | fE2 | AM1 | fM1 | AM2 | fM2 | |||
|---|---|---|---|---|---|---|---|---|---|---|
| 1 | 55 | 1.22802 | 0.00000 | 0.00000 | 3.32704 | 1.12707 | 3.22202 | 1.09213 | 0.00000 | 0.00000 |
| 1 | 56 | 1.22102 | 0.00000 | 0.00000 | 1.73505 | 7.75507 | 0.00000 | 0.00000 | 0.00000 | 0.00000 |
| 1 | 57 | 1.21102 | 0.00000 | 0.00000 | 4.26302 | 9.37010 | 4.06403 | 8.93215 | 0.00000 | 0.00000 |
| 1 | 58 | 1.21002 | 0.00000 | 0.00000 | 2.70302 | 8.90310 | 1.07705 | 3.54717 | 0.00000 | 0.00000 |
| 1 | 59 | 1.21002 | 0.00000 | 0.00000 | 2.67703 | 1.17508 | 0.00000 | 0.00000 | 0.00000 | 0.00000 |
| 1 | 60 | 1.18702 | 0.00000 | 0.00000 | 5.96705 | 1.26006 | 9.53103 | 2.01314 | 0.00000 | 0.00000 |
| 1 | 61 | 1.18402 | 0.00000 | 0.00000 | 7.09605 | 2.23906 | 7.61904 | 2.40415 | 0.00000 | 0.00000 |
| 1 | 62 | 1.17402 | 0.00000 | 0.00000 | 1.01904 | 4.21108 | 0.00000 | 0.00000 | 0.00000 | 0.00000 |
| 1 | 63 | 1.17302 | 0.00000 | 0.00000 | 2.79101 | 8.63711 | 2.75301 | 8.51813 | 0.00000 | 0.00000 |
| 1 | 64 | 1.17202 | 0.00000 | 0.00000 | 2.89502 | 5.96510 | 7.45202 | 1.53513 | 0.00000 | 0.00000 |
| 1 | 65 | 1.17102 | 0.00000 | 0.00000 | 2.66303 | 2.73509 | 4.58202 | 4.70614 | 0.00000 | 0.00000 |
Proton impact excitation is generally only considered to be important for fine-structure transitions within the ground or first excited states of an ion (Seaton 1964), and in the present paper we have employed the calculations of Bely & Faucher (1970) for 3s23p5 2P3/2–3s23p5 2P1/2. However, Bhatia & Doschek (1995) have generated theoretical proton rates for several of the 3s23p4(3P)3d 4DJ–3s23p4(3P)3d 4F and 3s23p4(3P)3d 4DJ–3s23p4(1D)3d 2P1/2 transitions, and they have therefore been included for completeness.
Using the atomic data discussed above in conjunction with a recently updated version of the statistical equilibrium code of Dufton (1977), relative Fe x level populations and hence emission-line strengths were calculated as a function of electron temperature (Te) and density (Ne). Details of the procedures involved and approximations made may be found in Dufton (1977) and Dufton et al. (1978). Results have been generated for a range of electron temperatures (Te = 105.5–106.4 K in steps of 0.1 dex) over which Fe x has a fractional abundance in ionization equilibrium of N(Fe x)/N(Fe) 10-4 (Bryans et al. 2006), and for Ne = 108–1013 cm-3 in steps of 0.1 dex, which should be appropriate to most coronal-type plasmas. These data are far too extensive to reproduce here, as with 90 fine-structure levels in our calculations we have intensities for 4005 transitions at each of the 510 possible (Te, Ne) combinations considered, yielding a total of over 2 million data points. However, results involving any line pair, in either photon or energy units, are freely available from one of the authors (FPK) by email on request. Given expected errors in the adopted atomic data of typically less than 20 per cent (see the references above), we estimate the theoretical ratios to be accurate to better than 30 per cent.
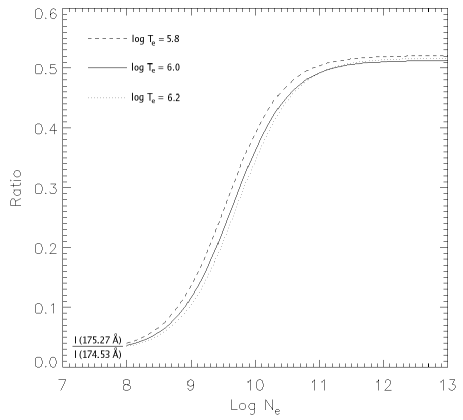
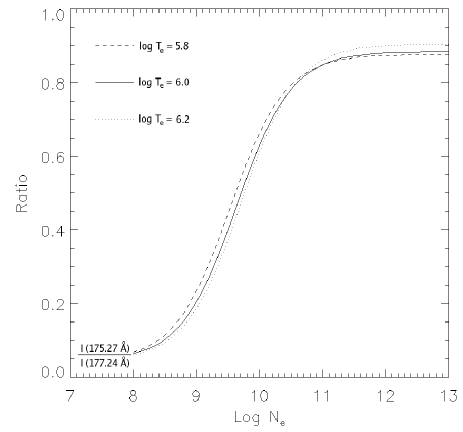
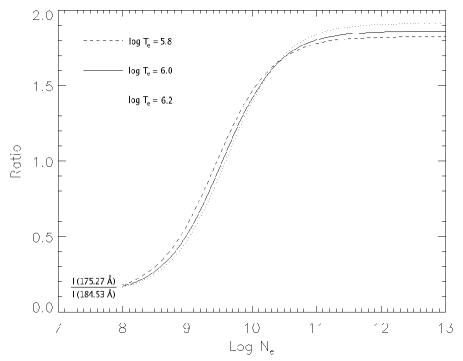
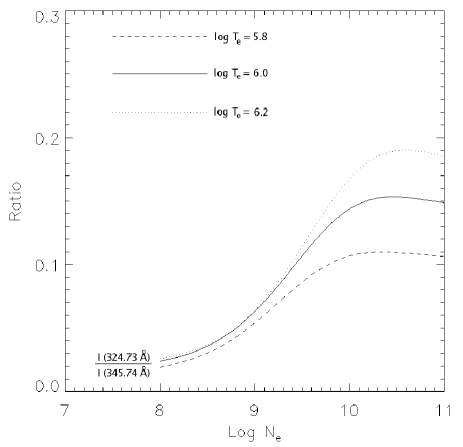
In Figs 6–10 we plot some sample theoretical emission-line ratios at the temperature of maximum Fe x fractional abundance in ionisation equilibrium, Te = 106 K (Bryans et al. 2006), plus 0.2 dex about this value. The transitions corresponding to the wavelengths given in the figures are listed in Table 1. An inspection of the figures reveals that the 175.27/174.53 and 175.27/177.24 ratios provide potentially excellent Ne–diagnostics, as they involve line pairs which are close in wavelength, vary by factors of 13.1 and 13.4, respectively, between Ne = 108 and 1011 cm-3, and show little Te–sensitivity. For example, changing Te from 106 to 106.2 K leads to a less than 5 per cent variation in both ratios at Ne = 1010 cm-3, which in turn would result in a less than 0.1 dex difference in the derived value of Ne. The usefulness of these and other ratios as Ne–diagnostics is discussed in more detail in Section 4.1.
4 Results and discussion
Following Keenan et al. (2007), we categorise emission-line ratios as three types, namely:
(i) branching ratios (i.e. where the transitions arise from a common upper level), which are predicted to be constant under normal plasma conditions. (An exception is where there is significant opacity, which does not apply to the Fe x lines considered here);
(ii) ratios which are predicted to be relatively insensitive to variations in Te and Ne over the range of plasma parameters of interest;
(iii) ratios which are predicted to be strongly Ne–sensitive, and hence potentially provide useful electron density diagnostics.
Clearly, ratios which fall into categories (i) or (ii) are the most useful for identifying and assessing the importance of blends, as well as investigating possible errors or problems with the adopted atomic data, as one does not need to reliably know the plasma electron temperature and density to calculate a line ratio for comparison with the observed value. In Tables 5 and 6 we therefore list the observed line ratios for the SERTS–89 and SERTS–95 active regions, respectively (along with the associated 1 errors), which fall into category (i) or (ii), along with theoretical values both from the present calculations and the chianti database, which employs the atomic data of Del Zanna et al. (2004). Once again, following Keenan et al. (2007), for category (ii) ratios we have defined ‘relatively insensitive’ as being those which are predicted to vary by less than 20 per cent when the electron density is changed by a factor of 2 (i.e. 0.3 dex). As noted by Keenan et al., most of the electron densities derived for the SERTS–89 and SERTS–95 active regions from species formed at similar temperatures to Fe x are consistent with log Ne = 9.40.3 for both solar features. The theoretical results in Tables 5 and 6 have therefore been calculated at the temperature of maximum Fe x fractional abundance in ionization equilibrium, Te = 106 K (Bryans et al. 2006), and for Ne = 109.4 cm-3. However, we note that changing the adopted value of Te by 0.2 dex or the density by 0.5 dex does not significantly alter the discussions below.
| Line ratio | Observed | Present | chianti |
|---|---|---|---|
| theory | theory | ||
| (i) Ratios of lines with common upper levels: | |||
| 365.57/345.74 | 0.57 0.11 | 0.41 | 0.42 |
| (ii) Ratios which are only weakly Ne–dependent:a | |||
| 256.43/345.74 | 1.9 0.7 | 0.26 | 0.29 |
| 324.73/257.25 | 0.073 0.026 | 0.047 | 0.055 |
| 337.24/345.74 | 0.18 0.09 | 0.11 | 0.22 |
aPresent theoretical ratios and those from chianti calculated at Te = 106 K and Ne = 109.4 cm-3.
| Line ratio | Observed | Present | chianti |
|---|---|---|---|
| theory | theory | ||
| (i) Ratios of lines with common upper levels: | |||
| 180.38/175.48 | 42 12 | 2.7 | 3.1 |
| 190.05/184.53 | 0.29 0.06 | 0.32 | 0.28 |
| 201.56/195.32 | 11 4 | 0.31 | 0.37 |
| 365.57/345.74 | 0.39 0.24 | 0.41 | 0.42 |
| (ii) Ratios which are only weakly Ne–dependent:a | |||
| 174.53/177.24 | 2.0 0.3 | 1.8 | 1.8 |
| 175.48/177.24 | 0.24 0.07 | 0.065 | 0.060 |
| 180.38/177.24 | 10 2 | 0.18 | 0.18 |
| 184.53/177.24 | 0.49 0.08 | 0.41 | 0.42 |
| 190.05/177.24 | 0.14 0.03 | 0.13 | 0.12 |
| 193.72/177.24 | 0.018 0.009 | 0.026 | 0.027 |
| 195.32/177.24 | 0.020 0.008 | 0.020 | 0.015 |
| 201.56/177.24 | 0.21 0.05 | 0.0064 | 0.0054 |
| 220.26/177.24 | 0.098 0.064 | 0.065 | 0.050 |
| 256.43/345.74 | 2.4 1.2 | 0.26 | 0.29 |
aPresent theoretical ratios and those from chianti calculated at Te = 106 K and Ne = 109.4 cm-3.
A comparison of the observed and theoretical 365.57/345.74 ratios in Table 5 reveals that the former is slightly larger than expected, suggesting that the 365.57 Å transition may be subject to a small amount of blending. To investigate this, we have generated a synthetic active region spectrum using chianti, which indicates blending of the Fe x feature with Ne v 365.60 Å. The latter is predicted by chianti to contribute about 50 per cent to the total line intensity, although this estimate must be treated with caution. For example, chianti adopts solar photospheric abundances, which may not be applicable. However, there are no blending species identified by chianti for the 345.74 Å line. The blending of 365.57 Å was also found by Keenan & Aggarwal (1989) in their study of Ne v lines in spectra from the S082A instrument on the Skylab mission. On the other hand, the 345.74 and 365.57 Å lines are Fe x features which can be reliably measured in several SERTS data sets, as they are relatively strong, including SERTS–95 (see Table 6). The average 365.57/345.74 ratio for a total of 4 SERTS spectra is 0.41 0.12, in excellent agreement with the theoretical value of 0.41, implying that the blending of 365.57 Å with Ne v 365.60 Å may not always be significant.
The good agreement between observation and both the present and chianti line ratio calculations for 174.53/177.24, 190.05/177.24 and 324.73/257.25 in Tables 5 and 6 indicate that these lines are well detected in the SERTS spectra and are free from blends. In particular, although chianti lists a line of Fe xii at 190.07 Å that is predicted to be about 17 per cent of the intensity of Fe x 190.05 Å, the resolution of the SERTS–95 active region spectrum is such that this feature appears as an asymmetry on the wing of the Fe x profile. Hence it could be modelled and removed from the total line intensity measurement. Furthermore, our identification of the 3s23p4(3P)3d 4D7/2–3s3p5(3P)3d 4F9/2 line at 324.73 Å is the first detection of this Fe x feature in the SERTS spectrum. Del Zanna et al. (2004) tentatively identified this transition as being a line at 327.8 Å in the SOHO/CDS quiet Sun spectrum of Brooks et al. (1999). However, we find no line at 327.8 Å, and our wavelength is in agreement with that measured by Bhatia & Doschek (1995) from spectra obtained with the S082A instrument on Skylab, as well as the laboratory spectrum determination by Smitt (1977).
The experimental 190.05/184.53 and 184.53/177.24 ratios are both in good agreement with theory, indicating that the 184.53 Å line is reliably detected, although the chianti synthetic spectrum implies a small contribution (4 per cent) from an Ar xi transition. By contrast, measured ratios with the 175.48, 180.38 or 256.43 Å lines in the numerator are all much larger than the theoretical values, due to strong blending with Fe ix 175.48 Å, Fe xi 180.38 plus Fe xvi 360.76 Å (observed in first-order), and Fe xiii 256.43 Å, respectively. However, we note that our identification of the 175.48 Å line is the first time this Fe ix/x feature has been detected in SERTS data sets, although it has been observed in spectra from other solar missions (see, for example, Behring et al. 1976). The discrepancy between the observed and theoretical 175.48/177.24 ratios indicates that Fe x makes about a 30 per cent contribution to the 175.48 Å line intensity, in agreement with chianti which predicts 35 per cent.
The good agreement between theory and observation for the 193.72/177.24 ratio confirms the tentative identification of the 193.72 Å line by Del Zanna et al. (2004) in the solar spectrum of Behring et al. (1976). Our detection is the first time this Fe x transition has been found in the SERTS data sets. Although we find no evidence of blending, chianti indicates that nearby lines of Ar xii and Fe xiv should contribute about 25 per cent to the total measured 193.72 Å line intensity. Similarly, both the present and chianti theoretical 220.26/177.24 ratios agree with experiment within the errors, supporting the tentative identification of the 220.26 Å line by Del Zanna et al. in the Behring et al. spectrum. Once again, this is the first time the line has been found in SERTS observations. The measured 220.26/177.24 ratio is approximately 50 per cent larger than the present theoretical value, implying the presence of blending, as also indicated by the large line width. This is supported by the chianti synthetic spectrum which lists several weak lines of Fe xii, Fe xv and Ni xii that are predicted to contribute about 20 per cent to the total 220.26 Å intensity, although as noted above such estimates must be treated with caution.
For the 3s23p5 2P1/2–3s23p4(1S)3d 2D3/2 transition in Fe x, we find no emission feature in the SERTS–95 spectrum at the wavelength of 201.49 Å predicted by Del Zanna et al. (2004). These authors list an alternative wavelength of 201.56 Å, which is based on an identification by Bromage, Cowan & Fawcett (1977) from a laboratory plasma. However, the feature at 201.56 Å in the SERTS–95 spectrum is clearly not due to Fe x, as shown by the large discrepancies between theory and observation for the 201.56/195.32 and 201.56/177.24 ratios in Table 6. According to the chianti synthetic spectrum, the line is a blend of Fe xi 201.55 and 201.58 Å. Although it has previously been observed in the solar spectrum (see, for example, Behring, Cohen & Feldman 1972), this is the first time the 201.56 Å feature has been detected in SERTS data sets.
The excellent agreement between theory and observation for the 195.32/177.24 ratio confirms our identification of the 195.32 Å line of Fe x, the first time (to our knowledge) that this feature has been observed in an astronomical source. However, it has been detected in a laboratory spectrum by Bromage et al. (1977). The experimental 337.24/345.74 ratio is consistent with both the present and chianti theoretical values, indicating that the 337.24 Å line is reliably detected, which is also supported by the chianti synthetic spectrum where no blending features are listed. We note that this line was identified as Ar viii by Thomas & Neupert (1994), but is clearly due to Fe x, as listed by Del Zanna et al. (2004).
Unfortunately, the 175.27 Å line is predicted to be Ne–sensitive when its ratio is taken against any other second-order transition of Fe x detected in the SERTS–95 spectrum. Hence it is not possible to generate ratios which are predicted to be independent, or even nearly independent, of the adopted density. However, Ne–diagnostics generated using the 175.27 Å feature yield results consistent with other ratios (see Section 4.1), and we therefore believe the line is free of problems and significant blending. We note that the chianti synthetic spectrum indicates no likely blending species, apart from an Fe ix transition which is only predicted to contribute about 3 per cent to the total line intensity.
4.1 Electron density diagnostics
In Tables 7 and 8 we summarise the observed values of electron-density-sensitive line-intensity ratios for the SERTS–89 and SERTS–95 data sets, respectively, along with the derived log Ne estimates. Only Fe x features which are believed to be free of significant blends, based on the above assessment, are considered. The electron densities in the tables have been determined from the present line ratio calculations at the temperature of maximum Fe x fractional abundance in ionization equilibrium, Te = 106 K (Bryans et al. 2006). However, we note that changing Te by 0.2 dex would lead to a variation in the derived values of Ne of typically 0.1 dex or less. Also listed in the tables is the factor by which the relevant ratio changes between Ne = 108 and 1011 cm-3, to show which are the most Ne–sensitive diagnostics.
| Line ratio | Observed | log Nea | Ratio variationb |
|---|---|---|---|
| 257.25/324.73 | 14 5 | 9.7 | 22 |
| 257.25/345.74 | 1.8 0.5 | 9.6 | 3.5 |
| 257.25/365.57 | 3.1 0.8 | 10.1 | 3.5 |
| 324.73/337.24 | 0.74 0.33 | 9.2 | 6.6 |
| 324.73/345.74 | 0.13 0.04 | 9.8 | 6.2 |
| 324.73/365.57 | 0.23 0.07 | 9.4 | 6.2 |
aDetermined from present line ratio calculations at Te = 106 K; Ne in cm-3.
bFactor by which the theoretical line ratio varies between Ne = 108 and 1011 cm-3.
| Line ratio | Observed | log Nea | Ratio variationb |
|---|---|---|---|
| 175.27/174.53 | 0.20 0.05 | 9.4 | 13 |
| 175.27/177.24 | 0.40 0.10 | 9.5 | 13 |
| 175.27/184.53 | 0.82 0.21 | 9.4 | 11 |
| 190.05/175.27 | 0.36 0.10 | 9.4 | 11 |
| 257.25/345.74 | 1.7 0.9 | 9.7 | 3.5 |
| 257.25/365.57 | 4.5 2.5 | 9.6 | 3.5 |
aDetermined from present line ratio calculations at Te = 106 K; Ne in cm-3.
bFactor by which the theoretical line ratio varies between Ne = 108 and 1011 cm-3.
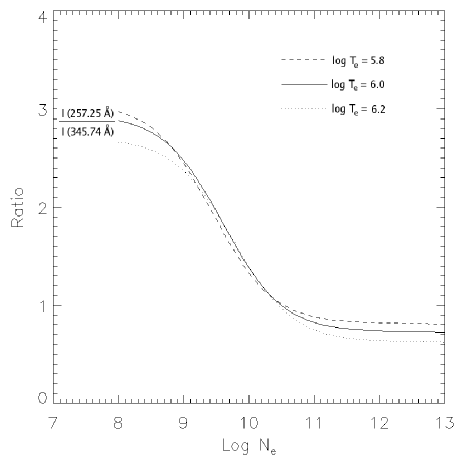
For the Fe x transitions reliably detected in first-order in the SERTS–89 spectrum (i.e. those between 257–366 Å), the best Ne–diagnostic is 257.25/345.74, as the lines are strong and unblended. However, the transitions are far apart in wavelength, so that the ratio is more susceptible to possible errors in the instrument intensity calibration. Also, the ratio is not particularly density sensitive, only changing by a factor of 3.5 between Ne = 108 and 1011 cm-3. If the 324.73 Å line is reliably measured (which is difficult as the feature is intrinsically weak), then the 324.73/345.74 ratio provides a superior diagnostic to 257.25/345.74, as the lines are closer in wavelength and it varies by a larger factor (6.2) over the 108–1011 cm-3 electron density interval. The 257.25/324.73 ratio is even more Ne–sensitive, varying by a factor of 22 between Ne = 108 and 1011 cm-3, but has the disadvantage of employing lines far apart in wavelength, albeit not to the same extent as 257.25/345.74. We note that the average electron density for the SERTS–89 active region from Table 7 is log Ne = 9.60.3, similar to that derived from line ratios in species formed at temperatures close to that of Fe x. For example, from Si x line ratios (formed at Te = 106.1 K) Keenan et al. (2000) derived log Ne = 9.20.2, while from S xii (Te = 106.3 K) Keenan et al. (2002) found log Ne = 9.50.3.
| EUVE data set | Observed | Observed | log Ne | log Ne | log Ne | log Ne | log Ne |
|---|---|---|---|---|---|---|---|
| R1a | R2a | R1b | R2b | R1c | R2c | (other)d | |
| Procyon, 1993 January 11 | 0.16 0.05 | 0.30 0.09 | 9.2 | 9.3 | 8.7 | 8.6 | 9.4 |
| Procyon, 1994 March 12 | 0.29 0.07 | 0.45 0.12 | 9.7 | 9.6 | 9.3 | 9.2 | 9.5 |
| Cen, 1993 May 29 | 0.15 0.04 | 0.20 0.06 | 9.2 | 9.0 | Le | L | 9.2 |
aR1 = 175.27/174.53; R2 = 175.27/177.24; from Foster et al. (1996).
bDetermined from present line ratio calculations at Te = 106 K.
cDetermined from Fe x line ratio calculations of Foster et al. (1996) at Te = 106 K.
dDetermined from other line ratios by Foster et al. (1996).
eIndicates that the experimental line ratio is smaller than the theoretical low density limit.
An inspection of Tables 7 and 8 clearly reveals that the best Ne–diagnostics for Fe x lie in the second-order wavelength range (175–190 Å) covered by the SERTS–95 active region spectrum. In particular, the 175.27/174.53 and 175.27/177.24 ratios involve transitions which are strong and unblended plus close in wavelength. Additionally, both ratios vary by large factors (13) between Ne = 108 and 1011 cm-3. The 175.27/184.53 and 190.05/175.27 ratios also potentially provide good diagnostics, although the relevant transitions are somewhat further apart in wavelength and hence more susceptible to possible errors in the instrument intensity calibration. We note that the values of Ne deduced for the SERTS–95 active region from the 4 ratios above are all consistent, with an average of log Ne = 9.40.1. This is in excellent agreement with the value of log Ne = 9.40.2 derived by Brosius et al. (1998b) from Fe ions formed at similar temperatures to Fe x.
Previously, Foster et al. (1996) calculated the 175.27/174.53 and 175.27/177.24 ratios of Fe x using the electron impact excitation rates of Mohan, Hibbert & Kingston (1994), and employed these as Ne–diagnostics for Procyon and Cen via a comparison with observations from the Extreme Ultraviolet Explorer (EUVE) satellite. However, Foster et al. found that the electron densities derived from Fe x showed large discrepancies (up to an order of magnitude) with those deduced from other density-sensitive line ratios in the EUVE spectra. To investigate this, in Table 9 we list the EUVE line ratio measurements for Fe x along with the electron densities derived from the Foster et al. and present line ratio calculations. An inspection of the table reveals that the electron densities deduced from the current theoretical estimates of 175.27/174.53 and 175.27/177.24 are consistent, and furthermore agree with the values of Ne determined from other line ratios, hence resolving the discrepancies found by Foster et al. However, we should point out that the discrepancies are also resolved if theoretical line ratios from chianti are employed.
Finally, we note that Datla, Blaha & Kunze (1975) have measured several Fe x extreme-ultraviolet line ratios in a -pinch under well-determined plasma conditions, hence allowing some independent assessment of the accuracy of our theoretical results. In Table 10 we summarise their experimental line ratios, along with the theoretical values for the measured plasma conditions from both the present calculations and chianti. An inspection of the table reveals that the measured 190.05/174.53 ratios are always larger than theory, which is expected as the 190.05 Å line will be blended with Fe xii 190.07 Å in the -pinch spectra, as these are of somewhat lower resolution (approximately 0.1 Å) than the SERTS data, where the two features are resolved (see above). For the other ratios, agreement between theory and experiment is reasonable, given that the measurements are estimated to be accurate to only 20–30 per cent. In most instances, agreement is slightly better with the present line ratio calculations, but once uncertainties are taken into account the observations are consistent with both sets of theoretical results. The Datla et al. measurements therefore provide some experimental support for the two atomic physics data sets adopted in the relevant line ratio calculations.
| Measured plasma parameters | Ratio | Observeda | Present | chianti |
|---|---|---|---|---|
| theoryb | theory | |||
| Te = 1.65106 K; Ne = 1.21016 cm-3 | 177.24/174.53 | 0.81 | 0.57 | 0.56 |
| 190.05/174.53 | 0.22 | 0.087 | 0.076 | |
| 365.57/174.53 | 0.032 | 0.031 | 0.021 | |
| Te = 1.10106 K; Ne = 1.41016 cm-3 | 177.24/174.53 | 0.59 | 0.58 | 0.55 |
| 190.05/174.53 | 0.14 | 0.088 | 0.077 | |
| 365.57/174.53 | 0.021 | 0.040 | 0.025 |
aFrom Datla et al. (1975).
bPresent theoretical line ratios and those from chianti calculated for the measured plasma parameters.
5 Conclusions
Our comparison of theoretical Fe x emission-line intensity ratios with solar active region spectra from the SERTS 1989 and 1995 flights reveals generally very good agreement between theory and experiment, with several features identified for the first time in the SERTS data sets, including Fe x 193.72, 220.26 and 324.73 Å, plus Fe xi 201.56 Å and the Fe ix/x blend at 175.48 Å. In addition, the 195.32 Å transition of Fe x is detected for the first time (to our knowledge) in an astronomical source.
We find that the ratios 175.27/174.53 and 175.27/177.24 provide the best Fe x electron density diagnostics, as they involve lines which are strong and free from blends, are close in wavelength and the ratios are highly Ne–sensitive. Should these lines not be available, then the 257.25/345.74 ratio may be employed as a diagnostic, although this requires an accurate determination of the instrument intensity calibration over a relatively large wavelength range. However, if the weak 324.73 Å line is reliably detected, then the use of 324.73/345.74 or 257.25/324.73 is recommended in preference to 257.25/345.74.
Acknowledgments
KMA acknowledges financial support from EPSRC, while DBJ is grateful to the Department of Education and Learning (Northern Ireland) and NASA’s Goddard Space Flight Center for the award of a studentship. The SERTS rocket programme is supported by RTOP grants from the Solar Physics Office of NASA’s Space Physics Division. JWB acknowledges additional NASA support under grant NAG5–13321. FPK is grateful to AWE Aldermaston for the award of a William Penney Fellowship. The authors thank Peter van Hoof for the use of his Atomic Line List. chianti is a collaborative project involving the Naval Research Laboratory (USA), Rutherford Appleton Laboratory (UK), and the Universities of Florence (Italy) and Cambridge (UK).
References
- (1) Aggarwal K.M., Keenan F.P., 2004, A&A, 427, 763
- (2) Aggarwal K.M., Keenan F.P., 2005, A&A, 439, 1215
- (3) Behring W.E., Cohen L., Feldman U., 1972, ApJ, 175, 493
- (4) Behring W.E., Cohen L., Feldman U., Doschek G.A., 1976, ApJ, 203, 521
- (5) Bely O., Faucher P., 1970, A&A, 6, 88
- (6) Bhatia A.K., Doschek G.A., 1995, Atom. Data Nucl. Data Tables, 60, 97
- (7) Bromage G.E., Cowan R.D., Fawcett B.C., 1977, Phys. Scripta, 15, 177
- (8) Brooks D.H. et al., 1999, A&A, 347, 277
- (9) Brosius J.W., Davila J.M., Thomas R.J., Monsignori-Fossi B.C., 1996, ApJS, 106, 143
- (10) Brosius J.W., Davila J.M., Thomas, R.J., 1998a, ApJ, 497, L113
- (11) Brosius J.W., Davila J.M., Thomas, R.J., 1998b, ApJS, 119, 255
- (12) Bryans P., Badnell N.R., Gorczyca T.W., Laming J.M., Mitthumsiri W., Savin D.W., 2006, ApJS, 167, 343
- (13) Culhane J.L. et al., 2007, Solar Phys., 243, 19
- (14) Datla R.U., Blaha M., Kunze H.-J., 1975, Phys. Rev. A, 12, 1076
- (15) Dere K.P., 1978, ApJ, 221, 1062
- (16) Del Zanna G., Berrington K.A., Mason H.E., 2004, A&A, 422, 731
- (17) Dere K.P., Landi E., Mason H.E., Monsignori-Fossi B.C., Young P.R., 1997, A&AS, 125, 149
- (18) Dufton P.L., 1977, Comput. Phys. Commun., 13, 25
- (19) Dufton P.L., Berrington K.A., Burke P.G., Kingston A.E., 1978, A&A, 62, 111
- (20) Foster V.J., Mathioudakis M., Keenan F.P., Drake J.J., Widing K.G., 1996, ApJ, 473, 560
- (21) Jordan C., 1965, Phys. Lett., 18, 259
- (22) Jordan C., 1966, MNRAS, 132, 515
- (23) Keenan F.P., Aggarwal K.M., 1989, Solar Phys., 122, 1
- (24) Keenan F.P. et al., 2000, MNRAS, 315, 450
- (25) Keenan F.P. et al., 2002, ApJ, 566, 521
- (26) Keenan F.P., Katsiyannis A.C., Brosius J.W., Davila J.M., Thomas R.J., 2003, MNRAS, 342, 513
- (27) Keenan F.P., Aggarwal K.M., Ryans R.S.I., Milligan R.O., Bloomfield D.S., Brosius J.W., Davila J.M., Thomas R.J., 2005, ApJ, 624, 428
- (28) Keenan F.P., Jess D.B., Aggarwal K.M., Thomas R.J., Brosius J.W., Davila J.M., 2007, MNRAS, 376, 205
- (29) Landi E., Del Zanna G., Young P.R., Dere K.P., Mason H.E., Landini M., 2006, ApJS, 162, 261
- (30) Mohan M., Hibbert A., Kingston A.E., 1994, ApJ, 434, 389
- (31) Neupert W.M., Epstein G.L., Thomas R.J., Thompson W.T., 1992, Solar Phys., 137, 87
- (32) Nussbaumer H., 1976, A&A, 48, 93
- (33) Pelan J.C., Berrington K.A., 2001, A&A, 365, 258
- (34) Seaton M.J. 1964, MNRAS, 127, 191
- (35) Smitt R., 1977, Solar Phys., 51, 113
- (36) Träbert E., Saathoff G., Wolf A., 2004, J. Phys. B, 37, 945
- (37) Thomas R.J., Neupert W.M., 1994, ApJS, 91, 461
- (38) Young P.R. et al., 2007, PASJ, 59, S857