PACIAE Model Predictions for Collisions at LHC Compared to the Collisions at RHIC
Abstract
The parton and hadron cascade model PACIAE is used to simulate the 0-6, 15-25,
and 35-45% most central collisions at =19.6, 62.4,
130, and 200 GeV and the 0-10% most central collisions at
=5500 GeV. The calculated charged multiplicity and the
charged particle transverse momentum distribution, pseudorapidity distribution,
and extended longitudinal scaling for collisions well agree with
the corresponding PHOBOS data. Thus the above observables calculated for
collisions would be a reliable prediction.
PACS numbers: 25.75.Dw, 24.85.+p
In Ref. arm1 the predictions of variety models for collisions at LHC energy (=5500 GeV) have been compiled including the thermal (statistical) models my . The basic assumption in thermal model is that the final state hadrons in relativistic heavy-ion collisions are originated from a thermal source of a given thermal parameters of temperature and baryonic chemical potential cley . In peter a parametrization of the temperature and baryonic chemical potential as a function of (in GeV) is obtained from the fits of calculated particle yields and ratios to the experimental data at mid-rapidity over a broad energy range of =2.7-200 GeV. Then they extend above parametrization to the LHC energy and provide a quantitative prediction for LHC experiments.
Similarly, the transport models are also unable to be in agreement with the experimental data of nucleus-nucleus collisions in a broad energy range from AGS to SPS, RHIC, and even to LHC without adjusting any parameters. Of course, the less number of adjusting parameters the better the model is. In this letter the parton and hadron cascade model, PACIAE, is used to simulate the 0-6% (15-25 and 35-45%) most central collisions at = 19.6, 62.4, 130, and 200 GeV and the 0-10% most central collisions at =5500 GeV. The charged multiplicity and the charged particle transverse momentum distribution, pseudorapidity distribution, and extended longitudinal scaling are calculated. In the calculations we fix all model parameters, except the parameter in Lund string fragmentation function sjo
| (1) |
This function expresses the probability that a given is picked, here refers to the fraction of string energy (momentum) taken away by the produced hadron. In Eq. (1) the is transverse mass of hadron, and are, respectively, the transverse momentum and rest mass of hadron, and the and are parameters. As mentioned in sa2 that the parameter is varied with string density and the higher reaction energy (temperature) is corresponding to the lager . According to the experimental facts that the temperature of fireball, in relativistic heavy-ion collisions, as a function of increases dramatically first and then approaching saturation gradually brat , we assume to be approximately a function of as
| (2) |
where =6. As the calculated above observables in collisions are in good agreement with PHOBOS data (see later), the calculated those observables in collisions are thus a reliable prediction.
| Au+Au | Pb+Pb | ||||
| Energy | 19.6 | 62.4 | 130 | 200 | 5500 |
| (GeV) | |||||
| Centrality | 0-6% | 0-10% | |||
| Multiplicity | |||||
| Exp. | 16891001 | 28451422 | 41702101 | 50602501 | |
| PACIAE | 1533 | 2919 | 4140 | 5001 | 14695 |
| 2503 | 4253 | 5593 | 6413 | 11964 | |
| b | 0.58 | 2 | 4 | 6 | 12 |
| 1 PHOBOS data taken from phob1 . | |||||
| 2 PHOBOS data taken from phob2 . | |||||
| 3 Estimated from calculations in 0.21.4 . | |||||
| 4 Estimated from calculations in 0.12 . | |||||
The parton and hadron cascade model, PACIAE sa , is based on PYTHIA (the model for hadron-hadron collision) sjo and is composed of four stages: the parton initialization, parton evolution (scattering), hadronization, and hadron evolution (rescattering).
-
1.
Parton initialization:
In the PACIAE model the nucleus-nucleus collision is decomposed into nucleon -nucleon (NN) collisions according to the geometry of nucleus-nucleus collision. A NN collision is performed by the PYTHIA model sjo with the hadronization process switched-off. Thus the consequence of a nucleus-nucleus collision is a state composed of quark pairs, diquark pairs, gluons, and very few hadronic remnants. If the diquark (anti-diquark) is split forcedly into quarks (anti-quarks) randomly, the partonic initial state of a nucleus-nucleus collision is reached.
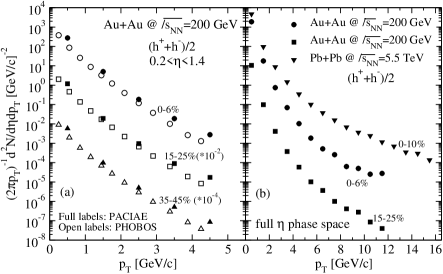
Figure 1: The charged particle transverse momentum distributions in collisions at =200 GeV and collisions at =5500 GeV. PHOBOS data are taken from phob3 . -
2.
Parton evolution (scattering):
The parton initialization stage is followed by parton evolution (scattering). Here the LO-pQCD differential cross sections comb are employed. The differential cross section of a sub-process reads(3) where the factor is introduced counting for the higher order pQCD and non-perturbative QCD corrections, stands for the strong (running) coupling constant, and , , and are the Mandelstam variables. For the process , for instance, one has
(4) It diverges at =0 and has to be regularized by introducing the parton colour screen mass as follows
(5) The total cross section of the parton collision is then
(6) With above total and differential cross sections the parton evolution (parton scattering) can be simulated by the Monte Carlo method.
-
3.
Hadronization:
The hadronization at the moment of partonic freeze-out (no more partonic collision at all) is consequent on the parton evolution stage. In the PACIAE model, the phenomenological fragmentation model (String Fragmentation, Independent Fragmentation, or Cluster Fragmentation) sjo and the coalescence model are supplied for hadronization of partons after scattering. The String Fragmentation model is adopted in this letter. We refer to sa for the details of the hadronization stage.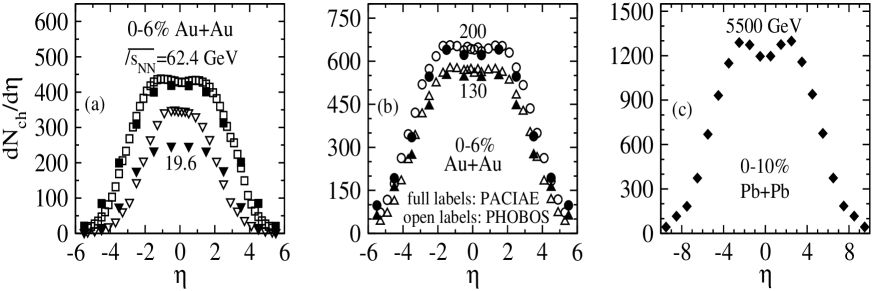
Figure 2: The charged particle pseudorapidity distributions in 0-6% most central collisions at =19.6, 62.4, 130, and 200 GeV and in 0-10% most central collisions at =5500 GeV. The full labels are calculated results by the PACIAE model and the open labels are the corresponding PHOBOS data. PHOBOS data are taken from phob1 (for =19.6, 130, and 200 GeV) and phob2 (for =62.4 GeV). -
4.
Hadron evolution (rescattering):
After hadronization the rescattering among produced hadrons is dealt with the usual two-body collision model. The details of hadronic rescattering can see sa1 .
We compare the calculated charged multiplicity with the PHOBOS data (taken from phob1 ; phob2 ) in 0-6% most central collisions at =19.6, 62.4, 130, and 200 GeV in Table 1. One sees here that the PHOBOS data are well reproduced within error bars by the PACIAE calculations, except the case of =19.6 GeV. That is consistent with the fact that the PYTHIA model is more suitable for higher reaction energy. The predicted charged multiplicity and charged particle pseudorapidity density at mid-pseudorapidity in 0-10% most central collisions at =5500 GeV is also given in this table. That pseudorapidity density, 1200, is within the predicted values of other sixteen models listed in arm2 .
In Fig. 1 (a) we compare the calculated charged particle transverse momentum distributions with the corresponding PHOBOS data (taken from phob3 ) in collisions at =200 GeV. Here the open circles, squares, and triangles are, respectively, the PHOBOS data of the 0-6, 15-25, and 35-45% most central collisions and the full labels are the PACIAE model results. We see in panel (a) that the PHOBOS data are reasonably good reproduced. The prediction for charged particle transverse momentum distribution (triangles-down) in 0-10% most central collisions at =5500 GeV are given in Fig. 1 (b). For comparison, the charged particle transverse momentum distributions in 0-6 (circles) and 15-25% (squares) most central at =200 GeV are also given in panel (b). Note that the charged particle transverse momentum distributions shown in Fig. 1 (b) is integrated over full pseudorapidity.
Figure 2 shows the charged particle pseudorapidity distributions in 0-6% most central collisions at =19.6 and 62.4 GeV (panel (a)) and at =130 and 200 GeV (panel (b)) and in 0-10% most central collisions at =5500 GeV (panel (c)). In this figure the open labels are the PHOBOS data and the full labels are the PACIAE model results. The squares and triangles-down in panel (a) are, respectively, for =62.4 and 19.6 GeV and the circles and triangles-up in panel (b) are, respectively, for =200 and 130 GeV. One sees again in panels (a) and (b) that the PHOBOS data are reasonably good reproduced, except the case of =19.6 GeV. Fig. 2 (c) gives the PACIAE model prediction for the charged particle pseudorapidity distribution in 0-10% most central collisions at =5500 GeV. In panel (c) one sees that there is a deep valley at the mid-pseudorapidity.
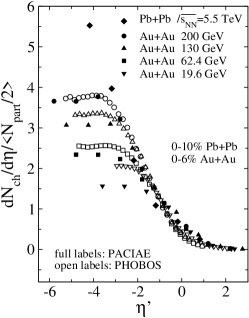
In Fig. 3 we give the shifted charged particle pseudorapidity distributions in 0-6% most central collisions at = 19.6 (triangles-down), 62.4 (squares), 130 (triangles-up), and 200 GeV (circles) and in 0-10% most central collisions at =5500 GeV (diamonds). Here the shifted pseudorapidity is
| (7) |
where is the beam rapidity. We see in Fig. 3 that
the extended longitudinal scaling phob2 is well kept not only among
collisions at a variety values of but also among
and collisions.
In summary, we have used the parton and hadron cascade model PACIAE to
simulate the 0-6, 15-25, and 35-45% most central collisions at
=19.6, 62.4, 130, and 200 GeV and the 0-10% most central
collisions at =5500 GeV. The charged multiplicity
and the charged particle transverse momentum distribution, pseudorapidity
distribution, and extended longitudinal scaling are calculated. For
collisions the calculated above observables are in good agreement with the
corresponding PHOBOS data. Thus the above observables calculated for
collisions would be a reliable prediction.
The financial support from NSFC (10475032, 10605040, and 10635020) in China are acknowledged.
References
- (1) N. Armesto, et al., J. Phys. G: Nucl. Part. Phys. 35, 054001 (2008).
- (2) The compilation of Ref. arm1 was published after the workshop held at the CERN Theory Institute from May 14 to June 10 2007. We lost that opportunity and have to give our predictions by the parton and hadron cascade model PACIAE in this letter together with the comparisons between PACIAE model results and PHOBOS data for collisions at =19.6, 62.4, 130, and 200 GeV.
- (3) I. Kraus, J. Cleymans, H. Oeschler, K. Redlich, and Wheaton, hep-ph/0608114v1.
- (4) A. Andronic, P. Braun-Munzinger, J. Stachel, Nucl. Phys. A 772, 167 (2006).
- (5) T. Sjoestrand, Compu. Phys. Commun. 82, 74 (1994).
- (6) Ben-Hao Sa and An Tai, J. Phys. G: Nucl. Part. Phys. 31, 1031 (2005).
- (7) E. L. Bratkovskaya, M. Bleicher, M. Reiter, S. Soff, and H. Stoeker, Phys. ReV. C 69, 054907 (2004).
- (8) Dai-Mei Zhou, Xiao-Mei Li, Bao-Guo Dong, and Ben-Hao Sa, Phys. Lett. B 638, 461 (2006); Ben-Hao Sa, Xiao-Mei Li, Shou-Yang Hu, Shou-Ping Li, Jing Feng, and Dai-Mei Zhou, Phys. Rev. C 75, 054912 (2007).
- (9) B. L. Combridge, J. Kripfgang, and J. Ranft, Phys. Lett. B 70, 234 (1977).
- (10) Ben-Hao Sa and An Tai, Comput. Phys. Commun. 90, 121 (1995); An Tai and Ben-Hao Sa, Comput. Phys. Commun. 116, 353 (1999).
- (11) B. B. Back, et al., PHOBOS collaboration, Phys. Rev. Lett. 91, 052303 (2003).
- (12) B. B. Back, et al., PHOBOS collaboration, Phys. Rev. C 74, 021901(R) (2006).
- (13) N. Armesto, arXiv:0804.4158v1.
- (14) B. B. Back, et al., PHOBOS collaboration, Phys. Lett. B 578, 297 (2004).