Correlations between Mid-Infrared, Far-Infrared, H, and FUV Luminosities for SWIRE-field Galaxies
Abstract
We present and analyze the correlations between mid-infrared (MIR), far-infrared (FIR), total-infrared (TIR), H, and FUV luminosities for star-forming galaxies, composite galaxies and AGNs, based on a large sample of galaxies selected from the SWIRE fields. The MIR luminosities of star-forming galaxies are well correlated with their H, TIR and FUV luminosities, and we re-scaled the MIR-derived SFR formulae according to the above correlations with differences less than 15%. We confirm the recent result by Calzetti et al. (2007) that the combined observed H 24m luminosities L(Hobs 24m) possess very tight correlation with the extinction-corrected H luminosities L(Hcorr) for star-forming and even for dwarf galaxies, and show that the combined L(Hobs 8m[dust]) are also tightly correlated with L(Hcorr) for the above sample galaxies. Among all the L(MIR)-L(FIR) correlations for star-forming galaxies, the L(24m) vs. L(70m) and L(8m[dust]) vs. L(160m) are the tightest and also nearly linear. The former could be related to young massive star formation, while the latter might be relevant to diffuse dust emissions heated by old stellar populations. Composite galaxies and AGNs have higher MIR-to-H/MIR-to-FUV luminosity ratios than star-forming galaxies, nevertheless their correlations among MIR, FIR and TIR luminosities are completely following those of star-forming galaxies.
1 Introduction
Since the successful launch of () in 1983, more advanced space-based infrared telescopes had been launched, such as (; Kessler et al., 1996) and (Werner et al., 2004), to help as to study the MIR to FIR emission properties of galaxies. MIR to FIR emissions are crucial for quantifying extragalactic star formation activities, since infrared emissions are arising from the dust re-radiation of UV photons emitted by young massive stars. FIR luminosity has been proved to be a good star formation rate (SFR) indicator of galaxies by observations (e.g., Hunter et al., 1986; Lehnert & Heckman, 1996). However, the low sensitivity and spatial resolution of FIR observations obstructed us from applying it to most galaxies at intermediate and high redshifts, even though there are some degree of improvements in the and era. Optical/UV SFR tracers, such as H-line emission and FUV continuum luminosities, are important because they are still the only way to measure SFR in regions of low extinction such as faint, dwarf galaxies and especially extended UV disk (XUV-disk) galaxies (Thilker et al., 2007). But these tracers usually suffer from serious extinction effects for normal and especially infrared-bright galaxies which are difficult to be corrected (Jonsson, 2004). MIR emissions of normal galaxies are dominated by dust continuum from very small grains (VSGs), together with some broad emission features (Gillett et al., 1973; Willner et al., 1977) which were realized to be from polycyclic aromatic hydrocarbons (PAHs; Léger & Puget, 1984; Puget & Léger, 1989). Early analysis of correlations between MIR luminosity (derived from observations) and other SFR tracers (e.g., Elbaz et al., 2002; Roussel et al., 2001; Förster Schreiber et al., 2004; Flores et al., 2004) have shown that the MIR luminosity could be used to estimate SFRs of galaxies.
Mid-Infrared observations by with higher sensitivity and better angular resolution than , provide a new opportunity to study young stellar populations and star formation processes in galaxies. The 8m band of Infrared Array Camera (IRAC; Fazio et al., 2004) is designed to cover the 7.7m PAH feature; whilst the 24m band of Multiband Imaging Photometer for (MIPS; Rieke et al., 2004) just covers the dust continuum from VSGs for local galaxies, avoiding the contamination of most of the MIR emission or absorption lines. The pioneering work by Wu et al. (2005) (hereafter Wu05) has shown that, for star-forming galaxies, both IRAC 8m(dust) and MIPS 24m luminosities are strongly correlated with the 1.4 GHz radio and H luminosities. Then the new formulae for estimating SFRs of galaxies were derived from MIR luminosities based on above correlations. Detailed studies of nearby galaxies M 51 (Calzetti et al., 2005) and M 81 (Pérez-González et al., 2006) revealed that the 24m luminosities of star-forming regions in the above two galaxies were well correlated with the extinction-corrected Pa luminosities. Based on the 8m and 24m data for HII regions in 33 nearby SINGS ( Infrared Nearby Galaxies Survey; Kennicutt et al., 2003) galaxies, Calzetti et al. (2007) found that both 8m(dust) and 24m luminosities are correlated with L(Pacorr), but non-linearly. They and Kennicutt et al. (2007) also demonstrated that the combination of observed H (uncorrected for dust extinctions) and 24m luminosities could be one of the best SFR indicator for HII regions in these galaxies.
Besides being heated by young massive stars, the energy source of MIR and FIR emissions could also be the active galactic nuclei (AGN) in the galactic center, since AGNs are also powerful UV emitters. Weak AGN-hosting galaxies are very popular in the local universe (Ho et al., 1997), thus the possible AGN contribution to MIR and FIR emissions could have significant impact on the estimation of cosmic SFR density and the understanding of its evolution (see, e.g, Bell et al., 2005; Pérez-González et al., 2006; Elbaz et al., 2007; Daddi et al., 2007). Previous works showed that powerful AGNs can strengthen MIR VSG emissions, but weaken or even avoid PAH emissions (Weedman et al., 2005; Siebenmorgen et al., 2004; Verma et al., 2005). Weak AGNs are found to have MIR properties different from that of star-forming galaxies (Wen et al., 2007; Li et al., 2007), and the degree of such differences could be related to the AGN activity (Wu et al., 2007).
The Wide-area Infrared Extragalactic Survey (SWIRE; Lonsdale et al., 2003) is the largest extragalactic survey program among the six cycle-1 Legacy Programs. With a total field of 49 deg2, it is much larger than the First Look Survey (FLS) field (3.7 deg2) studied by Wu et al. (2005). In this paper, we perform statistical analysis on the correlations between MIR, FIR, H, and FUV luminosities for star-forming galaxies, composite galaxies (which were affected by both central nuclear and star formation activities), and AGNs selected from three northern SWIRE fields.
The structure of the paper is as follows. We describe the construction of our sample and the estimation of multi-wavelength luminosities in 2 and 3. The major results on correlation analysis are presented in 4. Some discussions and a summary of this work are given in 5 and 6. Throughout this paper, we adopted a CDM cosmology with , and .
2 Sample and Data Reduction
2.1 SDSS Sample
The optical spectral sample galaxies are selected from the Sloan Digital Sky Survey (SDSS; York et al., 2000) main galaxy sample (Strauss et al., 2002), with -band Petrosian magnitudes less than 17.77 mag. The SDSS main galaxy sample covers three northern SWIRE fields: most of the Lockman Hole (center: 14 41 00, +59 25 00) and ELAIS-N2 (center: 16 36 48, +41 01 45), and about 1/3 of ELAIS-N1 (center: 16 11 00, +55 00 00). The overlay regions used in this paper is about deg2. A total of galaxies were selected with available H and H emission line fluxes (), based on the emission line catalog of SDSS DR4 111http://www.mpa-garching.mpg.de/SDSS/DR4/; see also Tremonti et al. (2004)..
2.2 MIR Sample
The IRAC four bands (3.6, 4.5, 5.8 and 8.0 m) images were mosaicked from the Basic Calibrated Data (BCD; acquired from the Sciences Center) after flat-field corrections, dark subtraction, linearity and flux calibrations (Fazio et al., 2004; Huang et al., 2004), with the final pixel scale of 0.6 (Wu et al., 2005; Cao & Wu, 2007; Cao et al., 2008). The MIPS 24m images were mosaicked as the same way but with the pixel scale of 1.225 (Wen et al., 2007; Cao & Wu, 2007; Wu et al., 2007). Based on the catalogs of the Two Micron All Sky Survey (2MASS; Cutri et al., 2003), we obtained the accuracy of the astrometric calibration around 0.1 in all the five bands.
We obtained the and magnitudes for all the sources in the three SWIRE fields detected by SExtractor (Bertin & Arnouts, 1996). The magnitudes were used to denote the luminosities of detected sources. Hereafter, the magnitudes were represented by the magnitudes for these five MIR bands. Aperture photometries with 3 and 6 diameters were adopted for the IRAC four bands and MIPS 24m band images, respectively.
The aperture corrections for the IRAC four band photometries (corrected to an aperture of 24) are: 0.66, 0.64, 0.80 and 1.00, respectively. We re-calibrated the IRAC magnitudes with the aid of 2MASS photometric catalog, according to Lacy et al. (2005) and Eisenhardt et al. (2004). Firstly, we selected blue 2MASS field stars (F7 dwarfs) with color less than 0.3. To ensure accurate photometry and avoid saturated sources in IRAC 3.6m images, the K-band magnitudes were restricted within 10 to 14 mags; and then, the measured AB magnitudes in each IRAC band were converted to Vega magnitudes by adding factors of 2.79, 3.26, 3.73 and 4.40 222http://spider.ipac.caltech.edu/staff/gillian/cal.html, respectively; afterwards, we compared the four colors with ‘’ from Bessel & Brett (1988) and adopted the averaged values of 0.04, -0.04, -0.03 and 0.07 (based on Table 1) as the corrections for each band. The final flux calibration uncertainties of all the four IRAC bands are less than 0.08 mag. The 6 aperture photometry of MIPS 24m band was corrected to an aperture of 30 , with an aperture correction value of 1.21. Following the procedure used by the MIPS instrument team to derive calibration factors from standard star observations, we corrected an additional calibration factor of 1.15. A factor of 0.96 was divided in order for Fν equating constant scale 333http://swire.ipac.caltech.edu/swire/astronomers/publications/SWIRE2doc083105.pdf. The final MIPS 24 m flux has a calibration uncertainty less than 10% (Rieke et al., 2004).
To construct the MIR galaxy sample, we cross-matched these MIR sources with the above SDSS sample galaxies with a radius of 2. Only out of the SDSS galaxy are mismatched. Most of these sources are edge-on galaxies or have bright neighbors. The completeness of the MIR sample is 98%, since the sensitivity of MIR bands is much deeper than that of SDSS spectroscopic observations. For the purpose of this work, we need both and magnitudes in at least four MIR bands: IRAC 3.6, 5.8, 8 m, and MIPS 24m. Therefore, another galaxies were rejected because of their locations at the edge of overlay regions of SDSS and/or images. The final number of our MIR sample galaxies is .
2.3 FIR Sample
The MIPS 70 and 160m band photometry catalogs of SWIRE northern fields were derived from the SWIRE data release 3 444http://swire.ipac.caltech.edu/swire/astronomers/dataaccess.html. The 70m catalog was cross-matched with the 160m catalog with a radius of 11, and then cross-matched with the MIR sample with a radius of 4. Since we need to calculate the total infrared (TIR) luminosity, only the sources with detectable fluxes in all three MIPS bands were selected. The final FIR sample includes galaxies. The point-response function (PRF) magnitudes were adopted as total magnitudes in this work, and the absolute flux uncertainties are 20% and 30% for the two bands, respectively 555http://swire.ipac.caltech.edu/swire/astronomers/publications/SWIRE2doc083105.pdf.
2.4 UV Sample
The (; Martin et al., 2005) General Data Release 2 (GR2) and General Data Release 3 (GR3) 666http://galex.stsci.edu/GR2/ have been released to public in spring 2006 and summer 2007. Two UV bands were used: the far-UV (FUV) band covering 135-175 nm and the near-UV (NUV) band covering 175-275 nm. The UV catalogs were taken from pipeline-processed GALEX Deep Imaging Survey (DIS) (mAB25; Martin et al., 2005) observations of three northern SWIRE fields. The sources with calibrated Kron magnitudes in both NUV and FUV bands were selected. After cross-matched with the MIR sample with radius of 4, galaxies were left. We need to use the formula from Treyer et al. (2007) to compute the intrinsic extinction of the sources, but this formula is not suitable for the red sequence galaxies, which were defined with the color 4 (at redshift 0.1). Finally, galaxies were included in our UV sample. The calibration accuracy of the measurements is about 3% 777http://galexgi.gsfc.nasa.gov/docs/galex/Cycle3/.
2.5 Spectral Classification
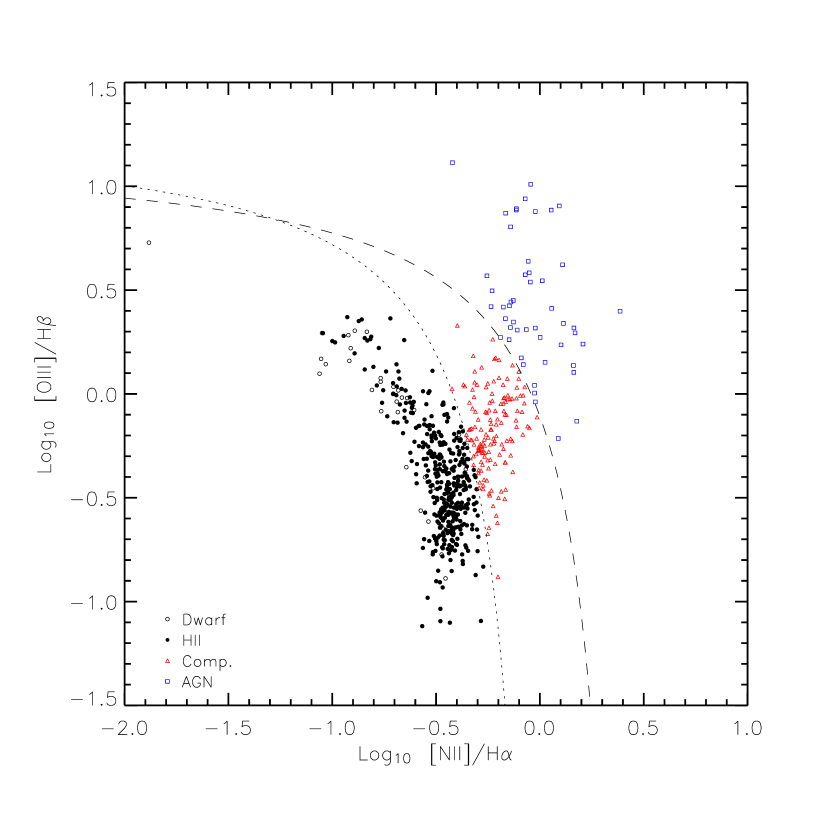
The optical spectral classifications of galaxies were made by adopting the traditional BPT diagnostic diagram: [NII]/H versus [OIII]/H (Baldwin et al., 1981; Veilleux & Osterbrock, 1987), as shown in Figure 1. The dashed curve is from Kauffmann et al. (2003) (hereafter Ka03 line) and the dotted curve is from Kewley et al. (2001) (hereafter Ke01 line). The objects located below the Ka03 line were classified as star-forming galaxies; those above the Ke01 line were classified as narrow-line AGNs (note we did not distinguish Seyfert 2s from LINERs (Heckman, 1980) here); those between the above two lines were classified as composite (starburst AGN) galaxies (Kewley et al., 2006). Composite galaxies are similar to mixture-type galaxies defined by Wu et al. (1998), which were based on three diagnostic diagrams (adding [SII]/H vs. [OIII]/H and [OI]/H vs. [OIII]/H) from Veilleux & Osterbrock (1987): if the classification of a source in the three diagnostic diagrams is different (e.g., it was shown in one diagram as a star-forming galaxy, but could be classified as a AGN by the others), then it was categorized as a mixture-type galaxy (Wu et al., 1998). The numbers on spectral classifications of our MIR, FIR and UV samples are shown in Table 2.
2.6 Sample Distribution
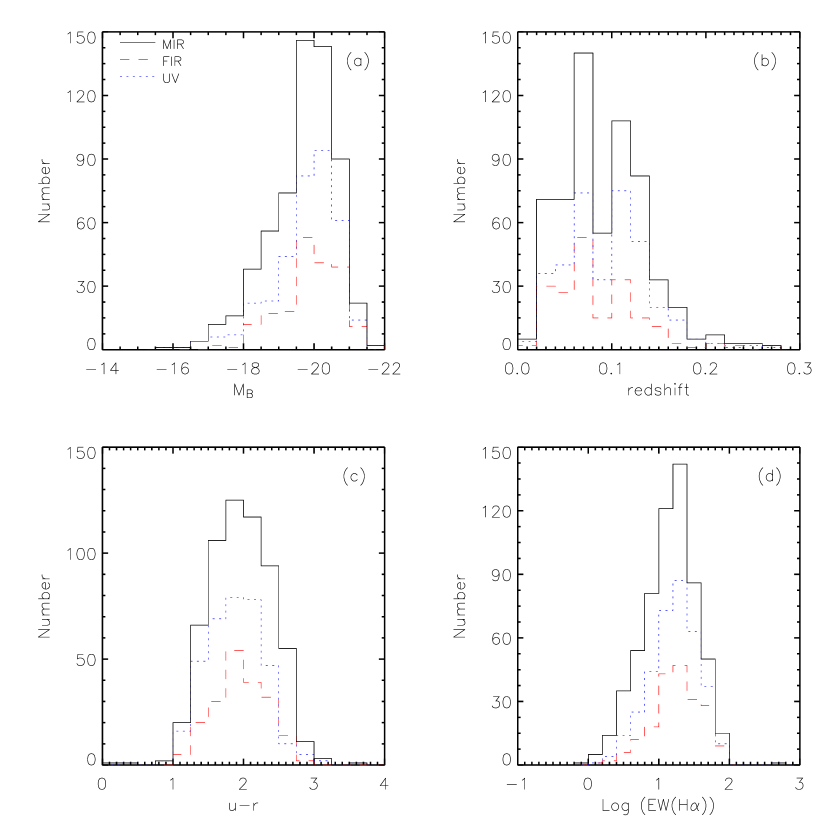
The distributions of the SDSS B-band absolute magnitude (MB), redshift, color, and equivalent width of H line emission (EW[H]) for our MIR, FIR and UV sample galaxies are shown in Figure 2. Most of the galaxies have MB brighter than 18 mag and redshift less than 0.2. Only a few of them have magnitudes lower than 18 mag, which belong to dwarf galaxies (Thuan & Martin, 1981). Here, MB were calculated from the SDSS and -band magnitudes according to Smith et al. (2002). The three galaxy samples do not show obvious differences in all of the above distributions.
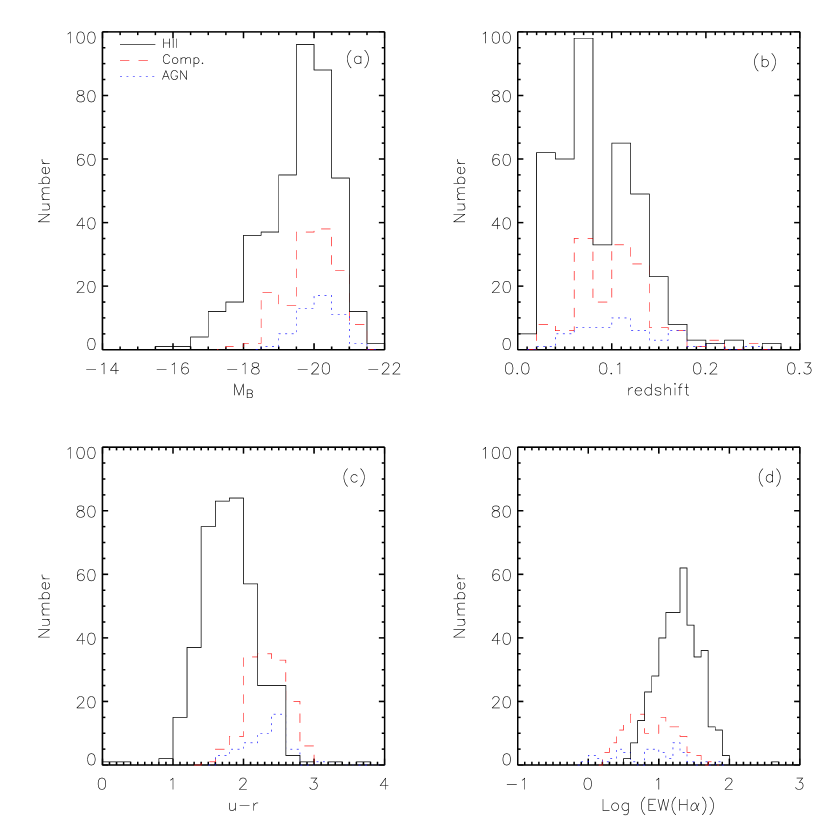
Figure 3 shows the above four distributions for three different spectral type galaxies (star-forming galaxies, composite galaxies, and AGNs). No obvious difference was found in the distributions of either MB or redshift. However, the distributions of color and EW(H) for composite galaxies and AGNs are strikingly different from those for star-forming galaxies. This result could be due to the fact that AGNs tend to reside in earlier type galaxies (Kauffmann et al. 2003; see 5.4 for detailed discussions).
3 Estimation of Luminosities
3.1 MIR luminosities
To obtain MIR dust emission luminosities, the MIR continuum contributed by star light should be firstly estimated and then removed. A factor of 0.232 (Helou et al., 2004) was used to scale the stellar continuum of 3.6m to that of 8m, with the assumption that the entire IRAC 3.6m band emission is from stellar emission, and based on the Starburst99 synthesis model (Leitherer et al., 1999), assuming solar metallicity and a Salpeter initial mass function (IMF) between 0.1 and 120 . The scaling factor used here is not quite different from that of 0.26 by Wu05, which was obtained based on statistics of elliptical galaxies in the FLS field. Following Wu05, we denoted 8m(dust) as the 8m dust emission. The star light contribution to the MIPS 24m band can be neglected since it decreases quickly with the increase of wavelength.
Since IRAC 8m band cover the complex PAH emission range, a more accurate spectral energy distribution(SED) model is needed to obtain a reliable MIR K-correction. Here we adopted a series of SEDs from Huang et al. (2007)’s two-component model which is a linear combination of an old ’early-type’ stellar population and a ’late-type’ spiral disk population. The MIR color [5.8]-[8.0] was used to select the best SED model, and then the K-correction value was obtained. A template SED of a normal HII galaxy NGC 3351 (from SINGS; Kennicutt et al. 2003) was used to perform K-correction for the 24m band for all the sample galaxies.
3.2 FIR and TIR luminosities
The K-correction of FIR 70 and 160m emissions was based on the best fitted SED model of starburst galaxy M82 (Siebenmorgen & Krügel, 2007). The correction factors are less than 12% and 30% for the above two bands. The TIR luminosity (3-1100m) was calculated using the Equation (4) of Dale & Helou (2002):
| (1) |
3.3 H luminosity
The optical spectra of SDSS were taken with 3 diameter fibers, thus the measured H emission fluxes were only from the central regions for most low redshift galaxies and the corresponding aperture correction is needed. We adopted the method by Hopkins et al. (2003) and used their Equation (A2) to obtain the H luminosity of the whole galaxy:
| (2) |
Here, L is the luminosity distance; Hα is flux of H emission; while Petro and fiber are the -band Petrosian and fiber magnitudes, respectively. To match the 6 aperture photometry in 24m band, we also calculated the H luminosities in aperture of 6 in a similar way, i.e., substituting the -band 6 magnitudes for Petro in the above equation. The -band 6 magnitude was derived from the -band radial surface brightness profile of the SDSS catalog (Stoughton et al., 2002).
The optical H emissions suffer from the dust extinctions from both Milky Way and the host galaxy. The foreground Galactic extinction was first corrected by assuming the Cardelli et al. (1989)’s extinction curve and RV=3.1. Then the intrinsic extinction correction was performed, based on the color excess E(B-V) which was acquired from the Balmer decrement (Calzetti, 2001).
3.4 FUV luminosity
The K-correction of UV band was based on the IDL code supplied by Blanton (version tag v4_1_4). The method and the SEDs used by this code were described by Blanton et al. (2003) and Blanton & Roweis (2007). Since dust will heavily obscure the UV emission, it is important to correct for the UV extinction. The Galactic extinction was determined by the parametrized curve of Cardelli et al. (1989), with the adopted conversion factors of 7.9 and 8.0 (Gil de Paz et al., 2007) for FUV and NUV, respectively (Buat et al., 2005). The intrinsic UV extinctions are usually computed by the TIR-to-UV ratio method (Kong et al., 2004; Buat et al., 2005; Seibert et al., 2005; Cortese et al., 2006; Zamojski et al., 2007; Salim et al., 2005, 2007). However, the number of our UV sample galaxies with FIR data is too small to make statistical analysis. Alternatively, using a large sample of galaxies from SDSS spectroscopic catalog and GALEX Medium Imaging Survey, Treyer et al. (2007) derived an empirical correlation to estimate the intrinsic UV extinction based on the color at redshift 0.1 (their equation (9)):
| (3) |
We use this equation to calculate the intrinsic UV extinctions for our UV sample galaxies.
4 Correlation Analysis
4.1 L(MIR) vs. L(H)
luminosity
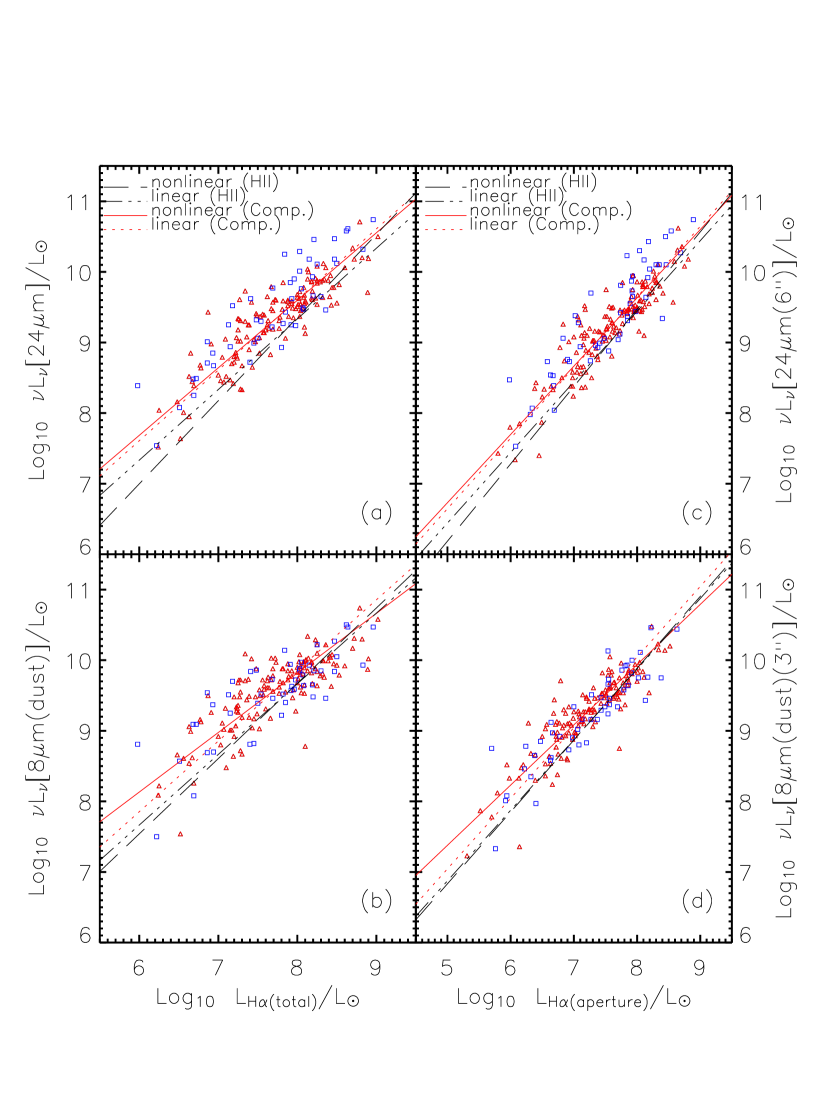
Firstly, we present the correlation between MIR luminosities and H luminosities for star-forming galaxies. The H luminosities are the aperture-corrected values (see 3.3). 24m and 8m(dust) luminosities are plotted against H luminosities in Figure 4 (a) and (b). After excluding the dwarf galaxies (open circles), star-forming galaxies show good correlations between L(MIR) and L(H). Using the two-variable regression, we obtain the best nonlinear fits (ab; solid lines in Figure 4 (a) and (b)):
| (4) |
| (5) |
Comparing with the nonlinear fits for star-forming galaxies in the FLS field obtained by Wu05 (dashed lines in Figure 4 (a) and (b)), we find that the best nonlinear fit of 24m vs. H luminosities in this work is well consistent with the corresponding result by Wu05. However, the slope of our nonlinear fit of 8m(dust) vs. H is a little shallower than that of Wu05, and this discrepancy could be due to the 8m-weak HII galaxies (located at bottom-left of Figure 4 (b)) which tend to have lower 8m(dust)-to-H luminosity ratios.
Similar to Wu05, we can derive MIR SFR formulae based on the best linear fits ( c; dotted lines in Figure 4 (a) and (b), see also Table 3 for the fitting parameters) and Formula (2) of Kennicutt (1998):
| (6) |
Here, solar abundances and the Salpeter IMF (0.1-100 ) were used in deriving the calibration factor. So the derived formulae according to the above correlations are:
| (7) |
| (8) |
The fitting coefficients are consistent with those derived by Wu05 with differences of 11%.
luminosity
In the above analysis, the aperture effect was corrected and then the H luminosities were obtained based on the assumption that the outer parts of galaxies have the same H-to- luminosity ratios to the central regions. In fact, this could not be true for many reasons, e.g., for central starburst galaxies, it would overestimate the H fluxes. To evaluate such an effect, we re-analyzed above correlations only for the central regions of star-forming galaxies. Figure 4 (c) and (d) show the correlations between L(MIR) and L(H) in aperture of 6 at 24 m and of 3 at 8m. The best nonlinear fits are:
| (9) |
| (10) |
Obviously, the scatters shown in Panels (c) and (d) (the standard deviation of the fitting residuals are 0.15 and 0.14 respectively) are smaller than those in Panels (a) and (b) (the standard deviation of the fitting residuals are 0.16 and 0.18 respectively) of Figure 4, especially for the correlation between 8m(dust) vs. H luminosities (see also the fitting coefficients summarized in Table 3). Compared with the best nonlinear fits for L(MIR) vs. L(H) (dashed lines in Figure 4 (c) and (d)), the best nonlinear fits for L(MIR) vs. L(H) (solid lines in Figure 4 (c) and (d)) are about 0.1 dex shifted upward. This result indicates that the MIR-to-H luminosity ratios of the central regions are relatively higher than those of the whole galaxies. Panels (c) and (d) (“” correlations) also show that the deviations of dwarf galaxies from normal star-forming galaxies are much less than those shown in Panels (a) and (b) (“” correlations).
4.2 L(Hobs MIR) vs. L(H)
Calzetti et al. (2007) showed that there existed a tight correlation between the linear combination of the observed H (Hobs) and 24m luminosities and the extinction-corrected Pa luminosities for star-forming knots in SINGS galaxies. This result can be interpreted as: the 24m (and also 8m[dust]) and observed H emissions trace the dust-obscured and un-obscured star formation, respectively. This correlation could be presented as equation illustrated by Kennicutt et al. (2007) (their equation 4):
| (11) |
Here, the left side of this equation is the extinction-corrected H luminosities.
Based on these star-forming galaxies, we can obtain the scaling constant (Kennicutt et al., 2007) values of 0.022 and 0.010 for the combined Hobs 24m and Hobs 8m(dust) luminosities. The value of 0.022 we obtained here is slightly smaller than that of 0.031 for star-forming regions in galaxies by Calzetti et al. (2007), and we speculate that this difference is caused by the dust heated by the interstellar radiation field (mainly from old stars) which could enhance the MIR emissions for the entire galaxies. In addition, the tight correlations between the dust-obscured (absorbed) H luminosities and both of the 24m and 8m(dust) luminosities also verify the fact that the dominant sources of MIR emissions are from the dust-obscured star formation because the H emission directly traces the HII region surrounded young massive stellar population. Therefore, the linear combinations of the Hobs and MIR luminosities would include almost all the star formation activities in galaxies, and they could be used as good SFR indicators for normal star-forming galaxies.
With the derived constant , the tight correlations between combined Hobs MIR and extinction-corrected H luminosities (see Table 3) are shown in Figure 5. The dwarf galaxies also follow the correlations for normal star-forming galaxies. The best nonlinear fits are shown as:
| (12) |
| (13) |
Thus, the combined L(Hobs 24m) almost linearly correlate with extinction-corrected H luminosities.
4.3 L(MIR) vs. L(FIR)
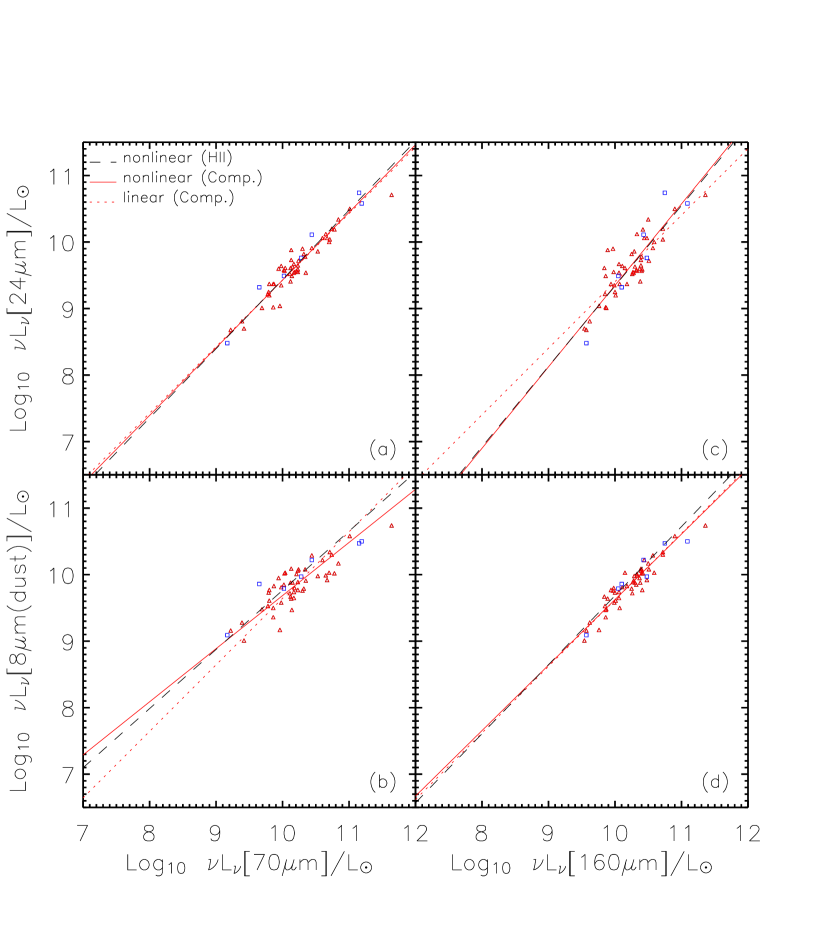
FIR luminosity was thought to be a good SFR tracer by previous and observations. Figure 6 shows the correlations between MIR (24m and 8m[dust]) and FIR (70m and 160m) luminosities. Due to the relatively lower sensitivities of MIPS 70 and 160m observations, only star-forming galaxies have both 70m and 160m detections. The best nonlinear and linear fits are shown as the solid and dotted lines in Figure 6, and the fitting parameters are listed in Table 3. Among the above four correlations, the L(24m)-L(70m) (Figure 6(a)) and L(8m[dust])-L(160m) (Figure 6(d)) are shown to be much tighter than the rest two correlations (Figure 6(b) and (c)). The former two correlations have scatters with standard deviations of 0.07, while those of the latter two are about 0.10. Furthermore, from Table 3, it is clear that the slopes of best nonlinear fits of L(24m)-L(70m) and L(8m[dust])-L(160m) correlations are both 1.04, which indicate that these two correlations are almost linear.
4.4 L(MIR) & L(FIR) vs. L(TIR)
The correlations between MIR & FIR with TIR (3-1100m) luminosities are shown in Figure 7. The fitting parameters and correlation coefficients are listed in Table 3. All of the four correlations are tight, with the standard deviations of 0.06 to 0.09 and the Spearman Rank-order correlation analysis coefficients of 0.97. The L(160m)-L(TIR) correlation is the tightest among the four, and the 8m(dust) and 160m luminosities are almost linearly correlated with the TIR luminosities.
Based on these correlations, we re-calibrated the MIR SFR formulae from TIR luminosities. Kennicutt (1998) presented the equation (Equation (4)) to calculate SFR based on IR luminosity:
| (14) |
The calibration factor was derived by applying the models of Leitherer & Heckman (1995) for continuous bursts of age 10-100 Myr and adopting the same Salpeter IMF. Here, refers to the IR luminosity integrated over the full-, mid-, and far-IR spectrum (8-1000 m). The TIR (3-1100m) luminosity can also be derived from three bands (25,60,100m) luminosities (Dale & Helou, 2002), and Takeuchi et al. (2005) found that the L(TIR) estimated in this way were very similar to the L(IR) (8-1000m; calculated by using the equations presented by Sanders & Mirabel 1996). Therefore, we adopted above Equation and used the TIR luminosities to calibrate SFRs. The derived formulae are:
| (15) |
| (16) |
The fitting coefficients are different from those in Equations (6) and (7) by 20-25%.
Kennicutt (1998) pointed out that the calibration factor of 4.5 in their Equation (4) was not valid for quiescent, normal galaxies, since the lower optical depth of dust could increase this coefficient, while the dust heating from old stars could decrease it. The old stellar population could heat the interstellar dust and be re-radiated at longer wavelength as cool infrared cirrus emissions (see, e.g., Beichman, 1987; Choi, 2006). Therefore, the SFR derived from TIR luminosities would be overestimated if such contributions to L(TIR) can not be neglected. Bell (2003) illustrated that the fraction of contribution to L(TIR) from diffuse components was 32 for normal star-forming galaxies, while this proportion is much smaller for Luminous Infrared Galaxies (LIRGs) with L(TIR) . This interpretation could explain the differences between fitting coefficients of SFRs calibrated by TIR and H luminosities.
Considering that most of our sample galaxies have infrared luminosities less than 1011 L⊙, we adopt an old stellar population fraction of 30% independent of luminosity (Hopkins et al., 2003). Then we obtain old stellar population corrected SFR formulae for star-forming galaxies (with L(TIR) ):
| (17) |
| (18) |
The fitting coefficients are consistent with those in Equations (6) and (7), with much smaller differences of 8%.
4.5 L(MIR) vs. L(FUV)
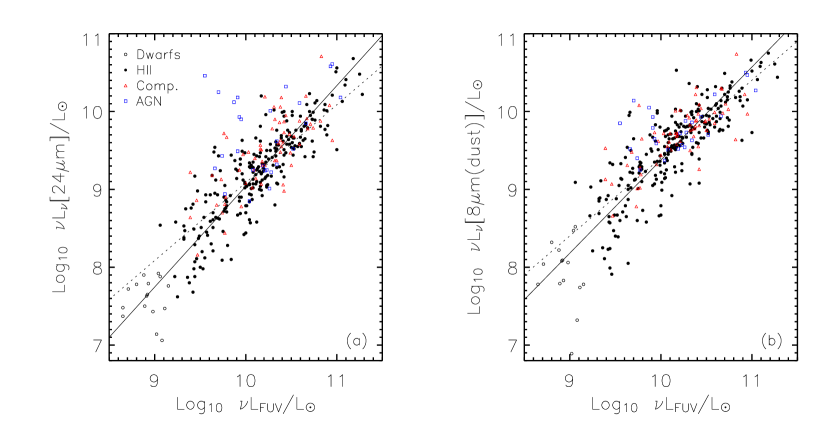
Figure 8 shows the 24m and 8m(dust) vs. extinction-corrected FUV luminosities (see 3.4) for star-forming galaxies. Although scatters are large (with standard deviations of 0.22), there still exist correlations between L(MIR) and L(FUV) with the Spearman Rank-order correlation analysis coefficients of 0.86, 0.84, respectively. The conversion between the UV luminosity and SFR has been presented by Kennicutt (1998) (Equation (1)):
| (19) |
The calibration factor was derived by the assumption of continuous star formation and adopting the same Salpeter IMF. Based on this formula, we derive SFRs from the FUV luminosities and the linear correlation coefficients listed in Table 3:
| (20) |
| (21) |
The fitting coefficients are nearly half of those in Equations (6) and (7), but note the FUV luminosities only cover a range of 2 orders of magnitude.
However, Kennicutt (1998)’s formula is only suit for continuous star formation over time scales of year or longer. Burgarella et al. (2005) presented a formula (their Equation (2)) to estimate SFRs for non-starburst galaxies whose stellar birthrate (Kennicutt et al., 1994) are less than 1.0. Based on the relationship between and EW(H) given by Kennicutt et al. (1994), we selected 187 star-forming galaxies whose EW(H) are less than 30 (correspond to ) to re-calibrate SFRs:
| (22) |
| (23) |
Similar to the analysis in 4.2, Figure 9 presents the correlations between the extinction-corrected FUV luminosities and combined observed FUV + MIR luminosities (L[FUVobs MIR]), with derived coefficients of 6.31 and 3.02 for FUV 24m and 8m, respectively. But the scatters of these correlations (1.65) are larger than that of L(H) vs. L(Hobs MIR).
4.6 Correlations for Composite galaxies and AGNs
Besides the star-forming galaxies, there are also many composite galaxies and AGNs in our sample. The correlations between the & MIR and H luminosities for composite galaxies and AGNs are shown in Figure 10. The parameters of the best nonlinear and linear fits for composite galaxies are listed in Table 4. The L(MIR) are correlated with L(H) for both composite galaxies and AGNs, but the scatters are larger (with standard deviations of 0.15-0.21) and the correlation slopes are shallower than those of star-forming galaxies. Furthermore, the MIR-to-H luminosity ratios of both composite galaxies and AGNs are higher than that of star-forming galaxies, especially for the L(24m)-to-L(H) ratios. Similarly, both composite galaxies and AGNs are also shown to have relatively higher MIR-to-FUV luminosity ratios (see Figure 8).
Figures 11 and 12 show the correlations of L(MIR) vs. L(FIR) and L(MIR) & L(FIR) vs. L(TIR) for composite galaxies and AGNs. The best nonlinear and linear fits for composite galaxies are similar to those for star-forming galaxies but with larger scatters. Just the same as normal star-forming galaxies, for composite galaxies the L(24m)-L(70m) and L(8m[dust])-L(160m) correlations are tighter than those of L(24m)-L(160m) and L(8m[dust])-L(70m); the best nonlinear fits of the former two correlations are almost linear; and both 8m(dust) and 160m luminosities are almost linearly correlated with TIR luminosities.
5 Discussion
5.1 Discrepancies in L(MIR)-L(H) Correlations
The aperture correction to H luminosities (see 3.3) were performed based on the assumption that the distributions of H emission in galaxies are similar to those of the continuum (SDSS-) emission. All of our sample galaxies have both detectable H and H emission lines above 5 significance level, thus it could bias towards galaxies with stronger (circum-)nuclear star formation activities. In the outer parts of these types of galaxies, star formation activity would be much weaker and the optical continuum emissions could be dominated by old stellar populations. In such cases, we would overestimate the H luminosity if performing corrections from SDSS -band magnitude. The aperture correction effect discussed above could explain the shifts between best fits of and MIR-to-H luminosity correlations shown in Figures 4 and described in 4.1.
Besides the aperture correction effect discussed above, differential dust obscuration could be another reason for such discrepancies. The central region of galaxies is more dusty than their outer parts (e.g., Popescu et al., 2005; Prescott et al., 2007), and a majority of UV continuum and Balmer line emissions might be completely enshrouded by dust thus of course can’t be corrected. There is no doubt that the above effect will be more severe for the central regions than for the entire galaxies, thus it could cause a higher MIR-to-H luminosity ratio than the value, in accordance with the discrepancies shown above.
Dwarf galaxies were shown to be obviously deviated from the star-forming galaxies in the L(MIR)-L(H) correlations (see Figure 4(a) and (b)). This large deviation could be mainly caused by the aperture correction effect discussed above, since many dwarf galaxies have intensive star formation in their nuclear regions (e.g., Gu et al., 2006; Lisker et al., 2006). This interpretation can also be proved by the L(8m[dust])-L(H) correlation shown in Figure 4(d), in which dwarf galaxies are only slightly deviated from the star-forming galaxies. Alternatively, this slight deviation could be explained by the fact that PAH and warm dust emissions are relatively weak in low metallicity environments (e.g., Madden, 2000; Engelbracht et al., 2005; Wu et al., 2006; Galliano et al., 2005; Wu et al., 2007; Engelbracht et al., 2008).
5.2 Estimation of SFRs from MIR Luminosities
Based on a sample of FLS-field galaxies, Wu et al. (2005) showed that both 8m(dust) and 24m luminosities could be used to calculate SFRs of normal star-forming galaxies, and they gave corresponding MIR-derived SFR formulae calibrated by either H or radio luminosities. However, the size of Wu05’s sample is a little small (only have 80 galaxies) and the MIR luminosities of their sample galaxies only cover a range of two orders of magnitude. In this work, we construct a large sample of star-forming galaxies with the MIR luminosities range of three orders of magnitude. Besides correlating well with H luminosities, the MIR luminosities of our sample galaxies are also found to have tight correlations with TIR and FUV luminosities. These correlations allow us to estimate and compare SFRs from MIR luminosities calibrated by different SFR indicators.
Although the correlations between L(MIR) with L(H) & L(TIR) are somewhat nonlinear, the nonlinearities of the above two correlations are generally less than 10%. Therefore, we can adopt linear correlations for calibrating SFRs (SFRs derived from non-linear correlations between L(MIR) with other luminosities also were illustrated in Figure 13) . Based on the three linear correlations of L(MIR)-L(H), L(MIR)-L(TIR) and L(MIR)-L(FUV), we obtained that the SFR conversion factors of L(24m) are 7.15108, 7.79108, and 7.04108 L⊙, and those of L(8m[dust]) are 1.58108, 1.70108, and 1.46108 L⊙, respectively. These factors are in good agreement with those of L(MIR)-L(H) and L(MIR)-L(radio) correlations by Wu05 with differences less than 10% (Figure 13). In fact, the differences in L(8m[dust])-L(H) correlations between Wu05’s sample and ours are mainly because of the galaxies with very low MIR luminosities. However, it must be noted that the MIR SFR formulae (especially for 8m(dust)) derived above can not be applied to dwarf galaxies (and other galaxies with low metallicity; Wu et al. 2007), since they deviate much from the linear correlations for normal star-forming galaxies. However, the deviation of dwarfs to normal star-forming galaxies in Figure 5 is apparently smaller than in Figure 4. Therefore, it may be a simple and feasible method of using the combined observed H + MIR luminosities to compute SFRs. The black solid line in Figure 13 show the equation to compute SFR based on 24m luminosity given by Alonso-Herrero et al. (2006a) (their equation 3), which was derived from the correlation between 24m and H luminosities for 30 LIRGs in the local universe, and this equation is similar to the one by Calzetti et al. (2007) except for different IMFs. We should keep in mind such large differences for infrared luminous galaxies.
For TIR emission, the contribution from dust heating by the old stellar population could not be ignored (30% for normal galaxies, Bell (2003)); while for UV emission, except for the pollution from old star, the effect of intrinsic extinction is even stronger than that for H emission. Although the standard deviations of the fitting residuals from TIR (0.07 for 24m, 0.06 for 8m(dust)) are smaller than from H (0.16, 0.18 respectively), the H emission trace the HII region surrounded massive star more directly. Therefore, we suggest that the MIR-derived SFR based on the MIR vs. H correlation is “better” than those derived from other correlations.
5.3 Correlations among L(MIR), L(FIR) and L(TIR)
The MIR luminosities L(MIR) are mainly from PAH and warm dust (VSGs) emissions, while FIR luminosities L(FIR) are dominated by cold dust emissions from large grains. From Figure 6, and comparing with the correlations between L(MIR) and L(H) shown in Figure 4 and Table 3, we find that the MIR luminosities correlate better with L(FIR) than L(H), and this result is consistent with that from Boselli et al. (2004) for late-type galaxies observed by .
However, correlations shown in Figures 4 and 6 are on the basis of two different (MIR & FIR) samples. Therefore, we firstly checked the distributions of absolute B-band magnitude, redshift, color, and EW(H) for both MIR and FIR sample galaxies (see Figure 2), and found the two samples have similar distributions. To avoid possible selection effect, the L(MIR)-L(H) correlations for FIR sample galaxies are also shown in Figure 14. The best fits for galaxies in the FIR sample are consistent with those for Wu05 and MIR sample galaxies. The standard deviations for the FIR sample are about 0.15, a little smaller than those for the MIR sample, since the FIR sample do not include galaxies with L(MIR) 108; while their Spearman Rank-order correlation analysis coefficients are similar to those of the MIR sample. From the comparison described above, we confirm that the MIR luminosities are better correlated with FIR than H luminosities for star-forming galaxies.
As described in 4.3 and shown in Figure 6, among the four L(MIR)-L(FIR) correlations, L(24m)-L(70m) and
L(8m[dust])-L(160m) have much smaller scatters (the standard deviation of the fitting residuals are both 0.07) than
the rest two correlations of L(24m)-L(160m) and L(8m[dust])-L(70m) (the standard deviation of the fitting
residuals are 0.12 and 0.10 respectively). Furthermore, the slopes of both L(24m)-L(70m) and L(8m[dust])-L(160m)
correlations are close to unity, which indicates that such correlations are almost linear. The above results hint that the 24m
vs. 70m, and 8m vs. 160m emissions may have similar physical origins:
(a) The 24m emission is known to be dominated by warm dust emissions from VSGs, which are mainly heated by young massive stars.
Recent results by (Wu et al., 2005; Pérez-González et al., 2006; Calzetti et al., 2007) have shown that the 24m luminosity is one of the best SFR indicators.
Previous works based on and observations have proved that the FIR luminosity is also a good SFR tracer because of
the emission peak around 60m of dust heated by star formation, thus the 70m emission must be closely related to star
formation activities and should have tight and linear correlation with 24m warm dust emission.
(b) The 8m(dust) luminosity was also thought to be a SFR tracer by some authors (e.g., Wu et al., 2005; Alonso-Herrero et al., 2006b). 8m
dust emissions include emissions from both PAHs and VSGs. In star-forming galaxies, the 7.7m PAH emission dominates the 8m
band (Smith et al., 2007) and its strength is likely to be affected by many factors, such as the radiation field and metallicity
(e.g., Madden, 2000; Galliano et al., 2005; Cao & Wu, 2007; Wu et al., 2007). Moreover, PAH emissions trace B star better than young O stars (Peeters et al., 2004).
Therefore, the 8m(dust) luminosity may not be an optimal SFR tracer, and this could explain why the 70m luminosities
have better correlation with 24m rather than 8m(dust) luminosities.
(c) The 160m emission is mainly from cold dust heated by old stars and is thought to locate in the diffuse regions
of galaxies (e.g., Gordon et al., 2004); while the PAH molecules are generally located in the photo-dissociation regions (PDRs),
at the interface of HII regions (Hollenbach & Tielens, 1997; Draine, 2003). The tight L(8m[dust])-L(160m) correlation indicates
that the 8m(dust) and 160m emissions might be from the same regions of galaxies, i.e., cold dust emission could
exists in PDRs and it is also possible that there exists PAH emission in the diffuse regions because PAHs can be pumped by
cool stars with less UV radiation (Li & Draine, 2002). Due to the low spatial resolution and shallowness of 160m
observations, firm conclusions on the physical connection between 8m(dust) and 160m emissions and their
distributions in galaxies must await high quality FIR data from future space telescopes (e.g., ).
Figure 6 shows that both MIR and FIR luminosities are well correlated with TIR luminosities for star-forming galaxies. Except for L(24m), all of the 8m(dust), 70m and 160m luminosities are almost linearly correlated with the L(TIR). This result indicates that the monochromatic MIR and FIR luminosities can be used for estimating the TIR luminosity, in agreement with previous studies (Elbaz et al., 2002; Takeuchi et al., 2005; Marcillac et al., 2006).
5.4 Properties of Composite galaxies and AGNs
Investigating the properties of composite galaxies and AGNs will provide us some information on the origin of MIR emission in AGN-hosting galaxies. Figures 8 and 10 show that composite galaxies and AGNs have distinct L(MIR)-L(H) and L(MIR)-L(FUV) correlations, i.e., they (especially for the ones with low H luminosity) have relatively higher MIR-to-H/MIR-to-FUV luminosity ratios than star-forming galaxies do. The high MIR-to-H/MIR-to-FUV luminosity ratios can not be caused by heavier dust obscuration in the host galaxies of composites and AGNs, since from Figure 3(c) it is clear that the host galaxies of composites and AGNs tend to be earlier Hubble types with redder colors, and it is well-known that early-type galaxies should have less gas and dust (e.g., Wen et al., 2007; Li et al., 2007). Alternatively, for early-type galaxies in which the diffuse IR emissions can not be neglected, their MIR-to-H/MIR-to-FUV luminosity ratios would tend to be higher due to additional dust heating by abundant old stellar populations. Furthermore, the higher luminosity (Figure 3(a)) could refer to higher metallicity(e.g., Lamareille et al., 2004), while higher metallicity in early-types (Wu et al., 2007; Li et al., 2007) could be another explanation to the higher MIR-to-H luminosity ratios of composite galaxies and AGNs except the re-emission of dust heated by AGN.
From Figure 11 it is clear that all the four L(MIR)-L(FIR) correlations for composite galaxies and AGNs are completely following those for star-forming galaxies. The L(MIR)-L(TIR) and L(FIR)-L(TIR) correlations for composite galaxies and AGNs are also shown to follow those for star-forming galaxies (see Figure 12). Hence, the contribution from the active nuclear to both MIR and FIR emissions is more smaller than the contribution from the HII region, and it could be neglected for those weak AGNs. Nevertheless, the similarity of dust heating by AGN or HII region could be another possible explanation. These results indicate that we can estimate the total infrared luminosity accurately from monochromatic MIR and FIR luminosities, not only for star-forming galaxies (see also 5.3), but also for AGN-hosting galaxies. However, firm conclusion must await a quantitative analysis of a large, well-defined, and unbiased sample of FIR-selected galaxies from and observations.
6 Summary
We present and analyze the correlations between MIR, FIR, TIR, H, and FUV luminosities for a large sample of galaxies selected from the SWIRE fields. The main results described in this paper can be summarized as follows.
1. The MIR (8m[dust] and 24m) luminosities of star-forming galaxies are found to be well correlated with their H, FIR, TIR, and FUV luminosities. Based on these correlations, we derive corresponding formulae to calculate SFRs from L(MIR). All these formulae are well consistent with each other.
2. The linear combination of observed H (Hobs) and 24m luminosities has tight and linear correlations with the extinction-corrected H luminosities L(H) for star-forming galaxies, so it can be used as a good SFR tracer. We determined the scaling parameter in this combination, and also found the combined Hobs 8m(dust) luminosities are also well correlated with L(H).
3. Among the four L(MIR)-L(FIR) correlations for star-forming galaxies, the L(24m)-L(70m) and L(8m[dust])-L(160m) correlations are the tightest and almost linear. The former could be related to young massive star formations, while the latter might be relevant to diffuse dust emissions heated by old stellar populations.
4. Composite galaxies and AGNs have higher MIR-to-H/MIR-to-FUV luminosity ratios than star-forming galaxies, nevertheless their correlations among MIR, FIR and TIR luminosities are completely following those for star-forming galaxies.
References
- Alonso-Herrero et al. (2006a) Alonso-Herrero, A., Rieke, G. H., Rieke, M. J., Colina, Pérez-González, P. G., & Ryder, S. D. 2006, ApJ, 650, 835
- Alonso-Herrero et al. (2006b) Alonso-Herrero, A., Colina, L., Packham, C., Díaz-Santos, T., Rieke, G. H., Radomski, J. T., & Telesco, C. M. 2006, ApJ, 652, 83
- Baldwin et al. (1981) Baldwin, J. A., Phillips, M. M., & Terlevich, R. 1981, PASP, 93, 5B
- Beichman (1987) Beichman, C. A. 1987, ARA&A, 25, 521
- Bell (2003) Bell, E. F. 2003, ApJ, 586, 794
- Bell et al. (2005) Bell, E. F., et al. 2005, ApJ, 625, 23
- Bertin & Arnouts (1996) Bertin, E. & Arnouts, S. 1996. A&AS, 117, 393
- Bessel & Brett (1988) Bessel. M. S. & Brett, J. M. 1988, PASP, 100, 1134
- Blanton et al. (2003) Blanton, M. R., et al. 2003, AJ, 125, 2348
- Blanton & Roweis (2007) Blanton, M. R. & Roweis, S. 2007, AJ, 133, 734
- Boselli et al. (2004) Boselli, A., Lequeux, J., & Gavazzi, G. 2004, A&A, 428, 409
- Buat et al. (2005) Buat, V., et al. 2005, ApJ, 619, L51
- Burgarella et al. (2005) Burgarella, D., Buat, V., & Iglesias-Páramo. J. 2005, MNRAS, 360, 1413
- Cardelli et al. (1989) Cardelli, J. A., Clayton, G. C., & Mathis, J. S. 1989, ApJ, 345, 245
- Calzetti (2001) Calzetti, D. 2001, PASP, 113, 1449
- Calzetti et al. (2005) Calzetti, D., et al. 2005, ApJ, 633, 871
- Calzetti et al. (2007) Calzetti, D., et al. 2007, ApJ, 666, 870
- Cao & Wu (2007) Cao, C., & Wu, H. 2007, AJ, 133, 1710
- Cao et al. (2008) Cao, C., Wu, H., Wang, Z., Ho, L. C., Huang, J. S., & Deng, Z. G. 2008, New Astronomy, 13, 16
- Choi (2006) Choi, P. I. 2006, ApJ, 637, 227
- Cortese et al. (2006) Cortese, L., et al. 2006, ApJ, 637, 242
- Cutri et al. (2003) Cutri, R. M., et al. 2003, The IRSA 2MASS All-Sky Point Source Catalog, NASA/IPAC
- Daddi et al. (2007) Daddi, E., et al. 2007, ApJ, 670, 173
- Dale & Helou (2002) Dale, D. A., & Helou, G. 2002, ApJ, 576, 159
- Draine (2003) Draine, B. T. 2003, ARA&A, 41, 241
- Elbaz et al. (2002) Elbaz, D., Cesarsky, C. J., Chanial, P., Aussel, H., Franceschini, A., Fadda, D., & Chary, R. R. 2002, A&A, 384, 848
- Elbaz et al. (2007) Elbaz, D., et al. 2007, A&A, 468, 33
- Eisenhardt et al. (2004) Eisenhardt, P. R., et al. 2004, ApJS, 154, 48
- Engelbracht et al. (2005) Engelbracht, C. W., Gordon, K. D., Rieke, G. H., Werner, M. W., Dale, D. A., & Latter, W. B. 2005, ApJ, 628, L29
- Engelbracht et al. (2008) Engelbracht, C. W., Rieke, G. H., Gordon, K. D., Smith, J.-D. T., Werner, M. W., Moustakas, J., Willmer, C. N. A., & Vanzi, L. 2008, in press (astro-ph/0801.1700)
- Fazio et al. (2004) Fazio, G. G., et al. 2004, ApJS, 154, 10
- Flores et al. (2004) Flores, H., Hammer, F., Elbaz, D., Cesarsky, C. J., Liang, Y. C., Fadda, D., & Gruel, N. 2004, A&A, 415, 885
- Förster Schreiber et al. (2004) Förster Schreiber, N. M., Roussel, H., Sauvage, M., & Charmandaris, V. 2004, A&A, 419, 501
- Galliano et al. (2005) Galliano, F., Madden, S. C., Jones, A. P., Wilson, C. D., & Bernard, J.-P. 2005, A&A, 434, 867G
- Gil de Paz et al. (2007) Gil de Paz, A., et al. 2007, ApJS, 173, 185
- Gillett et al. (1973) Gillett, F. C., Forrest, W. J., & Merrill, K. 1973, ApJ, 183,87
- Gordon et al. (2004) Gordon, K. D., et al. 2004, ApJS, 154, 215
- Gu et al. (2006) Gu, Q.-S., Zhao, Y.-H., Shi, L., Peng, Z.-X., & Luo, X.-L. 2006, AJ, 131, 806
- Heckman (1980) Heckman, T. M. 1980, A&A, 87, 152
- Helou et al. (2004) Helou, G., et al. 2004, ApJS, 154, 253
- Ho et al. (1997) Ho, L. C., Fillipenko, A. V., & Sargent, W. L. W. 1997, ApJ, 487, 568
- Hollenbach & Tielens (1997) Hollenbach, D. J., & Tielens, A. G. G. M. 1997, ARA&A, 35, 179
- Hopkins et al. (2003) Hopkins, A. M., et al. 2003, ApJ, 599, 971
- Huang et al. (2004) Huang, J.-S., et al. 2004, ApJS, 154, 44
- Huang et al. (2007) Huang, J.-S., et al. 2007, ApJ, 664, 840
- Hunter et al. (1986) Hunter, D. A., Gillett, F. C., Gallagher, J. S., Rice, W. L., & Low, F. J. 1986, ApJ, 303, 171
- Jonsson (2004) Jonsson, P. 2004, Ph.D. thesis, Univ. California, Santa Cruz
- Kauffmann et al. (2003) Kauffmann, G., et al. 2003, MNRAS, 346, 1055
- Kennicutt et al. (1994) Kennicutt, R. C., Jr., Tamblyn, P., & Congdon, C. E. 1994, ApJ, 435, 22
- Kennicutt (1998) Kennicutt, R. C., Jr. 1998, ARA&A, 36, 189
- Kennicutt et al. (2003) Kennicutt, R. C., Jr., et al. 2003, PASP, 115, 928
- Kennicutt et al. (2007) Kennicutt, R. C., Jr., et al. 2007, ApJ, 671, 333
- Kessler et al. (1996) Kessler, M. F., et al. 1996, A&A, 315, L27
- Kewley et al. (2001) Kewley, L. J., Heisler, C. A., Dopita, M. A., & Lumsden, S. 2001, ApJS, 132, 37
- Kewley et al. (2006) Kewley, L. J., Groves, B., Kauffmann, G., & Heckman, T. M. 2006, MNRAS,372,961
- Kong et al. (2004) Kong, X., Charlot, S., Brinchmann, J., & Fall, S. M. 2004, MNRAS, 349, 769
- Lacy et al. (2005) Lacy, M., et al. 2005, ApJS, 161, 41
- Lamareille et al. (2004) Lamareille, F., Mouhcine, M., Contini, T., Lewis, I., & Maddox, S. 2004, MNRAS, 350, 396
- Lehnert & Heckman (1996) Lehnert, M. D, & Heckman, T. M. 1996, ApJ, 472, 546
- Léger & Puget (1984) Léger, A., & Puget, J. L. 1984, A&A, 137, L5
- Leitherer & Heckman (1995) Leitherer, C., & Heckman, T. M. 1995, ApJS, 96, 9
- Leitherer et al. (1999) Leitherer, C., et al. 1999, ApJS, 123, 3
- Li & Draine (2002) Li, A., & Draine, B. T. 2002, ApJ, 572, 232
- Li et al. (2007) Li, H.-N., Wu, H., Cao, C., & Zhu, Y.-N. 2007, AJ, 134, 1315
- Lisker et al. (2006) Lisker, T., Glatt, K., Westera, P., & Grebel, E. K. 2006, AJ, 132, 2432
- Lonsdale et al. (2003) Lonsdale, C. J., et al. 2003, PASP, 115, 897
- Madden (2000) Madden, S. C. 2000, New Astronomy Review, 44, 249
- Marcillac et al. (2006) Marcillac, D., Elbaz, D., Charlot, S., Liang, Y. C., Hammer, F., Flores, H., Cesarsky, C., & Pasquali, A. 2006, A&A, 458, 369M
- Martin et al. (2005) Martin, D. C., et al. 2005, ApJ, 619, L1
- Peeters et al. (2004) Peeters, E., Spoon, H. W. W., & Tielens, A. G. G. M. 2004, ApJ, 613, 986
- Pérez-González et al. (2006) Pérez-González, P. G., et al. 2006, ApJ, 648, 987
- Popescu et al. (2005) Popescu, C. C., et al. 2005, ApJ, 619, L75
- Prescott et al. (2007) Prescott, M. K. M., et al. 2007, ApJ, 668, 182
- Puget & Léger (1989) Puget, J. L., & Léger, A. 1989, ARA&A, 27, 161
- Rieke et al. (2004) Rieke, G. H., et al. 2004, ApJS, 154, 25
- Roussel et al. (2001) Roussel, H., Sauvage, M., Vigroux, L., & Bosma, A. 2001, A&A, 372, 427
- Salim et al. (2005) Salim,S., et al. 2005, ApJ, 619, 39
- Salim et al. (2007) Salim,S., et al. 2007, ApJS, 173, 267
- Sanders & Mirabel (1996) Sanders, D. B.,& Mirabel, I. F. 1996, ARA&A, 34, 749
- Seibert et al. (2005) Seibert, M., et al. 2005, ApJ, 619, L55
- Siebenmorgen et al. (2004) Siebenmorgen, R., Krügel, E., & Spoon, H. W. W. 2004, A&A, 414, 123
- Siebenmorgen & Krügel (2007) Siebenmorgen, R., & Krügel, E. 2007, A&A, 461, 445
- Smith et al. (2002) Smith, J. A., et al. 2002, AJ, 123, 2121
- Smith et al. (2007) Smith, J. D. T., et al. 2007, ApJ, 656, 770
- Strauss et al. (2002) Strauss, M. A., et al. 2002, AJ, 124, 1810
- Stoughton et al. (2002) Stoughton, C., et al. 2002, AJ, 123, 485
- Takeuchi et al. (2005) Takeuchi, T. T., Buat, V., Iglesias-Páramo, J., Boselli, A., & Burgarella, D. 2005, A&A, 432,423
- Thilker et al. (2007) Thilker, D. A., et al. 2007, ApJS, 173, 538
- Thuan & Martin (1981) Thuan, T. X., & Martin, G. E. 1981, ApJ, 247, 823
- Tremonti et al. (2004) Tremonti, C. A., et al. 2004, ApJ, 613, 898
- Treyer et al. (2007) Treyer, M., et al. 2007, ApJS, 173, 256
- Veilleux & Osterbrock (1987) Veilleux, S., & Osterbrock, D. E. 1987, ApJS, 63, 295
- Verma et al. (2005) Verma, A., Charmandaris, V., Klaas, U., Lutz, D., & Haas, M. 2005, Space Science Reviews, 119, 355
- Weedman et al. (2005) Weedman, D. W., et al. 2005, ApJ, 633, 706
- Wen et al. (2007) Wen, X.-Q., Wu, H., Cao, C., Xia, X.-Y. 2007, Chinese Journal of Astronomy and Astrophysics, 7, 187
- Werner et al. (2004) Werner, M. W., et al. 2004, ApJS, 154, 1
- Willner et al. (1977) Willner, S. P., Soifer, B. T., Russell, R. W., Joyce, R. R., & Gillett, F. C. 1977, ApJ, 217, 121
- Wu et al. (1998) Wu, H., Zou, Z. L., Xia, X. Y., & Deng, Z. G. 1998, A&AS, 132, 181
- Wu et al. (2005) Wu, H., Cao, C., Hao, C.-N., Liu, F.-S., Wang, J.-L., Xia, X.-Y., Deng, Z.-G., & Young, C. K. S. 2005, ApJ, 632, L79
- Wu et al. (2007) Wu, H., Zhu, Y. N., Cao, C., & Qin, B. 2007, ApJ, 668, 87
- Wu et al. (2006) Wu, Y., Charmandaris, V., Hao, L., Brandl, B. R., Bernard-Salas, J., Spoon, H. W. W., & Houck, J. R. 2006, ApJ, 639, 157
- York et al. (2000) York, D. G., et al. 2000, AJ, 120, 1579
- Zamojski et al. (2007) Zamojski, M. A., et al. 2007, ApJS, 172, 468


| Expected valueaafrom Eisenhardt et al. (2004); Lacy et al. (2005). | Observed value | Corrected value | ||
|---|---|---|---|---|
| 0.04 | 0.09 | 0.05 | ||
| 0.02 | 0.03 | 0.05 | ||
| 0.00 | 0.03 | 0.03 | ||
| 0.00 | 0.07 | 0.07 | ||
| 0.04 | 0.06 | 0.02 | ||
| 0.02 | 0.03 | 0.05 | ||
| 0.00 | 0.03 | 0.03 | ||
| 0.00 | 0.07 | 0.07 | ||
| 0.04 | 0.09 | 0.05 | ||
| 0.02 | 0.02 | 0.04 | ||
| 0.00 | 0.02 | 0.02 | ||
| 0.00 | 0.08 | 0.08 |
| Sample | ||||
|---|---|---|---|---|
| MIR | 413 | 143 | 49 | 605 |
| FIR | 141 | 49 | 7 | 197 |
| UV | 267 | 65 | 27 | 359 |
| Sample | ||||||||
|---|---|---|---|---|---|---|---|---|
| (1) | (2) | (3) | (4) | (5) | (6) | (7) | (8) | (9) |
| FLS | 0.340.19 | 1.120.07 | … | 0.88 | 1.290.19 | 63 | ||
| FLS | 2.310.15 | 0.920.05 | … | 0.87 | 1.680.19 | 79 | ||
| MIR | 0.060.07 | 1.180.02 | 0.16 | 0.92 | 1.330.18 | 379 | ||
| MIR | 1.140.07 | 1.070.03 | 0.18 | 0.88 | 1.670.19 | 379 | ||
| MIR | 0.630.05 | 1.100.02 | 0.15 | 0.93 | 1.370.17 | 379 | ||
| MIR | 1.740.05 | 1.020.02 | 0.14 | 0.94 | 1.880.16 | 379 | ||
| MIR | 0.290.04 | 0.960.01 | 0.09 | 0.95 | 0.010.11 | 379 | ||
| MIR | 0.860.04 | 0.890.01 | 0.09 | 0.94 | 0.010.12 | 379 | ||
| FIR | 0.280.10 | 1.130.04 | 0.15 | 0.92 | 1.370.17 | 137 | ||
| FIR | 1.870.11 | 0.980.04 | 0.15 | 0.87 | 1.690.17 | 137 | ||
| FIR | 0.970.05 | 1.040.01 | 0.07 | 0.98 | 0.560.08 | 137 | ||
| FIR | 0.870.07 | 0.890.02 | 0.10 | 0.95 | 0.240.13 | 137 | ||
| FIR | 2.750.10 | 1.210.03 | 0.12 | 0.94 | 0.630.14 | 137 | ||
| FIR | 0.690.06 | 1.040.02 | 0.07 | 0.96 | 0.320.08 | 137 | ||
| FIR | 0.440.05 | 0.980.02 | 0.06 | 0.97 | 0.700.08 | 137 | ||
| FIR | 2.480.05 | 1.140.02 | 0.07 | 0.98 | 1.020.09 | 137 | ||
| FIR | 1.450.06 | 1.090.02 | 0.07 | 0.98 | 0.450.09 | 137 | ||
| FIR | 0.220.04 | 0.940.01 | 0.05 | 0.99 | 0.380.06 | 137 | ||
| UV | 3.890.14 | 1.290.04 | 0.22 | 0.86 | 0.910.24 | 248 | ||
| UV | 2.580.14 | 1.200.04 | 0.22 | 0.84 | 0.600.23 | 248 |
Note. — Col.(1): Sample used for correlation analysis. ”FLS” represents the First Look Survey sample by Wu05; Col.(2)-(3): names of multi- luminosities. and represent the and luminosities, and all the luminosities are in units of L⊙; Col.(4)-(5): the coefficients and of the nonlinear fit: ab; Col.(6): the standard deviation of the fitting residuals; Col.(7): the coefficient of the linear fit: c; Col.(8): the coefficient of the Spearman Rank-order correlation analysis; Col.(9): the number of sample galaxies (after excluding dwarf galaxies) used for the fitting procedures.
| Sample | ||||||||
|---|---|---|---|---|---|---|---|---|
| (1) | (2) | (3) | (4) | (5) | (6) | (7) | (8) | (9) |
| MIR | 1.950.11 | 0.960.04 | 0.19 | 0.87 | 1.610.22 | 143 | ||
| MIR | 3.070.12 | 0.840.04 | 0.21 | 0.79 | 1.860.27 | 143 | ||
| MIR | 1.900.10 | 0.970.04 | 0.18 | 0.89 | 1.640.20 | 143 | ||
| MIR | 3.110.08 | 0.850.03 | 0.15 | 0.89 | 2.040.21 | 143 | ||
| FIR | 0.750.15 | 1.020.05 | 0.09 | 0.90 | 0.570.10 | 49 | ||
| FIR | 1.700.21 | 0.800.07 | 0.14 | 0.78 | 0.360.19 | 49 | ||
| FIR | -2.900.31 | 1.220.09 | 0.16 | 0.78 | 0.600.19 | 49 | ||
| FIR | -0.220.16 | 0.980.05 | 0.09 | 0.92 | 0.380.09 | 49 | ||
| FIR | 0.020.17 | 0.930.05 | 0.10 | 0.91 | 0.790.11 | 49 | ||
| FIR | 2.690.17 | 1.160.05 | 0.09 | 0.90 | 1.000.11 | 49 | ||
| FIR | 2.150.15 | 1.160.04 | 0.08 | 0.93 | 0.430.10 | 49 | ||
| FIR | 0.260.12 | 0.940.04 | 0.07 | 0.95 | 0.410.09 | 49 |
Note. — The definition of columns are the same as in Table 3.