The Arecibo Legacy Fast ALFA Survey:
VI. Second HI Source Catalog of the Virgo Cluster Region
Abstract
We present the third installment of HI sources extracted from the Arecibo Legacy Fast ALFA extragalactic survey. This dataset continues the work of the Virgo ALFALFA catalog. The catalogs and spectra published here consist of data obtained during the 2005 and 2006 observing sessions of the survey. The catalog consists of 578 HI detections within the range R.A.(J2000) and Dec.(J2000) , and km s-1. The catalog entries are identified with optical counterparts where possible through the examination of digitized optical images. The catalog detections can be classified into three categories: (a) detections of high reliability with S/N 6.5; (b) high velocity clouds in the Milky Way or its periphery; and (c) signals of lower S/N which coincide spatially with an optical object and known redshift. 75% of the sources are newly published HI detections. Of particular note is a complex of HI clouds projected between M87 and M49 that do not coincide with any optical counterparts. Candidate objects without optical counterparts are few. The median redshift for this sample is 6500 km s-1 and the distribution exhibits the local large scale structure consisting of Virgo and the background void and the A1367-Coma supercluster regime at 7000 km s-1. Position corrections for telescope pointing errors are applied to the dataset by comparing ALFALFA continuum centroid with those cataloged in the NRAO VLA Sky Survey. The uncorrected positional accuracy averages 27″ (21″ median) for all sources with S/N 6.5 and is of order 21″ (16″ median) for signals with S/N 12. Uncertainties in distances toward the Virgo cluster can affect the calculated HI mass distribution.
1 Introduction
A census of HI in the local Universe will shed light on galaxy evolution and a census of the gas content of galaxies at . As such, a complete enumeration tracing the HI at low redshift will yield a homogeneous dataset with quantitative measurements for kinematics, redshifts, and HI masses. An HI catalog provided by a wide-area survey serves as an outstanding complement to existing and future surveys at other wavelengths, including the large area Two Micron All Sky Survey (2MASS; Skrutskie et al. 2006) and the Sloan Digital Sky Survey (SDSS; York et al. 2000). A high sensitivity HI survey sampling a large area of sky completes the picture by adding information about the gas content of galaxies in the local Universe.
First generation HI surveys have been limited by sensitivity or areal coverage. The HI Parkes All-Sky Survey (HIPASS; Barnes et al. 2001) has detected 5317 extragalactic sources over 30,000 deg2 of sky (Meyer et al. 2004; Wong et al. 2006) using a 13 element receiver system. The survey’s successful catalogs provided a wide area of sky coverage. The Arecibo Dual Beam Survey (ADBS; Rosenberg & Schneider 2002) surveyed a smaller area of sky, but utilized the advantage of the higher sensitivity, smaller beam size, and better positional accuracy of the Arecibo Radio Telescope. The ADBS in particular showed the populations of objects that could be detected with high sensitivity HI surveys that were not subjected to the biases of optical surveys. A “2nd generation” extragalactic HI survey can combine high sensitivity with coverage of a wide area and will yield a cosmologically fair sampling of HI sources in the volume of the local Universe. As astronomy pushes into a realm of large scale data mining, optical and IR surveys will be greatly complemented by the catalogs from HI surveys.
The Arecibo Legacy Fast ALFA (ALFALFA; Giovanelli et al. 2005a: Paper I) survey, currently underway, utilizes the 7-element Arecibo L-band Feed Array (ALFA) receiver system to conduct a wide area extragalactic HI investigation. Using the high sensitivity of the 305 meter reflector, ALFALFA will survey 7000 deg2 of sky at high Galactic latitude up to 18000 km s-1. As a second generation HI survey, ALFALFA improves upon previous surveys with larger bandwidth and finer spectral resolution, as well as with higher sensitivity and angular resolution. While the eight-fold increase in sensitivity will assist in the detection of low HI mass galaxies, the wider bandwidth will allow ALFALFA to sample a fair volume of the Universe. Higher angular resolution will largely avoid the source confusion that affected identification of optical counterparts in surveys such as HIPASS. Paper I describes the survey’s science goals and objectives. Based on simulations and ALFALFA’s initial catalogs (Giovanelli et al. 2005b, 2007; Saintonge et al. 2008), more than 20,000 sources will be detected out to .
Once an HI mass is detectable at an astrophysically significant distance, maximizing the survey area is more advantageous in increasing the detection rate than increasing integration time. The “fast” element of ALFALFA aims to survey a large amount of sky quickly, with a 1-Hz sampling rate for scans, and 40 second integration time per pixel. These observing parameters allow ALFALFA to detect low HI mass galaxies down to M in the Local Group and M at the distance of the Virgo Cluster. As such, a crucial goal of using ALFALFA’s low mass sample is a determination of the HI mass function (HIMF) both globally and in a variety of environments. Obtaining a statistically significant sample coupled with accurate distances for nearby galaxies will yield an accurate and robust determination of the faint end slope of the HI mass function, one of the many science goals of ALFALFA and HI astrophysics. Determining the statistics of these low-mass gas rich halos will also shed light on the “substructure” problem (Somerville 2002), which predicts that we should observe more satellite objects in the hierarchical structure formation paradigm.
ALFALFA is detecting a variety of objects including large disk galaxies and small low mass dwarfs in the Local Universe. Datasets provided by HI surveys like ALFALFA give systemic redshift, integrated line fluxes from spectral profiles, and velocity width measurements for cataloged objects. Approximately 500 galaxies will be resolved nearby. In addition to single galaxies, ALFALFA also provides data for extended tidal features and nearby high–velocity clouds, and gas-rich halos which may exhibit little or no stellar component.
The survey’s observing strategy has yielded an open shutter time of 97%. Final data cubes are constructed after two-pass transit observations of targeted areas are completed. ALFALFA’s public website is continually updated with schedules, survey information, and links to online catalogs. The survey’s first catalogs are being published in periodic installments as target areas and data cubes are completed. The first catalog (Giovanelli et al. 2007) detailed the results of 730 detections from the Northern Virgo region, while the second (Saintonge et al. 2008) yielded 488 detections in a direction opposite of the Virgo cluster. The results presented in this paper extend the release of the ALFALFA survey with 578 detections in the Virgo Cluster region south of first catalog.
Virgo is the nearest rich-cluster of galaxies with over 1300 reported members (Binggeli, Sandage & Tammann 1985; BST). Because of its proximity, high density, and location in the sky visible from Arecibo, Virgo is an important primary target area for ALFALFA. In addition, Virgo is often included in the coverage of both medium and large sky surveys (see ACS Virgo in Côté et al. 2004; BST; HIPASS; SDSS), creating an important synergy with one of ALFALFA’s primary target areas. Many late-type spiral galaxies are found in the outlying periphery, which has not yet virialized. As such, many of these gas rich galaxies are still infalling into the cluster, in contrast to the Virgo core spirals, known to be highly deficient in HI (Davies & Lewis 1973; Chamaraux et al. 1980; Giovanelli & Haynes 1983; Solanes et al. 2002). The catalog presented in this paper consists of HI sources extracted in Right Ascension between R.A.(J2000) and Declination between Dec.(J2000) . This area, covering 132 deg2, includes the portion of Virgo between cluster members M87 and M49 and complements the earlier catalog by Giovanelli et al. (2007).
The paper organization is as follows. Section 2 describes the observations and data reduction. Section 3 details the catalog contents and signal extraction reliability. Section 4 describes the sample statistics of the dataset. Section 5 deals with the positional accuracy of ALFALFA sources. Section 6 summarizes the results.
2 Observations and Data Reduction
ALFALFA utilizes a fixed azimuth drift mode observation scheme with the 7-element ALFA multi-beam receiver system. Each dual polarization feed has a beam that is ′ ′ in size. Beam maps of each feed can be found in Paper I. The ALFA array is rotated so that parallel feed tracks of constant J2000 declination are spaced at 1.05′. Scans are obtained with the telescope parked along the meridian–small corrections in zenith angle are applied between scans such that the beams are tracking along the constant epoch J2000 Declination. Fourteen simultaneous spectra are obtained at a sampling rate of 1 Hz in R.A. and scans are composed of 600 one–second records each sweeping 10 minutes of Right Ascension. The backend correlator setup uses a 100 MHz bandwidth centered at 1385 MHz. Raw scans have 4096 channels, giving a spectral resolution of 24.4 kHz ( km s-1 at 0). Other survey details about the observing and technical modes can be found in Paper I.
Raw data scans are processed offline for each observing session. Initial processing by team members includes flagging of radio interference, bandpass and flux calibration, data quality assessment, and identifying strong continuum sources. Observing runs are scheduled to fill in target area tiles that are composed of areas of sky. Once scheduled target area tiles are completed, the level I data scans are combined into regularly gridded 3-D data cubes, each 2.4 2.4 degrees in spatial extent, and 4 1024 channels in velocity space. These data cubes contain spectral data header information, coordinates, both polarizations, continuum data, map weightings, and scan makeup. An automated matched filter algorithm is used for signal extraction (Saintonge 2007). Candidate signals are later examined by eye, and integrated spectral profiles are created. Flux measurements, velocities, and widths are cataloged for publication and noted as possible followup candidates. The resulting data cubes are approximately 4 380 MB in size.
2.1 Continuum maps
In addition to the spectral line data, continuum maps are also created using data from the level I data scans, described in Giovanelli et al. (2007). Channels are flagged through the bandpass calibration process and/or the manual flagging process mentioned previously. A background total power continuum value is also computed for all time series records for all records and channels that have not been flagged, excluding point sources; the continuum contribution from these point sources is also stored for the creation of the continuum maps. Sources are detected with an automated peak finding algorithm, which then searches a database of NVSS (Condon et al. 1998) sources and looks for matches, comparing both fluxes and positions. Final positions are fit with a 2D Gaussian and stored along with peak flux measurements. These measurements are used to correct for positions offsets as described in section 5, and continuum source variability studies.
2.2 Data Access
As the ALFALFA collaboration includes many worldwide members, rapid dissemination of the data products is of the utmost importance to the survey’s success. The catalog results presented in this paper will be added to the existing ALFALFA archive at http://arecibo.tc.cornell.edu/hiarchive/alfalfa/. The site provides web services using protocols from the U.S. National Virtual Observatory111This research has made use of data obtained from or software provided by the US National Virtual Observatory(NVO), which is sponsored by the National Science Foundation.. The measurements and spectra will join the fast growing archive of HI measurements (Springob et al. 2005; Giovanelli et al. 2007; Saintonge et al. 2008). An ongoing development effort focuses on the long–term public delivery of the 3–D ALFALFA data set through web–based access tools. At this time, delivery of the 3-D data is made possible through the observing team itself, by direct contact to R.G. or M.P.H. A major challenge is data volume: after regridding the 3-D cubes covering the 34 individual “grids” from which the current catalog each occupy 50 GB. Allowing access and manipulation of the gridded data publicly will require the development of web services and server applications.
In this work, we present a catalog of HI sources extracted from the ALFALFA grids covering a region stretching from to in Dec. and from to in R.A. For reference to our database, denomination of the grids from which sources in this catalog were extracted are 1140+09 to 1348+09 and 1140+11 to 1348+11, in steps of 8m in R.A. The solid angle subtended by this region is 132 deg2, which is % of the sky to be ultimately surveyed by ALFALFA. The coverage of the region is complete by the target goals of ALFALFA, i.e. the region has been sampled by two separate passes with the ALFA array in drift mode.
3 Second Virgo Catalog
Raw data scans are processed to Level I (see Paper I for details) datasets upon completion of the observing sessions. The survey employs a two–pass system to yield a well spatially sampled dataset. Once the survey has completed two passes of a designated tile it is converted into regularly gridded data cubes. Base-lining, signal extraction, and source identification are completed and measurements are taken from integrated spectral profiles. These profiles originate from cutouts of the sub-grids, which are then used to create properly weighted source spectra.
Signal extraction is initiated in the Fourier domain with an automated matched filter algorithm (Saintonge 2007). Followup by eye confirms these sources and matches them with any possible optical counterpart found in the Sloan Digital Sky Survey (SDSS) or blue band imaging provided by the Digital Sky Survey. In addition, measurements and sources can be compared to NED and listings of existing HI observations. This facilitates quick response for followup with selected sources. Candidate detections are assigned to the following classes:
1. Signals that are extragalactic HI sources above a soft limit of S/N 6.5
2. Signals that are likely galactic or perigalactic in nature - high–velocity clouds.
3. Signals of lower S/N ( S/N ) but have
corroborating evidence based on identification of an
optical counterpart with similar redshift measurement at another wavelength.
Other low S/N candidates are placed in a separate listing for future followup.
Table 1 presents the results of the 578 detections from this portion of the survey. The column descriptions are as follows:
Col. 1: The catalog and source number
Col. 2: Arecibo General Catalog number. This number corresponds to a private database entry maintained by R.G. and M.P.H.
Col. 3: Centroid position of the HI source (R.A. and Dec. J2000). The listed position has been corrected for systemic pointing errors. Positional accuracy will be discussed in section 5.
Col 4: J2000 position of the most likely optical counterpart of the HI detection. The listed position has been examined by eye using SDSS or the Digital Sky Survey. The centroid accuracy is 2″. Optical images are examined for counterparts based on spatial proximity, morphology, color, and redshift. If no optical counterpart can be clearly identified, no optical position is recorded in the catalog – high–velocity cloud detections are included in this category. Comments are provided in column 14 if a preferable source is identified and other possible candidates are present in the field.
Col. 5: heliocentric velocity of the HI source in km s-1, , measured as the midpoint between the channels at which the flux density drops to 50% of each of the two peaks (or of one, if only one is present) at each side of the spectral feature. The error on to be adopted is half the error on the width, tabulated in Col. 7.
Col. 6: velocity width of the source line profile, , measured at the 50% level of each of the two peaks, as described for Col. 5. This value is corrected for instrumental broadening. No corrections due to turbulent motions, disk inclination or cosmological effects are applied. The instrumental correction used is that described by Springob et al. (2005). Therefore, the expression for is
| (1) |
where is the channel separation in km s-1.
Col. 7: estimated error on the velocity width, , in km s-1. This error is the sum in quadrature of two components: the first is a statistical error, principally dependent on the S/N ratio of the feature measured; the second is a systematic error associated with the subjective guess with which the observer estimates the spectral boundaries of the feature: maximum and minimum guesses of the spectral extent of the feature are flagged and the ratio of those values is used to estimate systematic errors on the width, the velocity and the flux integral. In the majority of cases, the systematic error is significantly smaller than the statistical error; thus the former is ignored.
Col. 8: integrated flux density of the source, , in Jy km s-1. This is measured on the integrated spectrum, obtained by spatially integrating the source image over a solid angle of at least ′′ and dividing by the sum of the survey beam values over the same set of image pixels (Shostak & Allen 1980). Estimates of integrated fluxes for very extended sources with significant angular asymmetries can be misestimated by our algorithm, which is optimized for measuring sources comparable with or smaller than the survey beam. A special catalog with parameters of extended sources will be produced after completion of the survey.
Col. 9: estimated uncertainty of the integrated flux density, in Jy km s-1. Uncertainties associated with the quality of the baseline fitting are not included; an analysis of that contribution to the error will be presented elsewhere for the full survey. See the description of Col. 7 for the contribution of a possible systematic measurement error.
Col. 10: signal–to–noise ratio S/N of the detection, estimated as
| (2) |
where is the integrated flux density in Jy km s-1, as listed in col. 8, the ratio is the mean flux across the feature in mJy, is either for km s-1or for km s-1[ is a smoothing width expressed as the number of spectral resolution bins of 10 km s-1bridging half of the signal width], and is the r.m.s noise figure across the spectrum measured in mJy at 10 km s-1resolution, as tabulated in Col. 11. In a similar analysis, in Giovanelli et al. ( 2005b; hereafter Paper II) we adopted a maximum smoothing width . See Figure 4 and related text below for details. The value of the smoothing width could be interpreted as an indication of the degree to which spectral smoothing aids in the visual detection of broad signals, against broad–band spectral instabilities. The ALFALFA data quality appears to warrant a more optimistic adoption of the smoothing width than previously anticipated.
Col. 11: noise figure of the spatially integrated spectral profile, , in mJy. The noise figure as tabulated is the r.m.s. as measured over the signal– and RFI-free portions of the spectrum, after Hanning smoothing to a spectral resolution of 10 km s-1.
Col. 12: adopted distance in Mpc, . For objects with km s-1, the distance is simply ; is the recessional velocity measured in the Cosmic Microwave Background reference frame and is the Hubble constant, for which we use a value of 72 km s-1Mpc-1. For objects of lower , we use a peculiar velocity model for the local Universe, as described in Paper II. Objects which are thought to be parts of clusters or groups are assigned the of the cluster or group. Cluster and group membership are assigned following the method described in Springob et al. (2007). A detailed analysis of group and cluster membership of ALFALFA objects will be presented elsewhere. Note that the Virgo cluster extends over much of the solid angle surveyed. This introduces unavoidable ambiguities in the distance assignment, as the peculiar flow model only corrects for large–scale perturbations in the velocity field and is unable to deal effectively with regions in the immediate vicinity of the cluster and along a section of a cone which contains the cluster, up to km s-1.
Col. 13: logarithm in base 10 of the HI mass, in solar units. This parameter is obtained by using the expression .
Col. 14: object code, defined as follows:
Code 1 refers to sources of S/N and general qualities that make it a reliable detection. By “general qualities” we mean that, in addition to an approximate S/N threshold of 6.5, the signal should exhibit a good match between the two independent polarizations and a spatial extent consistent with expectations given the telescope beam characteristics. Thus, some candidate detections with have been excluded on grounds of polarization mismatch, spectral vicinity to RFI features or peculiar spatial properties. Likewise, some features of are included as reliable detections, due to optimal overall characteristics of the feature. The S/N threshold for acceptance of a reliable detection candidate is thus soft. In a preliminary fashion, we estimate that detection candidates with in Table 1 are reliable, i.e. they will be confirmed in follow–up observations in better than 95% of cases (Saintonge 2007).
Code 2 refers to sources of low S/N ( 6.5), which would ordinarily not be considered reliable detections by the criteria set for code 1. However, those HI candidate sources are matched with optical counterparts with known optical redshifts which match those measured in the HI line. These candidate sources, albeit “detected” by our signal finding algorithm, are accepted as likely counterparts only because of the existence of previously available, corroborating optical spectroscopy. We refer to these sources as “priors”. We include them in our catalog because they are very likely to be real.
Code 9 refers to objects assumed to be HVCs; no estimate of their distances is made.
Notes flag. An asterisk in this column indicates a comment is included for this source in the text below.
Only the first few entries of Table 1 are listed in the printed version of this paper. The full content of Table 1 is accessible through the electronic version of the paper and will be made available also through our public digital archive site.
| Cat#-ID | AGC | HI Coords (2000) | Opt. Coords. | cz⊙ | ) | S/N | rms | Dist | Code | ||
|---|---|---|---|---|---|---|---|---|---|---|---|
| km s-1 | km s-1 | Jy km s-1 | mJy | Mpc | |||||||
| 3- 1 | 210497 | 113610.7+100304 | 113609.9+100319 | 6210 | 261 (23) | 2.58 (0.10) | 17.1 | 2.09 | 88.2 | 9.67 | 1 |
| 3- 2 | 213318 | 113610.9+114858 | 113612.2+114857 | 9518 | 229 (13) | 0.68 (0.06) | 6.2 | 1.61 | 133.7 | 9.46 | 2 |
| 3- 3 | 210517 | 113653.6+115040 | 113655.3+115053 | 10347 | 297 ( 5) | 1.16 (0.07) | 9.3 | 1.62 | 145.2 | 9.76 | 1 |
| 3- 4 | 213320 | 113713.2+114840 | 113714.3+114806 | 10714 | 122 ( 8) | 1.30 (0.05) | 17.6 | 1.49 | 150.3 | 9.84 | 1 |
| 3- 5 | 213100 | 113739.2+085134 | 113739.2+085151 | 3815 | 118 (36) | 0.50 (0.06) | 5.4 | 1.91 | 55.4 | 8.56 | 2 |
| 3- 6 | 210540 | 113805.9+111243 | 113808.1+111149 | 10660 | 316 (15) | 1.76 (0.10) | 10.5 | 2.11 | 149.5 | 9.96 | 1 |
| 3- 7 | 6605 | 113813.3+120646 | 113813.0+120643 | 982 | 89 ( 6) | 3.20 (0.07) | 35.7 | 2.11 | 11.6 | 8.00 | 1 |
| 3- 8 | 215419 | 113830.7+111357 | 113832.2+111316 | 13062 | 53 (14) | 0.63 (0.06) | 8.1 | 2.37 | 182.8 | 9.70 | 1 |
| 3- 9 | 210550 | 113844.5+105327 | 113846.1+105258 | 12788 | 301 (36) | 1.21 (0.12) | 5.7 | 2.73 | 179.0 | 9.96 | 2 |
| 3- 10 | 213025 | 113905.0+100815 | 113905.4+100807 | 12721 | 118 ( 5) | 1.14 (0.07) | 11.0 | 2.11 | 178.1 | 9.93 | 1 |
| 3- 11 | 213102 | 113911.8+093815 | 113911.6+093808 | 5963 | 137 (15) | 0.93 (0.07) | 9.0 | 1.96 | 84.8 | 9.20 | 1 |
| 3- 12 | 213103 | 113924.3+084254 | 113926.3+084222 | 5460 | 180 ( 6) | 0.76 (0.07) | 6.1 | 2.10 | 77.9 | 9.04 | 2 |
| 3- 13 | 6626 | 113952.1+085214 | 113952.8+085229 | 1984 | 156 (10) | 4.87 (0.07) | 43.1 | 2.02 | 29.6 | 9.00 | 1 |
| 3- 14 | 210582 | 114000.7+112745 | 114001.5+112746 | 10267 | 360 ( 4) | 2.86 (0.10) | 15.6 | 2.16 | 144.1 | 10.15 | 1 |
| 3- 15 | 6633 | 114018.8+090033 | 114018.5+090035 | 1810 | 294 (24) | 4.12 (0.10) | 23.4 | 2.29 | 29.6 | 8.93 | 1 |
3.1 Notes and Unique Detections
In addition to the detections reported by Kent et al. (2007) and Haynes et al. (2007) that exhibit
no apparent optical counterparts, a number of other detections exhibit unique properties:
ambiguous optical identification in need of optical followup, disturbed HI morphologies,
and HI connecting members of a galaxy pair or group. Some have presented
challenges in the data reduction process, and special care has been
taken to accurately extract the spectra. Other clear detections may or may not
be associated with previously uncataloged low surface brightness detections
in the vicinity of a given HI centroid.
Many of these detections will be described in future publications
with the added benefit of followup observations and detailed analysis
both at radio and other wavelength regimes (Kent et al. in preparation).
Notes associated with the objects listed in Table 1 follow:
3- 6 In group with AGC 213325 and AGC 213324
3- 8 Crowded opt field, ambiguous opt id
3- 26 Blend with UGC 6668/NGC 3825; part of WBL 350-005; 10 members in grp
3- 27 Blend with UGC 6661/NGC 3822
3- 29 Poor data quality: params uncertain
3- 43 Blend with UGC 6692/NGC 3833
3- 48 Poor data quality; params uncertain
3- 50 Edge of single pass; params uncertain
3- 52 Possible blend with UGC 6715
3- 53 HI merges in spectral region affected by rfi; params very uncertain
3- 56 Very lsb optical counterpart
3- 60 Single pass coverage; params very uncertain
3- 61 Extension of HI 2′ to the north.
3- 70 Ambiguous optical id; could be object to at 114603.7+105127
3- 79 Poor data quality: params uncertain
3- 84 Possible HI envelope extended to the S.
3- 93 Only one drift contributing.
3- 95 Blend with HI tail leading N UGC 6871
3-115 Ambiguous optical id; also possible AGC 211853 at 115950.9+084735
3-116 Poor data quality: params uncertain
3-117 Poor baseline: params uncertain
3-125 Emission merges in region affected by rfi: params uncertain
3-130 Single pass only; params uncertain
3-136 Extended HI tail leading 4′south
3-145 In group with UGC 7066
3-147 In group with UGC 7066 and AGC 224237 at 120447.1+103735
3-149 Interacting system with AGC 220075 at 120536.4+085917
3-152 Emission merges in region affected by rfi: params very uncertain.
3-153 Params uncertain
3-155 No discernible optical counterpart (see Kent et al. 2007)
3-157 Ambiguous optical id: AGC 224552 also possible to N at 120916.80+103500
3-161 Galaxy emission merges with region affected by rfi: params uncertain; opt id ambiguous: other possible counterpart AGC 224603 at 121018.81+112105
3-165 Poor baseline: params uncertain
3-182 Large z mismatch between opt and HI; no other clear opt counterpart for HI
3-187 Very LSB counterpart.
3-188 HI tail extending 5′NE.
3-189 Very LSB counterpart.
3-191 Triple peaked spectrum
3-194 Very LSB counterpart.
3-201 Ragged data; params uncertain
3-208 Possible optical id also at 121843.14+114334
3-216 Pair with UGC 7383
3-218 Ambiguous optical id: also possible at 122026.5+085023
3-221 Ambiguous optical id: also possible at AGC 220015 at 122040.8+083538
3-222 Ambiguous optical id: also possible at AGC 224621 at 122045.9+115340
3-227 Blend with UGC 7414
3-228 Blend with AGC 7407
3-229 near Galactic MW HI
3-236 Ambiguous optical id: also possible at 122212.4+115515
3-241 Emission merges in region affected by rfi: Params very uncertain.
3-255 Positional offset significant; optical id uncertain: also possible at 122609.9+080949
3-258 Blend with AGC 224604 at 122629.6+090109
3-259 Pair with UGC 7546
3-260 Pair with UGC 7537
3-266 Extended HI tail
3-278 Very LSB counterpart
3-282 Poor baseline; params uncertain
3-285 No discernible opt counterpart. Discussed in Kent et al. (2007).
3-287 Detected by Oosterloo & Van Gorkom and also McNamara et al. Discussed in Kent et al. (2007).
3-289 Poor baseline; params very uncertain
3-290 No discernible optical counterpart. Discussed in Kent et al. (2007).
3-291 No discernible optical counterpart. Discussed in Kent et al. (2007).
3-292 VCC1295; LSB counterpart.
3-294 Possible opt id with v LSB object 1.5’ to NE; positional offset signficant
3-295 Poor baseline - vicinity of M87.
3-296 No discernible optical counterpart. Discussed in Kent et al. (2007).
3-299 Very LSB optical counterpart
3-300 Poor baseline: Close proximity to continuum source; params uncertain.
3-303 Affected by proximity to MW emission; params. mildly uncertain.
3-307 No optical counterpart; extended HI: HVC
3-311 No optical counterpart; extended HI: HVC
3-315 No optical counterpart; extended HI: HVC
3-323 Blend of UGC 7777/7776, separation of pair is 2′.
3-324 Emission affected by rfi: Params mildly uncertain.
3-341 Confused blend with galaxies AGC 226457 at 124020.7+081221 and AGC 224170 at 124023.0+081034
3-342 Emission merges into region affected by rfi: params uncertain
3-347 Affected by rfi; params mildly uncertain
3-349 Ambiguous optical id; also possible counterparts at 124133.0+082110 and 124123.9+082158
3-352 No optical counterpart; extended HI: HVC
3-354 Affected by rfi; params mildly uncertain
3-357 Part of a group; possible extended envelope.
3-359 Ambiguous opt id; also possible counterpart at 124351.3+110254
3-361 Affected by rfi; params uncertain
3-362 Affected by rfi; params uncertain
3-364 Edge of map: params uncertain; optical id ambiguous: also possible counterpart AGC 220986 at 124445.6+094526
3-365 Pair of galaxies; optical id ambiguous; also possible counterpart at 124456.7+101627
3-366 Ambiguous opt id; also possible counterpart at 124507.8+094640
3-371 No optical counterpart; extended HI: HVC
3-377 No optical counterpart; extended HI: HVC
3-378 No optical counterpart; faint LSB at 124641.7+102309, 2.3′N
3-380 No optical counterpart; extended HI: HVC
3-386 Extended HI emission
3-388 Optical id ambiguous: also possible AGC 221031 at 124835.5+090733
3-392 Very LSB counterpart
3-395 No optical counterpart; extended HI: HVC
3-400 No optical counterpart; extended HI: HVC
3-403 No optical counterpart; extended HI: HVC
3-404 Emission from apparently blank opt field, in vicinity of UGC8037. See Kent et al. 2007
3-405 Possible blend with UGC8045 at 3.2′ E
3-406 Emission from apparently blank opt field, in vicinity of UGC 8037. See Kent et al. 2007
3-407 Emission from apparently blank opt field, in vicinity of UGC 8037 and AGC 221110. See Kent et al. 2007
3-408 Blend with emission of UGC 8042 at 1.5′ SE
3-410 No optical counterpart; extended HI: HVC
3-411 Very LSB.
3-413 No optical counterpart; extended HI: HVC
3-420 Blend with emission of UGC 8089 at 1′ NW
3-455 Emission merges into area affected by rfi
3-458 Possible blend with emission from galaxy at 131021.6+084510, 2′ E
3-461 Affected by rfi, params uncertain; ambiguous opt id: also possible id with AGC230140 at 131055.7+115230 or AGC230138 at 131050.8+115216
3-469 Possible blend with emission from AGC 231046 at 131313.8+094052
3-474 Possible blend with AGC 230192 at 131500.11+100142.6; differs by 300 km s-1.
3-478 No optical counterpart; extended HI: HVC
3-486 No optical counterpart; extended HI: HVC
3-490 Blend with UGC 8421
3-497 Very near the spectral band edge; params and detection uncertain
3-498 Ragged data; params uncertain
3-503 Possible blend with galaxy at 132850.5+114508
3-522 Possible blend with AGC 230401 at 133218.8+102648
3-543 Affected by rfi; params uncertain
3-546 Affected by rfi; params very uncertain
3-558 Affected by rfi; params very uncertain
3-563 Extended HI emission in N-S direction
3-568 Blended with AGC 230646 at 134653.8+113703
3-570 Possible blend with AGC 233837 at 134728.5+095134
4 Statistics of the Catalog
578 detections are presented for this region: 435 (76%) are code “1” detections that rate fair to excellent in quality; 129 (23%) are code “2” detections that have known priors associated with them – optical redshifts corroborate these lower S/N detections; the remaining 14 detections (2%) are high–velocity clouds. The completeness and reliability of the ALFALFA detection process are discussed by Saintonge (2007). Follow-up observations on lower signal-to-noise candidates from the entire survey are currently underway and will be discussed in future publications.
26% of the detections presented in this catalog have km s-1, a large fraction explained by the fact that this portion of the survey crosses the Virgo region and supergalactic plane where the density of galaxies is higher. The detection rate is 4.3 objects per square degree. Excluding the HVC detections, 2% do not have apparent optical counterparts. These “optically unseen” HI clouds were reported by Kent et al. (2007). Of particular interest is a cloud complex of five detections located halfway between M87 and M49. If not gravitationally bound, the system will disperse in less than a cluster crossing time. The detections and aperture synthesis followup are described by Kent (2007b).
The described catalog, when combined with that of strips to the North presented by Giovanelli et al. (2007) presents a wealth of information to complement existing and future Virgo Cluster surveys across the spectrum. The survey’s power in redshift detection in the local Universe can be compared with previous HI surveys. ALFALFA improves upon previous HI surveys in numbers and positional accuracy of the first generation HI survey HIPASS. Wong et al. (2006) reported on 40 detections from the HIPASS survey in the same ALFALFA region for this paper’s catalog. ALFALFA also complements the GOLDMINE database (Gavazzi et al. 2003), an optically selected compilation of Virgo galaxies. Long integrations were used on some of the GOLDMINE detections, as a result some are fainter than the ALFALFA detection limit. 16% of the detections presented in this catalog give new redshifts, and 60% are detected in HI for the first time.
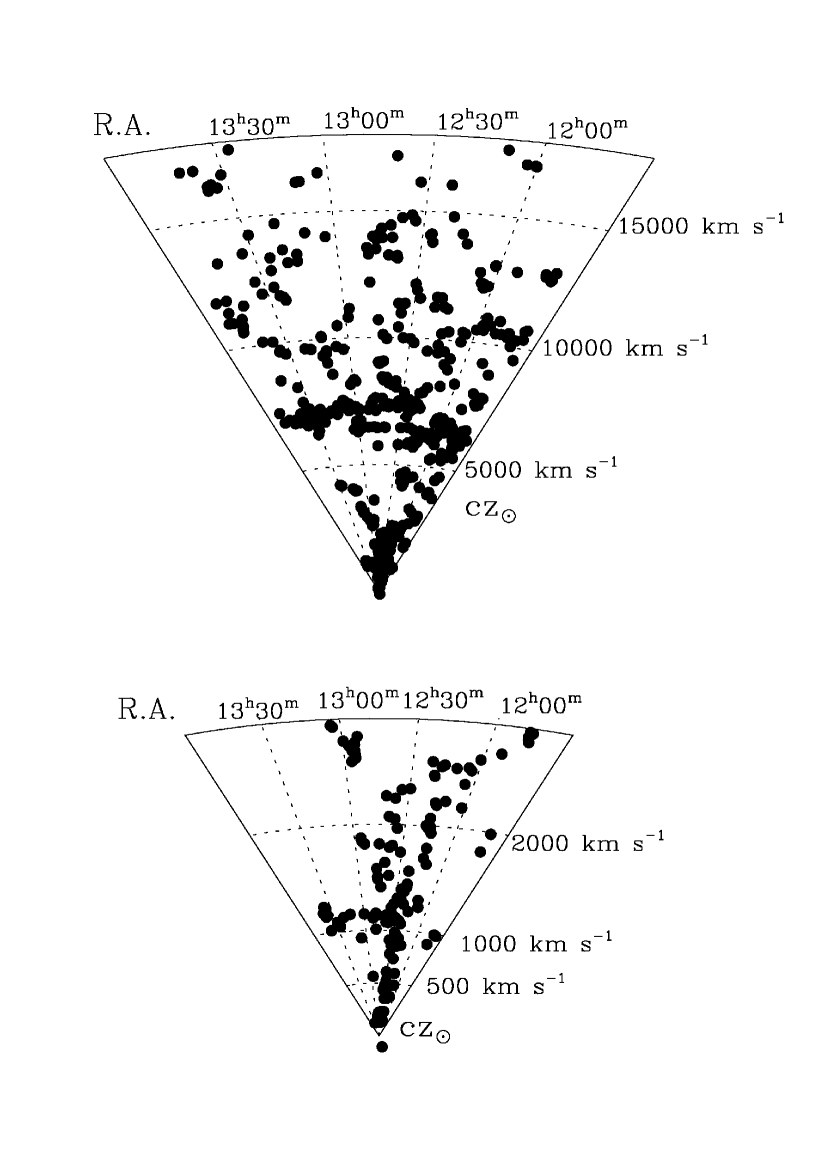
The region of sky presented with this catalog lies south of M87 and is shown in Figure 1. The upper panel displays all detections, while the lower panel shows detections found at km s-1. A R.A. versus cone diagram is shown in Figure 2. Various distributions of the catalog parameters are shown in Figure 3: (a) shows large scale structures of Virgo and the A1367-Coma supercluster regime in a velocity distribution, as well as the high gap near 15,000 km s-1resulting from RFI; panels (b), (c), and (d) show the distributions for the velocity width W50, the integrated flux and S/N ratio respectively. The final panel (e) shows the HI mass distribution, with distances computed from velocity flow models (Tonry et al. 2000; Masters et al. 2004). The uncertainty in the distance of galaxies projected on a narrow cone centered on the Virgo Cluster causes detections to have uncertain calculated HI masses. Other distance indicator techniques will need to be employed in order to properly determine an accurate HI mass function. This topic will be discussed in future publications.
The top panel of Figure 4 shows the Spänhauer diagram, detailing the HI mass vs. distance for the objects in the catalog. The placement of nearby objects at the Virgo distance by the velocity flow model is clearly seen as the vertical gathering of objects at 16.7 Mpc. Regions affected by RFI are also indicated with vertical dashed lines. The middle panel of Figure 4 shows the S/N ratio versus measured velocity width of the catalog entries, demonstrating the independence of signal extraction on velocity widths. The bottom panel of Figure 4 shows the integrated flux versus measured velocity width. The dashed line indicates the a S/N limit of 6.5, the rough limit of code 1 objects listed in Table 1.
5 Positional Accuracy of Cataloged Sources
Continuum sources are extracted and their positions measured in a “telescope” coordinate reference frame. This reference frame is determined at the Observatory separately for each receiver system by optimizing a model fit to a set of pointing calibrators. Repeatable residuals from this model translate into small scale pointing errors, which typically have amplitudes on order of 15″ for the ALFA array receivers. These errors vary with both azimuth and zenith angle. Because ALFALFA observations are made with ALFALFA at the meridian (constant azimuth), and consist of long runs at constant zenith angle, the ALFALFA sources’ positions in the telescope reference frame easily reveal the systematic errors represented by those residuals, when they are compared with the positions of a higher resolution – and thus higher accuracy – coordinate reference system. In this section we compare HI source positions obtained in the Arecibo telescope reference system with two such, more accurate position sets: those of optical galaxies and those of VLA radio continuum sources (NVSS; Condon et al. 1998).
5.1 Positional Differences between HI and Optical Sources
The accuracy of positional HI centroids is important in establishing correct optical identifications. The ALFALFA catalogs are presented to the astronomical community with positions as accurate as possible. As this catalog lies just south of the Paper III catalog, the telescope configuration used in obtaining the data is similar. The impact of the telescope pointing is similarly recovered as we describe below.
The 3.3′3.8′ FWHM elliptical beam of the Arecibo telescope affords the ALFALFA survey greater positional accuracy than previous large scale blind HI surveys. This factor in the survey characteristics becomes important when matching HI detections with their optical counterparts, if they exist. Positional accuracy is limited by the beam size, signal–to–noise, and errors in the telescope’s pointing. For the region of sky surveyed in this paper, the ALFA receiver system is oriented such that the beam’s major axis is in the Declination direction and the telescope’s azimuth arm is aligned in the North–South direction.
Processed ALFALFA drift scans are combined and re-gridded into a data cube that is spatially sampled at 1′1′ . Gaussian weighting is also applied and the final resolution is 3.8′4.3′. Sources and their associated measured parameters are extracted from these derived data cubes. Source extraction is carried out via an automated matched filter algorithm with visual followup confirmation by a project team member. Once a source is identified, a 2-D map is integrated over the spectral extent of the object, with ellipses fit to the quarter and half–power levels of the measured peak, as well as other preset isophotal levels. As most sources are unresolved by the ALFA beam, the HI source position is taken to be the center of the half–power ellipse. Extended objects that may exhibit warped or asymmetric disks are treated with extra care as the ellipse may not provide the best estimate of the position center.
The systematic pointing errors of the telescope can be recovered due to the fixed azimuth telescope observing mode employed by the survey. These errors add to 15″ or more at L–band frequencies with the maximum pointing errors occurring when the telescope is at high (or very low) zenith angles.
Positions of optical counterparts of HI sources are obtained by team members through the Digital Sky Survey, from the SDSS database, or through the local Arecibo General Catalog maintained at Cornell. Figure 5 shows the positional differences (HI minus optical) for four different Declination ranges, each binned by 1∘. The points correspond to sources that have optical counterparts – optically inert HI clouds, HVC, and tidal tails are not included. The position differences can be attributed to centroiding statistical errors, optical misidentification, and the previously mentioned telescope pointing offsets. The optical centroid errors are negligible when compared to the other source errors. The telescope pointing errors contribute to the majority of the systematic error budget, as illustrated by offsets in the data distribution from the center of the plots.
Signal–to–noise affects the accuracy of the HI position centroid. Figure 6 shows the positional accuracy of the HI positions, after correction for telescope pointing errors, for various S/N regimes. For the higher S/N detections the median centroid error is approximately 15″.
5.2 Positional Errors as Derived from Radio Continuum Sources
In addition to spectral data cubes, ALFALFA data are used to generate regularly gridded continuum maps. Continuum sources are extracted and their positions determined. These maps are used to determine pointing corrections for the ALFALFA catalog objects by comparing centroid positions with those published by the NRAO VLA Sky Survey (NVSS; Condon et al. 1998). The positions presented in this catalog and in catalogs published on the online ALFALFA data archive are corrected via the method presented here. The pointing corrections utilize data from sixty-four data cubes from the Paper III catalog and the catalog presented in the paper.
Continuum sources for position comparison are selected with a priori information from the NVSS. For identification accuracy, the positions of high signal–to–noise objects are used. Therefore, for each region of sky defined by an ALFALFA data cube, an NVSS source subset is identified with a peak intensity mJy beam-1. The average r.m.s of the NVSS source catalog is 0.48 mJy beam-1. For each of the sources in the subset, a 9′ box is cutout for the ALFALFA data centered on the NVSS centroid position. A 2-D Gaussian fit is attempted in this window. If the fit converges, then the position from peak of the fit is compared with any NVSS sources in the box. This process consists of comparing the ALFALFA continuum centroid with any possible NVSS positions and flux totals in the 9′ box. If the sum of the NVSS fluxes differs from the measured ALFALFA flux by more than 50%, then the source is not used in the pointing correction. Because of the differences in beam sizes, several NVSS sources may be confused and seen as one source in the ALFALFA beam. Therefore, if flux agreement is achieved between the ALFALFA and NVSS entries, acceptable sources are saved and position differences are computed in Right Ascension and Declination.
Using this automated method for cross-identification of NVSS sources yields 1583 objects with centroid positions in the ALFALFA data cubes covering 240 deg2 of sky. The differences between the ALFALFA and NVSS centroids are plotted in Figure 7. These position differences are binned in quarter degree Declination increments. The robust mean position for each Declination bin is plotted in Figure 8, with vertical bars indicating the error on the mean and the horizontal bars indicating the bin width. A third order polynomial is fit through these averaged points, and the resulting coefficients are used to correct the pointing in the catalog. The positions for the HI detections published in this paper reflect these pointing corrections, which remove telescope pointing errors from the HI centroids in our catalogs.
6 Summary
This paper completes another important part of the ALFALFA survey toward the Virgo Cluster region. The catalog presented here completes the Virgo “core” area centered around M87 and its periphery. The sample of galaxies detected yield a redshift distribution exhibiting large scale structure from Virgo and the Coma Supercluster regime, shown in Figures 2, 3 and 4. The catalog covers 132 deg2 of sky south of M87, completing another 2% of the survey. The complementary conclusions to the Paper III catalog are as follows:
-
•
The third ALFALFA catalog installment presented here completes the core of the Virgo cluster region initiated with Paper I. Together, Paper I and Paper VI complement the initial anti-Virgo catalog (Saintonge et al. 2008) for future analysis.
-
•
Objects of interest include a cloud complex lying midway between M87 and M49 that do not correlate with any apparent optical counterpart. The complex exhibits a velocity dispersion of 250 km s-1 between 400 and 640 km s-1. The spatial extent of the complex is over 200 kpc if it is at the Virgo distance. An analysis of this system, including aperture synthesis followup, will be detailed in Kent et al. (in preparation) .
-
•
The median for the catalog presented here is 6500 km s-1; the redshift distribution is analogous to that of the first Virgo catalog (Giovanelli et al. 2007).
-
•
A number of high velocity clouds with velocities between -150 and +200 km s-1 are detected. Given the proximity of the region surveyed to the North Galactic Pole, their heliocentric velocities are minimally affected by galactic rotation and represent true infall or outflow motions.
In conclusion, we present the third catalog release of the ALFALFA survey, bringing the total projected sky coverage to 5%. This installment of the survey and its associated data products will be incorporated into the more extensive digital HI dataset at http://arecibo.tc.cornell.edu/hiarchive/alfalfa/.
RG and MPH acknowledge the partial support of NAIC as Visiting Scientists during the period of this work. RAK and TB thank NAIC for partial support. RAK, TB, and NB are grateful to NAIC and the Cornell University Astronomy Department for its hospitality to them as sabbatic visitors. This work has been supported by NSF grants AST–0307661, AST–0435697, AST–0347929, AST–0407011, AST–0302049; and by a Brinson Foundation grant. We thank the Director of NAIC, Robert Brown, for stimulating the development of major ALFA surveys, Héctor Hernández for his attention to the telescope scheduling and the Director, telescope operators and support staff of the Arecibo Observatory for their proactive approach. We thank Tom Shannon for his advice and assistance with hardware, system and network issues at Cornell. We also thank the referee for their useful comments on this work.


References
- (1) Barnes, D.G, Staveley–Smith, L., de Block, W.J.G., Oosterloo, T., Stewart, I.M. et al. 2001, MNRAS, 322, 486
- (2) Binggeli, B., Sandage, A. & Tammann, G.A. 1985, AJ, 90, 1681
- Chamaraux et al. (1980) Chamaraux, P., Balkowski, C., & Gerard, E. 1980, A&A, 83, 38
- Condon et al. (1998) Condon, J. J., Cotton, W. D., Greisen, E. W., Yin, Q. F., Perley, R. A., Taylor, G. B., & Broderick, J. J. 1998, AJ, 115, 1693
- Côté et al. (2004) Côté, P., et al. 2004, ApJS, 153, 223
- (6) Davies, R.D. & Lewis, B.M. 1973, MNRAS, 165, 213
- (7) Gavazzi, G., Boselli, A., Donati, A., Franzetti, P. & Scodeggio, M. 2003, A&A, 400, 451
- (8) Giovanelli, R. & Haynes, M.P. 1983, AJ, 88, 881
- (9) Giovanelli, R., Haynes, M.P., Kent, B.R. et al. 2005a, AJ, 130, 2598 (Paper I)
- (10) Giovanelli, R., Haynes, M.P., Kent, B.R. et al. 2005b, AJ, 130, 2613 (Paper II)
- (11) Giovanelli, R., Haynes, M.P., Kent, B.R. et al. 2007, AJ, 133, 2569
- Haynes (07) Haynes, M. P., Giovanelli, R., & Kent, B.R. 2007, ApJ, 665,L19
- (13) Kent, B.R. Giovanelli, R., Haynes, M.P. et al. 2007, ApJ, 665, L15
- (14) Kent, B.R. 2007b, IAU #244
- (15) Masters, K.L., Haynes, M.P. & Giovanelli, R., 2004, ApJ, 607, L115
- (16) Meyer, M.J., Zwaan, M.A., Webster, R.L. et al. 2004, MNRAS, 350, 1195
- (17) Rosenberg, J.L. & Schneider, S.E. 2002, ApJ, 567, 247
- (18) Saintonge, A.et al. 2008, AJ, 135,588
- Saintonge (2007) Saintonge, A. 2007, AJ, 133, 2087
- (20) Shostak, G.S. & Allen, R.J. 1980, A&A, 81, 167
- (21) Skrutskie, M.F., Cutri, R.M., Stiening, R., Weinberg, M.D., Schneider, S. et al. 2006, AJ, 131, 1163
- (22) Solanes, J.-M., Sanchis, T., Salvador–Solé, E. et al. 2002, AJ, 124, 2440
- (23) Somerville, R.S. 2002, ApJ, 572, L23
- (24) Springob, C.M., Haynes, M.P., Giovanelli, R. & Kent, B.R. 2005, ApJS, 160, 149
- (25) Springob, C.M., Masters, K.L., Haynes, M.P., Giovanelli, R. & Marinoni, C. 2007, ApJS, 172, 599
- (26) Tonry, J.L., Blakeslee, J.P., Ajhar, E.A., & Dressler, A. 2000, ApJ, 530,625
- (27) Wong, O.I., Ryan–Weber, E.V., Garcia–Appadoo, D.A. et al. 2006, MNRAS, 371, 1855
- (28) York, D.G., Adelman, J., Anderson, J.E., et al. 2000, AJ, 120, 1579