11email: nagar@astro-udec.cl,jmatulich@udec.cl
Ultra-High Energy Cosmic Rays Detected by the Pierre Auger Observatory:
Abstract
Context. The Pierre Auger Collaboration has reported 27 Ultra-High Energy Cosmic Ray Events (UHECRs) with energies above 56 eV (56 EeV) and well determined arrival directions as of 2007 August 31. They find that the arrival directions of these UHECRs are not isotropic, but instead appear correlated with the positions of nearby Active Galactic Nuclei (AGNs) from the catalog of Véron-Cetty & Véron.
Aims. Our aim was to determine the sources of these UHECRs by comparing their arrival directions with more complete and/or comprehensive astronomical source catalogs.
Methods. We have cross correlated the arrival directions of the UHECRs with the positions of supernovae, radio supernovae, galaxies, active galaxies, radiogalaxies, and clusters of galaxies, all at distances within 200 Mpc.
Results. Four (eight) of the 27 UHECRs with energy greater than 56 EeV detected by the Pierre Auger Observatory have arrival directions within 1.5∘ (3.5∘) of the extended ( 180 kpc) radio structures of nearby radiogalaxies or the single nearby BL Lac with extended radio structure. Conversely the radio structures of three (six) of all ten nearest extended radiogalaxies are within 1.5∘ (3.5∘) of a UHECR; three of the remaining four radiogalaxies are in directions with lower exposure times. This correlation between nearby extended radiogalaxies and a subset of UHECRs is significant at the 99.9% level. For the remaining 20 UHECRs, an isotropic distribution cannot be ruled out at high significance. The correlation found by the Auger Collaboration between the 27 UHECRs and AGNs in the Véron-Cetty & Véron catalog at D71 Mpc has a much lower significance when one considers only the 20 UHECRs not ‘matched’ to nearby extended radiogalaxies. No clear correlation is seen between UHECRs and supernovae, supernova remnants, nearby galaxies, or nearby groups and clusters of galaxies.
Conclusions. Nearby extended radiogalaxies are the most likely source of at least some UHECRs detected by the Pierre Auger Observatory. The remaining UHECRs are not inconsistent with an isotropic distribution; their correlation to nearby AGNs is much less significant than earlier estimated. This is the first direct observational proof that radio galaxies are a significant source of UHECRs. The primary difference between the UHECR detections at the Pierre Auger Observatory and previous experiments, e.g. AGASA, may thus primarily be that the Southern Hemisphere is more privileged with respect to nearby radiogalaxies with highly extended radio jets and lobes.
Key Words.:
interstellar-medium: Cosmic Rays – Galaxies: Active – Galaxies: jets;1 Introduction
Ultra-High Energy Cosmic Rays (UHECRs) are protons or light nuclei with energies greater than about 1019 eV (10 EeV). When these highly energetic particles enter the earth’s atmosphere they produce a shower of secondary particles and excite the Nitrogen molecules in the atmosphere; both effects can be detected from the ground. Recent advances in ground shower detectors allow a precise measurement of both the initial energy and the arrival direction of the UHECR above the earths atmosphere, e.g. AGASA (Takeda et al., 1999) and the Pierre Auger Observatory (Abraham et al., 2004; de Mello Neto et al., 2007). While UHECRs are rare they have a unique astronomical potential: UHECRs with energies 50 EeV are not expected to be deflected significantly by Galactic or intergalactic magnetic fields. Their measured arrival directions can therefore be traced directly back to the originating source within the observatory measurement uncertainties.
Suspected sources of high energy cosmic rays include core collapse Supernovae (SN II), Supernova Remnants, Pulsars, Active Galaxies - especially radio jets and radio lobes, and gamma rays bursts (for reviews and lectures see Kachelriess (2008); Hillas (1999) and references therein). In these sources, the cosmic rays are posited to undergo successive accelerations via scattering off energetic charged particles and/or in shocks. More exotic explanations include an origin in dark matter anhilation.
The main energy loss for UHECR propagating over cosmological distances is expected to be pion-production, the so called Greisen Zatsepin Kuzmin (GZK) effect (Greisen, 1966; Zatsepin & Kuzmin, 1966). In this process, a UHECR interacts with a CMB photon and loses an estimated 30% of its energy. Both the energy loss and the mean free path between interactions depend on several details; energy loss length predictions vary between 20 and 100 Mpc (see e.g. Stanev (2004),Kachelriess (2008),PA08). If the GZK effect is at work then UHECRs with energy above 50 EeV are expected to originate primarily in sources closer than this predicted energy loss length.
The Pierre Auger Observatory (hereafter PAO) in Argentina (Abraham et al., 2004; de Mello Neto et al., 2007), an array of 1600 Cerenkov detectors spread over 3000 km2 plus six optical telescopes, is designed to measure arrival directions and energies of cosmic rays via their secondary particle showers and their atmospheric flouresence. Latest details on the instrumentation and exciting science results being produced by the Auger Observatory and Collaboration can be found at the Auger web-site http://www.auger.org. The array has been in partial operation since January 2004. The Auger collaboration has reported 81 events between 2004 January 1 and 2007 August 31 with reconstructed energies above 40 EeV and zenith angles smaller than 60∘; of these, 27 have energies above 56 EeV (Pierre Auger Collaboration et al., 2007, 2008, hereafter PA07,PA08). The origins of the latter 27 UHECRs are the focus of this paper.
The Auger Collaboration found that the arrival directions of the 27 UHECRs with energies above 56 EeV are not isotropic at a 99% significance level (PA07,PA08). Instead, they found that the arrival directions are correlated with the positions of AGNs within 71 Mpc (PA07,PA08,Mollerach et al. (2008)). For this analysis they used all AGNs (and galaxies with H II nuclei) in the catalog of Véron-Cetty & Véron, 12th Edition (Véron-Cetty & Véron, 2006). In their statistical correlation of all 81 UHECRs at energy above 40 EeV with the Véron-Cetty & Véron catalog of AGNs, PA07,PA08 found that the highest correlation between UHECRs and AGNs was obtained for a maximum AGN distance of 71 Mpc, an angular separation of 3.2∘ between “matched” AGNs and UHECRs, and an energy threshold for UHECRs of 56 EeV. This maximum distance, 71 Mpc, is in line with the expectations of the GZK effect. Gorbunov et al. (2007), in an astro-ph comment, disagreed with this finding, pointing out that weighting each AGN with its distance would predict a very different distribution of UHECRs than that found by the PAO.
Our interest in this topic was provoked when a quick examination of the 27 UHECR events showed that the direction of at least five of the 27 UHECR events were directly in the line of sight to nearby extended radiogalaxies. In this article, we attempt a more comprehensive correlation between the arrival directions of the 27 UHECRs with energies above 56 EeV and catalogs of potential sources of UHECRs, both Galactic and Extragalactic. Sec. 2 describes the data used in our study, Sec. 3 describes the principle results obtained, and Sec. 4 contains a brief discussion and conclusions of our study. Distances to galaxies are calculated using 72 , except for relatively nearby galaxies for which we use distances as referenced.
2 Data
Positions and energies of the 27 UHECRs detected by the PAO with energies 56 EeV were taken from PA08. The figures in this publication are slightly different from those of the Auger collaboration: PA07 and PA08 used the Aitoff projection (an equidistant projection with 2:1 aspect ratio), while we use the Aitoff-Hammer projection (an equal area projection). The latter is more commonly used in astronomy and is typically referred to as simply the ‘Aitoff’ projection, e.g. the IDL procedure aitoff.pro. Positions and energies of the UHECRs detected by AGASA are taken from Hayashida et al. (2000) which is an updation of the data listed in Takeda et al. (1999).
Our catalogs of astronomical sources are drawn from various publications and web-based source lists. In all cases we attempted to assemble as complete a sample as possible. Further, following the results of PA07, PA08, and the expectations from the GZK effect, we considered only objects within a distance of 200 Mpc. For matches to the PAO UHECRs we consider only those sources which rise above elevation 30∘ at PAO since the PAO UHECR list includes only UHECRs detected above this elevation.
Our list of extragalactic supernova remnants, galaxies, and galaxy clusters were drawn from NED (Madore et al., 1992) using the ‘All Sky Search’ option. The list of Gamma Ray Bursts (GRBs) was taken from the Gamma-ray Burst Real-Time Sky Map111http://grb.sonoma.edu. For Galactic Supernova Remnants we used the list maintained by D. Green222http://www.mrao.cam.ac.uk/surveys/snrs/snrs.data.html. Extragalactic Radio Supernova were taken from Kurt Weiler’s list at the web-site of the Naval Research Laboratory333http://rsd-www.nrl.navy.mil/7213/weiler/kwdata/RSNtable.txt. For extragalactic supernova, we used the Sternberg Astronomical Institute (SAI) Supernova Catalog444http://www.sai.msu.su/sn/sncat/ maintained by Tsvetkov et al. In the case of radiogalaxies and radio sources we used several surveys and catalogs, including NVSS (Condon et al., 1998), SUMMS (Bock et al., 1999), and NED. The list of extragalactic jets is based on that compiled by Liu & Zhang (2002); to this list we added data on the galaxies as given in NED, and re-measured the total flux and total extent of the radio emission from NVSS and SUMMS maps. The total extent of the radio emission therefore includes both radio jets and any radio lobes. This extent is typically referred to as the Largest Angular Size (LAS) or Largest Linear Size (LLS). In this work we added the LLS of the individual jets and lobes as scalars instead of vectors in order to discount the effects of jet and lobe bending.
To recreate the results of the Auger Collaboration (PA07,PA08), we used the 12th edition of the Véron-Cetty & Véron (2006) catalog of AGNs. The list of AGNs (agn.dat) in this catalog includes nuclei with H II spectra which were previously misclassified as AGNs. These should ideally be left out of the correlation analysis. From the AGN statistics quoted in PA07,PA08, it appears that the Auger Collaboration included these H II nuclei in their analysis, so for consistency we do the same. Additionally, the list of QSOs (qso.dat) lists seven galaxies with redshift=0. Four of these are truly nearby galaxies, and the other three are probably high redshift quasars. Again, for consistency with PA07 and PA08 we keep the latter three in our analysis.
We have also used the Fanaroff-Riley (FR) classification for radiogalaxies (Fanaroff & Riley, 1974). This division is based on whether the jets increase (FR II) or decrease (FR I) in brightness with increasing distance from the nucleus. A clear division in radio luminosity is found between the two classes, with FR IIs being more luminous in the radio than FR Is (Owen & Ledlow, 1994).
3 Results
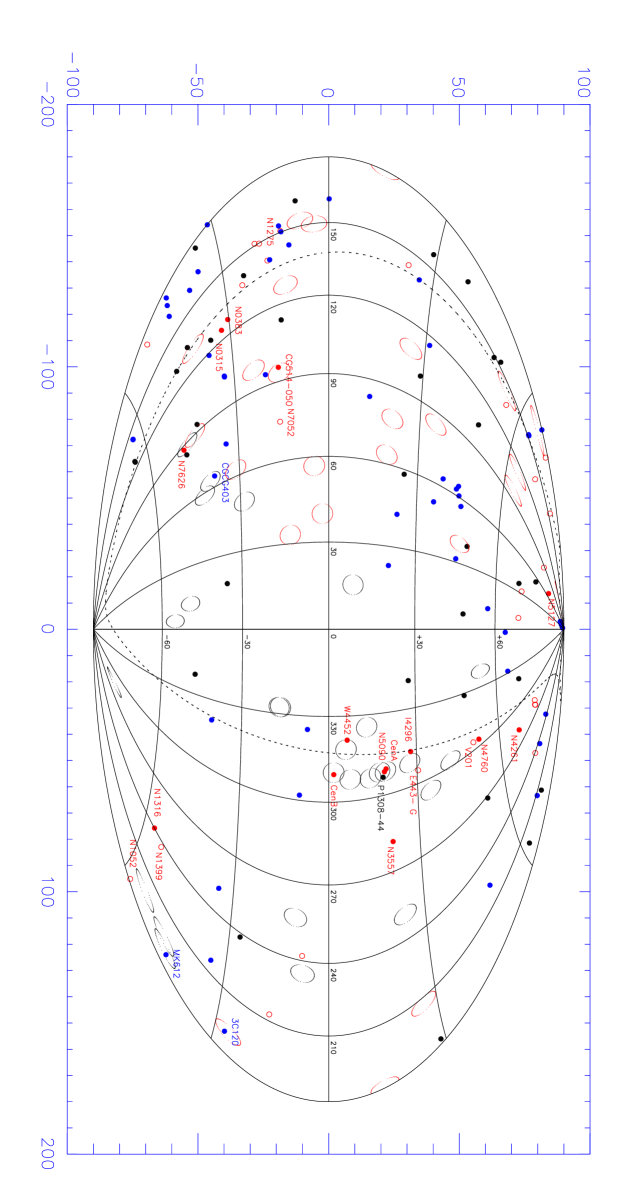
A comparison of the arrival directions of the 27 UHECRs and the positions of nearby galaxies with radio jets (all galaxies listed in Liu & Zhang, 2002) is shown in Fig. 1. We have divided the galaxies with radio jets into three redshift bins: “nearby” (D 75 Mpc), “intermediate” (75 Mpc D 150 Mpc), and “distant” (150 Mpc D 210 Mpc). In the closest redshift bin, D 75 Mpc, we distinguish between galaxies with radio structures more extended than 180 kpc (“extended”) and those with radio structures less extended than 180 kpc (“compact”). We calculated the total extent of the radio structure of any given galaxy by summing the lengths of the two radio jets and/or lobes as scalars instead of vectors. The total radio extent includes radio jets and any radio lobes.
There is no intrinsic reason to use a radius 3.5∘ for a “match” between UHECR arrival direction and the position of an astronomical source. The instrumental resolution of the PAO is about 1∘ at these UHECR energies, to which one must add a small angle – perhaps up to a few degrees (Stanev, 2004) – to account for the deflection of the UHECR by magnetic fields. The best correlation between UHECRs and nearby AGNs found by PA07, PA08 is based on considering 3.2∘as a match. However, as we show later (e.g. Fig. 7), the value of in the analysis of PA07,PA08 should really be 3.1∘–4.3∘. For the above reasons, we consider two values of for a match: 1.5∘ and 3.5∘. The distance limit for ‘nearby’ galaxies - 75 Mpc - is similar to the value d 71 Mpc found by PA07 and PA08. The division between ‘compact’ and ‘extended’ radio structures - 180 kpc - is the one ‘new’ free parameter in our analysis. We note that this value is close to the minimum linear size of the radio structures of a typical radio galaxy (e.j. Hardcastle et al., 1998).
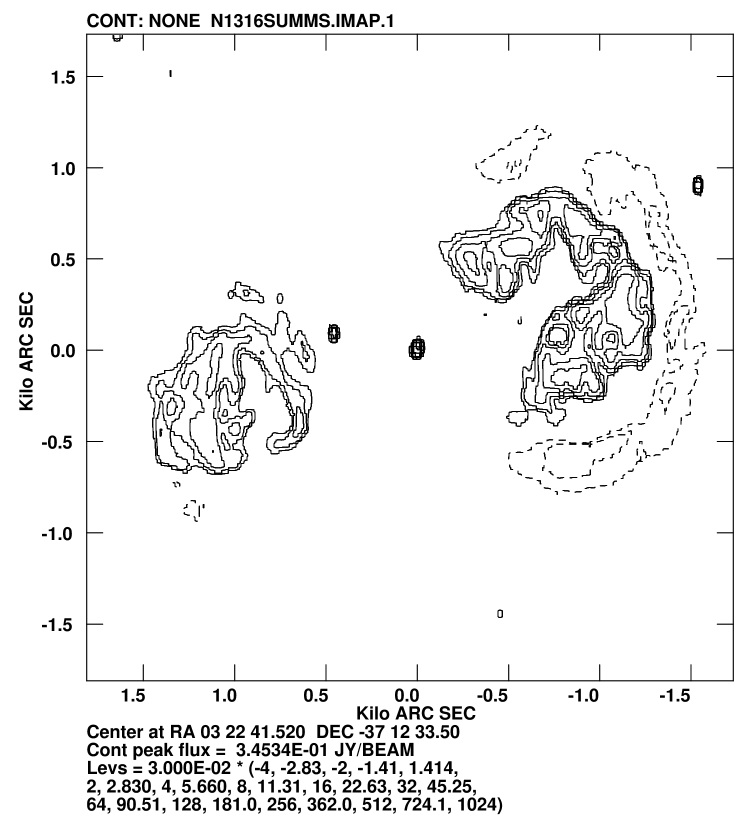
Of all 27 UHECRs with energy above 56 EeV detected by the PAO four (eight) are within 1.5∘ ( 3.5∘) of the radio structures of nearby extended radiogalaxies in the field of view of the PAO. Conversely, of all ten nearby extended radiogalaxies in the field ov view of the PAO three (six) have radio structures which can be matched to within 1.5∘ (3.5∘) of a UHECR event. Of the remaining four ‘unmatched’ radiogalaxies, three - NGC 1316, NGC 4261 and NGC 4760 - fall outside the area of maximum exposure at the PAO. For the intermediate and distant redshift bins there is little match between extragalactic radio jets and UHECRs; the only two matches within 3.5∘ are CGCG 403-019, a Seyfert/BL Lac at 112 Mpc, and Mrk 612, a Seyfert galaxy at 85 Mpc.
The match between a UHECR and CGCG 403-019 deserveres furter comment. CGCG 403-019 is a BL Lac with a Seyfert 1 spectrum (Veron-Cetty & Veron, 1993). In the 12th AGN Catalog of Véron-Cetty & Véron (2006) it is listed by its alias PKS 2201+04 and is classified as a Seyfert 1. It is a poweful radio source with a core-jet structure with total extent 6′ or 190 kpc (Ulvestad & Johnston, 1984; Laurent-Muehleisen et al., 1993). Within the unified scheme of radiogalaxies, BL Lacs are posited to be pole-on FR Is, implying a much larger deprojected radio extent. We therefore consider CGCG 403-019 as an ‘intermediate’ distance ‘extended’ radiogalaxy. Further, CGCG 403-019 is unique in being the nearest BL Lac with extended radio structure. The 12th AGN Catalog of Véron-Cetty & Véron (2006) includes only three confirmed BL Lacs - V Zw 331, RXS J05055+0416, and TEX 0554+534 - and only one probable BL Lac - RXS J21231-1036 - at D 150 Mpc. All four show compact radio emission in NVSS radio maps.
The Auger Collaboration noted that the region around Cen A has an unusually large number of UHECRs; this is also the area with the maximum number of nearby extended radiogalaxies. As seen in Fig. 2, the two UHECRs centered on Cen A can be explained as originating in either of Cen A, NGC 5090 (D=48 Mpc; total radio extent 187 kpc), or even PKS 1308-441 (D=211 Mpc; total radio extent 1140 kpc). The event just further south can be matched to the southern jet of Cen A, or to the relatively distant PKS 1308-441. Cen B (D=54 Mpc; total radio extent 250 kpc) is almost perfectly centered on a UHECR, and WKK 4552 (D=67 Mpc; total radio extent 360 kpc) is within 3∘ of another UHECR. The UHECR just to the north of Cen A is bracketed by IC 4296 (D=52 Mpc; total radio extent 1560 kpc) and ESO 443-G024 (D=71 Mpc; total radio extent 60 kpc). The very extended radio structure of the former actually intersects with the 3.5∘ circle around the UHECR event.
Are the nearby extended radiogalaxies matched to PAO UHECRs different from those not matched to PAO UHECRs? A comparison of the relevant properties of the ten nearest extended radiogalaxies is given in Table 1, and their radio contour maps in Fig. 3. Table 1 also lists the relevant radio properties of CGCG 403-019 and Mrk 0612, the two intermediate distance AGNs which match to a UHECR. There is some difference in the combination of two factors: the radiogalaxies in the direction to UHECRs include all of the subset which have radio jet morphologies closer to FR II, and are all in the area where the PAO has obtained a higher exposure time. In any case, given the small number statistics, i.e. typically 11 UHECR events per matched radiogalaxy, it is not surprising that UHECRs are not yet detected towards the remaining four radiogalaxies. Clearly more UHECRs are needed to form any firm conclusion.
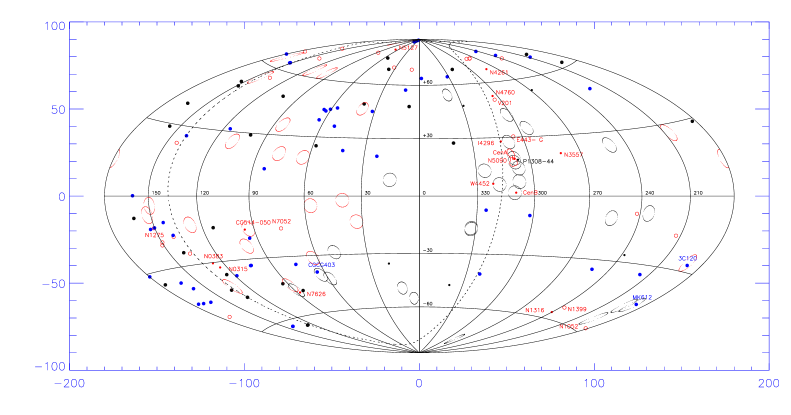
Fig. 4 compares the arrival directions of UHECRs with the distribution of nearby groups and clusters of galaxies. While there is an over-density of galaxies, clusters of galaxies and UHECRs around the region of Cen A, the overall distributions of nearby galaxies and nearby galaxy clusters do not correlate with the arrival directions of UHECRs. This argues against an origin of UHECRs in material associated with large mass haloes, e.g. Dark Matter. The more detailed analysis of Gorbunov et al. (2007) also predicts a different distribution of UHECRs when the distances to galaxies and clusters are taken into account.
We have also compared the arrival directions of the 27 UHECRs with the positions of Galactic and nearby extragalactic supernovae and supernova remnants, of nearby extragalactic radio supernovae, of nearby BL Lacs, and of gamma-ray bursts. In all cases there appears to be no more than a random overlap.
The analysis of PA07 and PA08 considered a single source population for the UHECRs. How would their results change if one were to consider multiple source populations, at least one of which is nearby extended radiogalaxies? Fig. 5 compares the histograms of the angular distribution of the 27 UHECRs with energies above 56 EeV, the subset of 19 UHECRs not towards nearby extended radiogalaxies, and the expectations from a random distribution of 27 UHECRs. The deviation from isotropy discussed by PA07 and PA08 (dashed line in the figure) comes primarily from the clustering of events around Cen A. Deleting the UHECRs which lie within 3.5∘ of nearby radiogalaxies (solid line in the figure) gives a distribution in which isotropy cannot be ruled out at high significance.
The Auger Collaboration cross correlated the positions of the 27 UHECRs with the AGNs in the 12th catalog of (Véron-Cetty & Véron, 2006) by varying the maximum AGN distance (zmax), the angular separation between AGN and UHECR to be considered a match (), and the threshold energy of UHECRs. They then looked for the minimum cumulative probability of chance coincidences. Note that they apparently included H II nuclei from the catalog in their analysis. In this process (see PA08 for details) they found that the best match was found for zmax = 0.017 (D 71 Mpc) and = 3.2∘. We repeated their cumulative probability scans in the parameters zmax and ; we were unable to scan in energy as we do not have access to the position and energy data on the UHECRs with energies less than 56 EeV. The resulting scans are shown in Fig. 6. The dashed line shows the result if all 27 UHECRs are used, i.e. the result obtained by PA08. In this case 19 of the 27 UHECRs match to some AGN or H II nuclei in the catalog. The middle solid line of each panel shows the result of considering only the 23 UHECRs remaining after deleting the four UHECRs which best match (within 1.5∘) the radio structures of nearby extended radiogalaxies (2 UHECRs for Cen A, and one each for Cen B and NGC 7626). In this case 13 of the 23 UHECRs match to some AGN or H II nuclei in the catalog. The upper solid lines show the results of considering only the 19 UHECRs remaining after deleting the four UHECRs mentioned above, plus the UHECRs matched within 3.5∘ to the South jet of Cen A, to CGCG 403-019, to WKK 4452, and to IC 4296. In this case 11 of the 19 UHECRs match to some AGN or H II nuclei in the catalog. While the overall shape of the scans in and zmax remain roughly the same, the significance of the results decrease significantly. In the case of the scan in , the minimum at around 3.2∘ is no longer a clear and unique minimum. We repeated the above exercise after making two modifications to the AGN list: we deleted all galaxies with H II type nuclei (50 galaxies at z 0.024) and the three probable high redshift QSOs which are listed as having z=0 in the AGN Catalog 12th. ed.. The results are shown in Fig. 7. The main difference with the previous figure is the broader valley in the scan. Instead of a clearly defined minimum at = 3.2∘one now has a greater range 3.2∘– 4.3∘.
4 Discussion & Concluding Remarks
The arrival directions a subset of the 27 UHECRs with energies above 56 EeV detected by the PAO are statistically most closely related to nearby radiogalaxies with extended radio jets and/or lobes. It is thus likely that nearby (due to the GZK effect) radiogalaxies with extended (radio extent 180 kpc), two sided jets and lobes are the source population of a subset of the UHECRs detected by the PAO. Additionally, there is weak evidence that hosting a jet with morphology closer to FR II makes a radiogalaxy more likely to be a UHECR source. Interestingly, all these factors are consistent with the lack of UHECR detections towards M 87.
The results of the previous section were based only on UHECRs detected by the PAO. We have also tested for correlations against the UHECRs with energy above 56 EeV detected by AGASA (red circles with radius 3.5∘ in Fig.1. Among the nearby (D 75 Mpc) galaxies with extended radio jets, the only clear match is to CGCG 514-050, a radiogalaxy at D=72.2 Mpc with radio extent 250 kpc. The remaining three nearby galaxies with extended radio galaxies, NGC 315, NGC 383, and NGC 5127, are not matched to within 3.5∘ of any AGASA UHECR event, though there are several UHECRs at slightly larger distances. Additionally, One AGASA UHECR is close to the location of NGC 7626 and another is centered on the radiogalaxy 3C 120, at D=135 Mpc and total radio extent 315 kpc.
Among the UHECRs detected by PAO, an isotropic distribution of the 20 UHECRs which are not in the line of sight to nearby extended radiogalaxies cannot be ruled out at high significance. The significance of the correlation found by PA07 and PA08 between UHECR arrival directions and nearby AGNs from the catalog of Véron-Cetty & Véron is much lower when one only considers the 20 UHECRs not matched to nearby extended radiogalaxies and even lower when H II nuclei in the the AGN Catalog are deleted. The findings of PA07,PA08 were probably largely influenced by the correlation between UHECRs and nearby radiogalaxies which we have shown above.
The UHECR arrival directions are not strongly correlated with either supernovae, extragalactic radio-supernovae, or nearby groups and clusters of galaxies.
The main difference between the results of the Pierre Auger Collaboration and those from previous studies of UHECRs, e.g. AGASA, could primarily be that the southern location of the PAO is more privileged with respect to nearby extended radiogalaxies.
Acknowledgements.
NN dedicates this work to his thesis advisor and collaborator Andrew S. Wilson. We acknowledge funding from ALMA 3105000 and 3016013, and the FONDAP Center for Astrophysics. This research has made use of the NASA/IPAC Extragalactic Database (NED) which is operated by the Jet Propulsion Laboratory, California Institute of Technology, under contract with the National Aeronautics and Space Administration.References
- Abraham et al. (2004) Abraham, J. et al. for the Pierre Auger Collaboration, 2004, Nucl. Instr. and Meth. A523, 50
- Pierre Auger Collaboration et al. (2007) Abraham, J. et al. for the Pierre Auger Collaboration, 2007, Sci, 318, 938 (PA07)
- Pierre Auger Collaboration et al. (2008) The Pierre AUGER Collaboration, et al. 2008, Astroparticle Physics, 29, 188 (PA08)
- Birkinshaw & Davies (1985) Birkinshaw, M., & Davies, R. L. 1985, ApJ, 291, 32
- Bock et al. (1999) Bock, D., Large, M. I., & Sadler, E. M. 1999, AJ, 117, 1578
- Condon et al. (1998) Condon, J. J., Cotton, W. D., Greisen, E. W., Yin, Q. F., Perley, R. A., Taylor, G. B., & Broderick, J. J. 1998, AJ, 115, 1693
- Fanaroff & Riley (1974) Fanaroff, B. L., & Riley, J. M. 1974, MNRAS, 167, 31P
- Greisen (1966) Greisen, K. 1966, Phy. Rev. Lett, 16, 748
- Gorbunov et al. (2007) Gorbunov, D., Tinyakov, P., Tkachev, I., & Troitsky, S. 2007, ArXiv e-prints, 711, arXiv:0711.4060
- Hardcastle et al. (1998) Hardcastle, M. J., Alexander, P., Pooley, G. G., & Riley, J. M. 1998, MNRAS, 296, 445
- Hayashida et al. (2000) Hayashida, N., et al. 2000, ArXiv Astrophysics e-prints, arXiv:astro-ph/0008102
- Hillas (1999) Hillas, A. M. 1999, Nuclear Physics B Proceedings Supplements, 75, 109
- Jones (1986) Jones, P. A. 1986, Proceedings of the Astronomical Society of Australia, 6, 329
- Jones & McAdam (1992) Jones, P. A., & McAdam, W. B. 1992, ApJS, 80, 137
- Jones et al. (2001) Jones, P. A., Lloyd, B. D., & McAdam, W. B. 2001, MNRAS, 325, 817
- Kachelriess (2008) Kachelreiss, M. 2008, lecture notes on high energy cosmic rays (astro-ph/0801.4376)
- Liu & Zhang (2002) Liu F.K., & Zhang Y.H. 2002, A&A, 381, 757
- Laurent-Muehleisen et al. (1993) Laurent-Muehleisen, S. A., Kollgaard, R. I., Moellenbrock, G. A., & Feigelson, E. D. 1993, AJ, 106, 875
- Lloyd & Jones (2002) Lloyd, B. D., & Jones, P. A. 2002, MNRAS, 331, 717
- Madore et al. (1992) Madore, B. F., Helou, G., Corwin, H. G., Jr., Schmitz, M., Wu, X., & Bennett, J. 1992, Astronomical Data Analysis Software and Systems I, 25, 47
- Mollerach et al. (2008) Mollerach, S., for the Pierre Auger Collaboration 2007, 30th International Cosmic Ray Conference, Merida, Mexico, July 2007, ArXiv e-prints, arXiv:0706.1749v1
- de Mello Neto et al. (2007) de Mello Neto, J. R. T., & for the Pierre Auger Collaboration 2007, ArXiv e-prints, 712, arXiv:0712.3727
- Nagar et al. (1999) Nagar, N. M., Wilson, A. S., Mulchaey, J. S., & Gallimore, J. F. 1999, ApJS, 120, 209
- Owen & Ledlow (1994) Owen, F. N., & Ledlow, M. J. 1994, The Physics of Active Galaxies, 54, 319
- Saikia et al. (1986) Saikia, D. J., Kulkarni, V. K., & Porcas, R. W. 1986, MNRAS, 219, 719
- Stanev (2004) Stanev, T. 2004, C. R. Physique 5, 453
- Takeda et al. (1999) Takeda, M., et al. 1999, ApJ, 522, 225
- Ulvestad & Johnston (1984) Ulvestad, J. S., & Johnston, K. J. 1984, AJ, 89, 189
- Véron-Cetty & Véron (2006) Véron-Cetty, M.-P., & Véron, P. 2006, A&A, 455, 773
- Veron-Cetty & Veron (1993) Veron-Cetty, M.-P., & Veron, P. 1993, A&AS, 100, 521
- Zatsepin & Kuzmin (1966) Zatsepin, G. T., & Kuzmin, V. A., Soviet Phys. JETP, 4, 78


![[Uncaptioned image]](/html/0806.3220/assets/x19.png)