Reentrant phase diagram and pH effects in cross-linked gelatin gels
Abstract
Experimental results have shown that the kinetics of bond formation in chemical crosslinking of gelatin solutions are strongly affected not only by gelatin and reactant concentrations but also by the solution pH. We present an extended numerical investigation of the phase diagram and of the kinetics of bond formation as a function of the pH, via Monte Carlo simulations of a lattice model for gelatin chains and reactant agent in solution. We find a reentrant phase diagram, namely gelation can be hindered either by loop formation at low reactant concentrations, or by saturation of chain active sites via formation of single bonds with a crosslinker at high reactant concentrations. The ratio of the characteristic times for the formation of the first and the second bond between the crosslinker and an active site of a chain is found to depend on the reactant reactivity, in good agreement with experimental data.
Gelatin gels have received great attention gelatin because of the interesting fundamental aspects of their rheological behavior and their numerous industrial applications. When a semi-diluted gelatin solution is cooled below room temperature, chains start to form triple helices and progressively a connected network is built. By adding crosslinker molecules to the gelatin solution above the temperature of the coil-helix transition, the thermoreversible gelation of helices can be avoided and a chemical gel network is formed, as chain aminoacids react with crosslinkers. This possibility of chemical gelation in gelatin solutions is extremely relevant for the numerous applications in pharmaceutical, photographic and biomedical industries. The physical gel is characterized by an extreme biodiversity due to chemical composition of the native collagen, molecular weight distribution, solution properties such as concentration or pH, which may affect the temperature of helix formation mad1 . In addition, the option of chemical gelation or a combination of chemical and physical gelation represent an extremely interesting way of enhancing the performance of these materials, in terms of structural and rheological features. As a consequence, an important issue for the development of technological applications is the understanding and the governance of the interplay of the different control parameters (gelatin concentration, crosslinker concentration, pH or temperature).
Recently, extended studies have been performed on gelatin in solution with bisvinylsulphonemethyl (BVSM) reactant mad3 , able to establish bifunctional covalent bonds with the lysine, the hydroxylysine and possibly with other amine groups of gelatin chains. The influence on bond formation of various parameters, i.e. the concentration of gelatin and reagent as well as the solution pH, was investigated. Microcalorimetry measurements were able to monitor the development of the chemical reaction in time by detecting the exothermic enthalpy change during the formation of bonds. The kinetics of cross-link formation was found to follow a double exponential decay with two characteristic times. However, when counting the number of cross-links binding BVSM and gelatin, the method could not discriminate between bonds established by free reactants with a chain, bonds leading to a bridge between two gelatin chains, or bonds leading to a loop within a chain. This lack of information on the kinetics clearly hindered the characterization of the structure and therefore the understanding of the mechanical properties of the gel, requiring an alternative approach to reach a deeper comprehension. A joint investigation, pursued by complementing the experimental study with suitably designed numerical simulations, allowed to shed some light on these unanswered questions.
By means of Monte Carlo simulations on the cubic lattice of a simple model we analyzed the kinetics of bond formation in chemical cross-linking of a gelatin solution noi . We considered a solution of polymer chains at different concentrations where reactant monomers can diffuse and form bonds with the active sites along the chains, producing the cross-linking. It was possible to follow the kinetics of the gel formation by varying the gelatin concentration, the cross-linker concentration and its bonding probability (i.e. reactivity). The numerical data were able to reproduce extremely well the experimental findings. The combined analysis showed that the two time scales detected in the experiments correspond to the average times for forming, respectively, single bonds reactant-chain and bridges chain-chain via cross-linkers. We related these two times to the characteristic times of diffusion of free reactants and reactants which have already formed one bond with a chain. Their ratio controls the kinetics of bond formation: varying the concentration, the cross-linker reactivity and the pH strongly affects this ratio and therefore the kinetics of the gelation process. We could also show that the reaction rate for a reactant to form a bridge between two active sites allows to finely tune the kinetics of gelation by affecting the ratio of the two characteristic times. This can be achieved in experiments, for instance, by changing the reactant agent in the gelatin solution.
Another crucial question put forward by the experimental study mad3 is the role of the pH. In particular, a qualitative change of the gelation kinetics was observed by changing the pH, which could not be explained, also due to the limited access to structural information in the experiments: The ratio of the two characteristic times experimentally appears to increase with the solution pH. In fact, a higher pH activates more amine groups able to react with BSVM along the gelatin chains. This can be mimicked in the simulation by varying the number of active sites along the chains. Preliminary data obtained in simulations noi showed some inconsistencies with the experimental observations for gelatin solutions with BSVM. Indeed, the possibility of detecting different regimes and varying meaningfully the number of active sites along the chains strongly relies on the use of long enough chains. In this paper we present therefore a new detailed numerical study of the kinetics of the bond formation as a function of the pH and of the concentration of gelatin and reactant. Here longer chains and larger system sizes are considered, with the specific aim of modeling solutions with different pH and exploring more extended regions of the phase diagram, with respect to the previous study. We are able to show that the gelation line exhibits a non-monotonic behavior, that is, for high reactant concentrations the system goes back into the sol phase for all pH values. This result is of course extremely relevant for applications and is indeed in agreement with experimental findings, where gelation is not observed even at relatively high cross-linker concentrations lei ; shi . We show that this feature is due to an enhanced probability of saturating all the active sites by a single bond with a different crosslinker. In specific conditions of high crosslinker concentrations, this can actually hinder gelation, resulting in a reentrant phase diagram. By systematically studying the dependence of the ratio of the two times on the gelatin concentration for different pH, we are able to reproduce and rationalize the experimental data. These indeed correspond to a range of cross-linker reactivity lower than the one investigated in the previous study. The present results lead to a coherent scenario for the gelation kinetics, which exhaustively complements the experimental study.
The paper is organized as follows: In section I the numerical model and the numerical simulations are described in detail. The results on the gelation phase diagram are discussed in section II, where also the number of loops and single bonds formed at the end of the reaction is analyzed, together with the size of the macromolecule. This last feature is not accessible experimentally and is clearly extremely relevant for the mechanical properties of the gel. In section III we study the kinetics via the ratio of the two characteristic times as a function of gelatin and reactant concentrations, as well as of the solution pH and reactant reactivity. Concluding remarks are given in section IV.
I Model and numerical study
We perform Monte Carlo simulations on a cubic lattice of a system made of bi-functional monomers. Each monomer represents a unit on the chain or else a reactant. The chains are formed by a sequence of linked monomers. One monomer of the chain models a Kuhn segment Doi , and therefore represents more units. The length of a Kuhn segment in a gelatin chain has been measured Kuhn to be of the order of Å, corresponding to about amino-acids. As compared to the experiments, our chains correspond to shorter gelatin chains, containing only about amino-acids. Each monomer occupies simultaneously the eight sites of the lattice elementary cell and, to take into account excluded volume interactions, two occupied cells cannot have any site in common. A fixed number of monomers along the chain are active sites which may bind to the reactant in order to form complex clusters of chains leading to the formation of a gel. The active sites are tetra-functional: Two bonds are formed with the neighbors along the chain and two are not saturated at the beginning of the simulation. The number of active sites per chain, , corresponds to a fixed pH of the solution. Although the number of amine groups in a gelatin chain actually linked to reactant cannot be measured experimentally, it is estimated that at most a fraction of can react. Therefore we perform simulations for varying from 5 to 11, which corresponds to a fraction of about to active amino-acids in our chain.
Chains are randomly distributed on the lattice and diffuse via random local movements using the bond-fluctuation dynamics BFD ; noi . After equilibration, we add the reactant to the system and let the solution diffuse towards the stationary state. Due to the diffusion of cross-linkers and chains, when a free reactant finds a nearest neighbor unsaturated active site, the first bond forms along lattice directions. The second bond is instead formed with probability , since its formation might require to overcome a free energy barrier noi ; malla , depending on the nature of the solution, the active sites and the reactant. In particular, in these systems the rigidity of the link may significantly limit the angle between two bonds or the effective chemical reactivity of the cross-linker may undergo meaningful variation once the first bond is formed. The process goes on until all the possible bonds are formed.
We perform numerical simulations of the model for lattice size , where the unit length is the lattice spacing , with periodic boundary conditions. The chain concentration and the cross-linker concentration are defined as the ratio between the number of present monomers and the maximum number of monomers in the system. Using the percolation approach we identify the gel phase as the state in which there is a percolating cluster Flory_perco . For a fixed set of parameters we generate a number of configurations of the system and monitor the reaction. In order to locate the gelation transition we analyze the percolation probability , defined as the fraction of configurations leading to a percolating cluster, and we identify the transition with the line stauffer .
We investigate the behavior of the number of bonds formed during the
reaction process and we classify the bonds in three
categories:
1. Bonds between a free reactant and an
active site (we will refer to this type of bond as
single-bonds);
2. Bonds between a linked reactant and an active site
of another chain (bridges);
3. Bonds between a reactant and two active sites of the same chain
(which in the following we will call loops).
We analyze the kinetics of bond formation varying the chain
concentration , the cross-linker concentration , the
probability of second bond formation and the number of active
sites . The time is measured in Monte Carlo unit time, i.e.
the attempt to move all monomers once. The number of bonds is
normalized by the maximum number of bonds that can be formed
depending on the limiting agent of the simulation: The normalization
factor is the minimum value between twice the number of reactant
monomers and twice the number of active sites in the system.
II Phase diagram and loops
We first determine a qualitative phase diagram by varying the chain and cross-linker concentrations, and respectively, for , which correspond to different values of the pH. The results are shown in Fig.1.
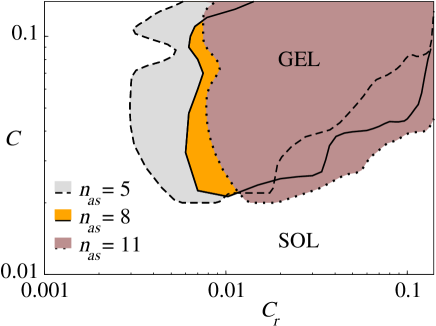
Following the standard site-bond percolation picture stauad , one expects that the gel phase is obtained provided that enough crosslinkers are added. However, it has been observed in experiments that this is not always the case, and that this feature is affected by the value of the pH. Fig.1 shows that for all values of gelation can be obtained in a limited range of . Indeed, the figure clearly indicates that, at a given gelatin concentration , increasing beyond a certain value corresponds to a strong decrease of percolation probability and hinders the presence of a gel at the end of the reaction. Of course this reentrant phase diagram is the product of the balance among gelatin concentration, crosslinker concentration and number of active sites per chain. Our reentrant phase diagram is in agreement with experimental findings for polymer aqueous solutions lei ; shi , where gelation can be inhibited by different mechanisms, namely polyelectrolyte effects due to the complexation process.
If the number of active sites per chain increases, , i.e. the pH increases, the gel phase moves towards regions with higher concentration of cross-linkers. This suggests that in all cases, for sufficiently high , the system goes back into the sol phase.
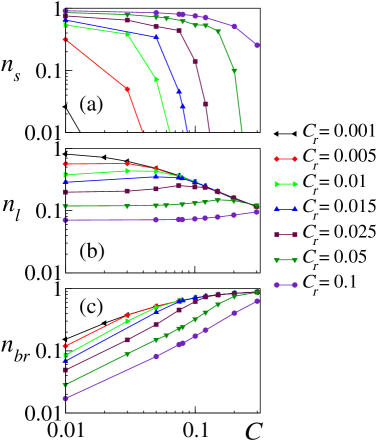
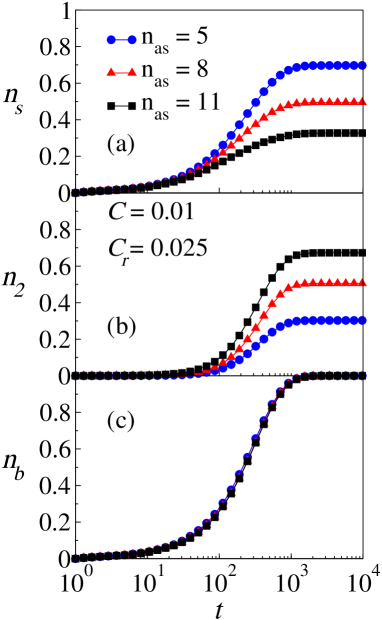
To better understand these results, we measure the number of unsaturated reactants, the number of loops and bridges at the end of the reaction. Such information, not accessible experimentally, is extremely relevant to the mechanical properties of the gel. In Fig.2 we plot the normalized number of single bonds , corresponding to the number of unsaturated reactants, the normalized number of loops and the normalized number of bridges (defined at the end of section I), as a function of the chain concentration for different values of .
We can detect three different regimes: i) At low , when the system is in the sol phase, the majority of bonds are loops at low and bridges at high ; ii) in the intermediate regime the number of loops decreases in favor of bridges leading to gelation; iii) at high the majority of bonds are single bonds crosslinker-chain, which brings the system back into the sol phase.
As a small remark, we notice that at very low , corresponding to the sol phase, decreases with over the whole observed range following a power-law decay , in agreement with previous results noi . For increasing , the same power law decay is recovered at higher . The analysis of in systems with different pH indicates that a higher fraction of loops is measured at a higher pH, as expected.
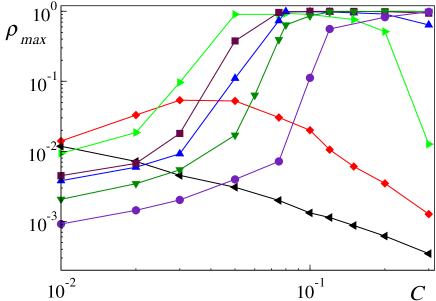
We also measure the fraction of monomers belonging to the largest cluster, , where is the total number of monomers in the system. Here is evaluated by counting monomers, either in a chain or reactants. In Fig.3 is plotted as a function of . Except for the very small , corresponding to the sol phase, the fraction of monomers belonging to the largest cluster increases toward unity for increasing , as the system moves into the gel phase. For higher , exhibits the tendency to decrease, as the system goes back into the sol phase.
Discussion: Depending on specific conditions, the
complex balance between , and , results in
enhancing the probability of forming either loops or single bonds
reactant-chain. For all pH values and low gelation is not
observed as reactants mostly form loops within the same chain.
Conversely, gelation is hindered at high since reactants
saturate all the active sites of the chains, not leading to the
formation of a macromolecule. Indeed this effect is observed at
higher for higher , since, at higher pH, more
reactants are needed to saturate all active sites. Therefore, beyond
a certain value of , adding reactants to the solution is
useless, as a higher concentration of chains is needed for gelation.
In the following section we investigate how the complex scenario
above described is connected to the gelation kinetics.
III Kinetics of bond formation
In experiments the pH of the solution is found to strongly influence not only the final state of the system, i.e. the phase diagram, but also the kinetics of bond formation.
In order to investigate this phenomenon, during the reaction we monitor the total number of bonds formed , the number of single-bonds (bonds of type 1) and the number of bonds forming bridges or loops (i.e. bonds of type 2 and 3), with obviously . The number of bonds is normalized by the total number of possible bonds.
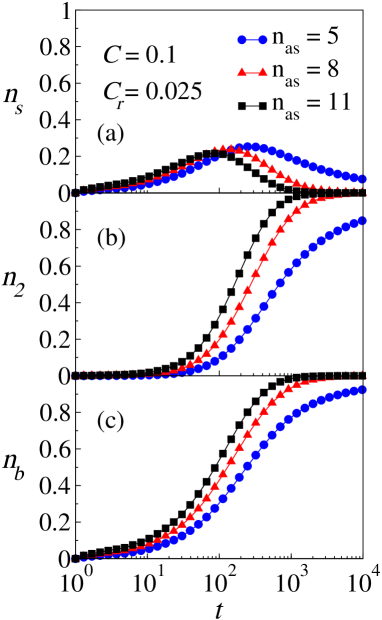
In Fig.4 , and are plotted as a function of time in the case for for and , corresponding to the gel phase at the end of reaction. As the reaction begins, single-bonds form rapidly, then second bonds start to form and the degree of connectivity between chains increases: single-bonds decrease in time as the number of bridges increases. Our data indicate that as increases, second bonds form faster, whereas the characteristic time of single-bond formation is less affected by pH. As a consequence, we expect that the ratio of the two times decreases with pH. A significantly different behavior is observed in the sol phase (Fig.5): in this case the characteristic time for the first and the second bond formation are the same for all pH values. Indeed, in this regime the whole kinetics of bond formation is independent of the solution pH (see Fig.5c). Hence, for , the time ratio is expected to be almost constant by varying the pH.
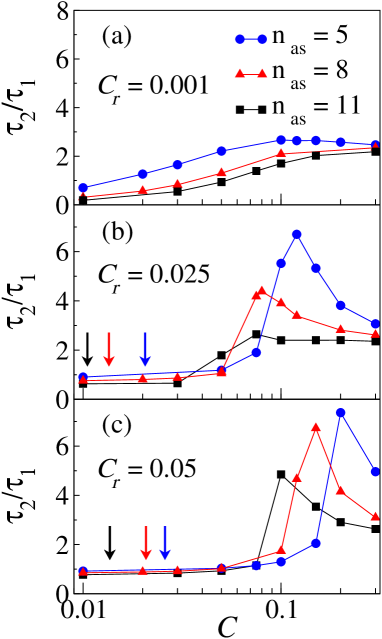
We now focus on the ratio between the characteristic times of single bond formation and of second bond formation and we study its dependence as a function of the number of active sites per chain . In Fig.6 we distinguish different regimes, according to the concentration of chains and cross-linkers. For low (Fig.6(a)) all systems are in the sol phase due to the very high number of loops (Fig.2) and therefore the time ratio is close to one. As the number of active sites per chain increases, remains quite constant whereas decreases, so that slightly decreases as increases. For intermediate cross-linker concentrations (Fig.6(b)) and low chain concentrations (sol phase), neither nor strongly vary increasing , consequently the ratio is almost independent of and weakly decreases increasing . For higher chain concentrations, beyond the gelation threshold (indicated by an arrow in the figure), the time ratio starts to increase, due to the slower decrease of with respect to , caused by the presence of the macromolecule. The smaller the number of active sites per chain, the later the increase of is observed with the chain concentration, in agreement with the displacement of the gel line in the phase diagram of Fig.1. Moreover, for smaller number of active sites the height of the peak decreases, suggesting that decreases faster than . For high (Fig.6(c)) the position of the maximum time ratio appears to move toward higher chain concentrations, due to the shifting of the gelation transition.
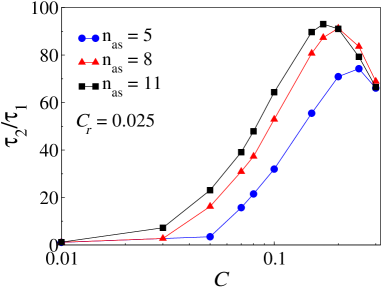
We conclude our study by investigating the interplay between the cross-linker reactivity and the pH. A first important hint of the possible combined effects is obtained by comparing the data of Fig.6(b), discussed above and corresponding to , to the behavior of as a function of measured for the same but for a lower reactivity reactant, (Fig.7). In this case the time ratio is about one order of magnitude larger than for high reactivity crosslinkers (Fig.6). Moreover, the dependence of on the number of active sites seems to be less strong and qualitatively different. In fact, in contrast to what observed in Fig.6(b), here in the gel phase increases with increasing , since decreases whereas is very large for all due to the very small .
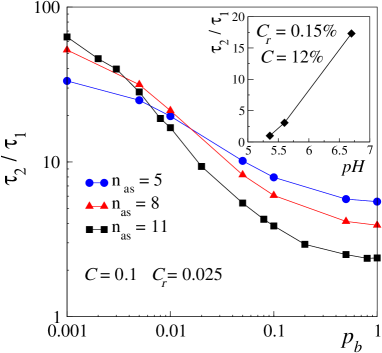
In general, if the probability of forming the second bond varies, the mean time of second bond formation changes, and so does the velocity of the reaction. In Fig.8 we plot the ratio as a function of for different values of . It is worth to notice that the average is constant along each line, since only affects . If the bond probability is very low () an increase of will correspond to an increase of , in agreement with Fig.7. In this case the ratio is controlled by , which decreases as the number of active sites increases. Conversely, if is sufficiently high () we observe the opposite behavior (see Fig.6(b)). In this case, the ratio is controlled by : As the number of active sites per chain increases, the mean time to form a second bond decreases more rapidly, affecting the ratio .
Discussion: Our data indicate that when the system at the end of reaction is in the sol phase, the ratio between the characteristic times does not substantially vary with the pH. Conversely, in the gel phase the kinetics of bond formation is strongly influenced by the , i.e. by the pH. Since the time ratio is actually measurable from the experiments noi , our observation suggests a new alternative way to discriminate the sol from the gel phase resulting from crosslinking the gelatin solution in specific conditions of and , purely based on the reaction kinetics.
It is worth to remark that the presence of loops, in general, corresponds to smaller values of , whereas the formation of bridges leads to larger values, as follows from the microscopic interpretation of and noi . At high the effect of the pH in very dense systems becomes less important. Indeed, at high both and decrease as increases, so that the ratio tends towards a value which is independent of the number of active sites per chain. This analysis allows to identify the range of parameters and for which the reaction kinetics is more sensitive to pH changes. This is certainly an important information for the experimental characterization of these systems. Moreover, it also suggests possible new applications in terms of pH-responsive systems.
Furthermore, for low reactivity cross-linkers the kinetics of the reaction is mainly controlled by the characteristic time for forming the first bond, and therefore the time ratio increases with the pH. For high reactivity cross-linkers, conversely, the combined effect of the pH and of the reactivity makes decrease faster than and therefore a decrease of the ratio will be observed when increases (i.e. for higher pH). By measuring the dependence of the time ratio on the pH, it is then possible to infer the level of reactivity of the reactant. For instance, experimental data for gelatin solutions with BVSM reactant mad3 show that, at fixed and , the time ratio increases with the pH (Inset Fig.8). According to our analysis this would suggest that BSVM is a low reactivity cross-linker, namely that the number of amine groups and reactant configurations leading to a chemical bond is small. Interestingly enough, this finding does complete an independent previous analysis noi , which suggested that the peculiar two-time kinetics observed in these systems should correspond to a low value of the crosslinker reactivity .
IV Conclusions
In conclusion, we have performed a comprehensive study of the pH dependence of the phase diagram and the reaction kinetics in crosslinking gelatin solutions. This study is based on numerical simulations of a lattice model specifically developed for these systems. The results allow to rationalize the experimental findings and give new relevant insights. The first important result of our study is that the increase of the cross-linker concentration does not necessarily imply the presence of a gel at the end of reaction: indeed it may also hinder the gelation transition, inducing the formation of a high number of single bonds or loops. This effect moves towards higher concentrations if the pH of the solution increases. As a consequence, we observe a reentrant phase diagram.
Our study points out that also the kinetics of bond formation is strongly influenced by the pH of the solution, with different regimes according to the concentrations of chains and cross-linkers. We find a remarkable qualitative difference in the pH dependence of the reaction kinetics, which could be used as a new purely kinetic criterion to discriminate between the sol and the gel final state of the crosslinking process. Thanks to a detailed analysis of reaction kinetics in terms of single bonds, loops within chains and bridges between different gelatin chains, we are able to give a meaningful explanation of the different regimes observed. Most interestingly, our results show that there exist ranges of the control parameters and for which the behavior of the system may be extremely sensitive to pH changes. These findings are fundamentally important for the experimental studies and suggest new possible applications of these materials.
Finally, we have been able to clarify how the influence of the pH on the kinetics of bond formation also depends on the reactivity of cross-linker considered, i.e., on the bond probability . For low reactivity cross-linkers the kinetics of the reaction is mainly controlled by the single-bond formation time, which decreases with pH, leading to an increase in the time ratio. Conversely, for high reactivity cross-linkers and for high chain concentration, the increase of pH induces a definite decreases in the time ratio.
References
- (1) M. Djabourov, J. Leblond, P. Papon, J. Phys. (Paris) 49 333 (1988); G. C. Fadda, D. Lairez, J. Pelta, Phys. Rev. E 63 061405 (2001)
- (2) C. Joly-Duhamel, D. Hellio, M. Djabourov, Langmuir 18, 7208 (2002); C. Joly-Duhamel, D. Hellio, A. Adjari, M. Djabourov, Langmuir 18, 7158 (2002)
- (3) D. Hellio-Serughetti, M. Djabourov, Langmuir 22, 8516 (2006).
- (4) T. Abete, E. Del Gado, D. Hellio Serughetti, L. de Arcangelis, M. Djabourov, A. Coniglio, J. Chem. Phys. 125, 174903 (2006).
- (5) L.Leibler, E. Pezron, P.A. Pincus, Polymer 29, 1105 (1988).
- (6) M. Tsujimoto, M. Shibayama, Macromoleculs 35, 1342 (2002).
- (7) M. Doi, S. F. Edwards, The Theory of Polymer Dynamics, Clarendon Press, Oxford (1988)
- (8) I. Pezron, M. Djabourov, J. Leblond, Polymer 32, 3201 (1991).
- (9) I. Carmesin, K. Kremer, Macromolecules 21, 2819 (1988); H.P. Deutsch, K. Binder, J. Chem. Phys. 94, 2294 (1991)
- (10) F. Mallamace, S.H. Chen, A. Coniglio, L. de Arcangelis, E. Del Gado and A. Fierro, Physical Review E 73, 020402, (2006).
- (11) P. J. Flory, The Physics of Polymer Chemistry, Cornell University Press (1954); P. G. de Gennes, Scaling Concepts in Polymer Physics, Cornell University Press (1993)
- (12) D. Stauffer, A. Aharony, Introduction to Percolation Theory, Taylor & Francis (1992).
- (13) D. Stauffer, A. Coniglio and M. Adam, Adv.in Polymer Sci. 44, 103 (1982)