Precursors in Swift Gamma Ray Bursts with redshift
Abstract
We study a sample of Gamma–Ray Bursts detected by the Swift satellite with known redshift which show a precursor in the Swift–BAT light curve. We analyze the spectra of the precursors and compare them with the time integrated spectra of the prompt emission. We find neither a correlation between the two slopes nor a tendency for the precursors spectra to be systematically harder or softer than the prompt ones. The energetics of the precursors are large: on average, they are just a factor of a few less energetic (in the source rest frame energy range 15–150 keV) than the entire bursts. These properties do not depend upon the quiescent time between the end of the precursor and the start of the main event. These results suggest that what has been called a “precursor” is not a phenomenon distinct from the main event, but is tightly connected with it, even if, in some case, the quiescent time intervals can be longer than 100 seconds.
1 Introduction
What happens in a Gamma–Ray Burst (GRB) before the main –ray prompt event is still an open question. Koshut et al. (1995, hereafter K95) searched in the BATSE sample for precursors defined as pulses with a peak intensity lower than that of the main GRB and separated from it by a quiescent phase at least as long as the main burst duration. They found that a precursor was present in % of the 995 GRBs detected up to May 1994: their duration appeared weakly correlated with those of the main GRBs and on average shorter than that of the burst. The spectral properties of the precursors (based on hardness ratios) showed no relation with those of the GRB, being both softer and harder.
Lazzati (2005; L05 hereafter) searched for precursors as weak events preceding the BATSE trigger. He found them in 20% of the bursts. These precursors account for only a small fraction of the total GRB counts, and their duration show a weak correlation with that of the burst. In contrast to those of K95, the precursors studied by L05 are softer than the main events.
K95 also found that the typical precursor–to–burst separation time is 100 s, whereas L05 showed that most precursors were closer to the onset of the main event (with 30 s). These timescales are computed in the observer frame since we do not know the redshift for most of the BATSE bursts. This difference could be due to the different definition of precursor–to–burst separation adopted (peak–to–peak separation and interval between the onset times for K95 and L05, respectively). Both analysis revealed, however, that the minimum separation is of the order of 10 s.
The main limitations of the above studies were: i) the lack of known distances, that prevented to quantify the absolute energy of the precursor event; ii) the poor spectral characterization of the precursor, that was based on low resolution spectra: typically the spectrum was described by either the hardness ratio (K95) or by a fit to a 3–4 channel broad band spectrum (L05).
Theoretical models for precursors can be separated into three classes: the “fireball precursor” (Li 2007; Lyutikov & Blandford, 2003; Meszaros & Rees, 2000; Daigne & Mochkovitch, 2002; Ruffini et al. 2001); the “progenitor precursor” models (Ramirez–Ruiz, MacFadyen & Lazzati, 2002; Lazzati & Begelman 2005) and the “two step engine” model (Wang & Meszaros 2007). In the first class the precursor is associated to the initially trapped fireball radiation being released when transparency is reached. In the second class, based on the collapsar scenario, the precursor is identified with the interaction of a weakly relativistic jet with the stellar envelope. A strong terminal shock, breaking out of the envelope, is expected to produce transient emission. In both classes of models the precursors emission is predicted to be thermal, characterized by a black–body spectrum. In the third class the collapse of the progenitor star leads to the formation of a neutron star whose emission would be responsible for the precursor; subsequent accretion onto the neutron star causes its collapse onto a black hole, originating the GRB prompt.
Since the launch of the Swift satellite (Gehrels et al. 2004), redshifts have been measured for a considerable number of GRBs. It is thus possible to investigate the rest frame properties and calculate the energetics of any precursor associated with them. These of course are key physical quantities for the understanding of their origin.
A major issue however is the very definition of “precursor”, as there is no obvious objective criterion. For this reason we have considered a “loose” operative definition for their “selection”, allowing ourselves to sub–select, a–posteriori, those events sharing some characterizing property. Thus, in our operative approach, a precursor is defined simply as an initial signal for which:
-
•
the peak flux is smaller than that of the main event in the Swift–BAT 15–350 keV light curve;
-
•
the flux falls below the background level before the start of the main event.
Our definition is quite similar to that adopted by K95 although we do not require the precursor to precede the bursts by a time delay at least as long as the main burst duration and, differently from L05, we do not impose the condition that a precursor did not trigger the detector. Indeed, such a definition might comprise initial pulses with very short time separation from the start of the main event, making them effectively undistinguishable from first pulses of the burst prompt emission. But how long should the temporal separation be to let us distinguish among the two? Or are there, instead, other (e.g. spectral) properties which can neatly distinguish precursors from main events, independently of the time separation? And are they really physically different? These are some of the issues we are trying to investigate.
We adopt a CDM cosmology with and .
2 Already known precursors with redshift
In the literature, there are 5 bursts with precursors and known redshift. GRB 011121 (Piro et al. 2005) and GRB 030329 (Vanderspek et al. 2004) show two possible precursors each, preceding the burst trigger by a few sec. However, these two GRBs do not match our selection criteria as the precursor candidates occur during the rising of the main event. GRB 050820A (Cenko et al. 2006), GRB 060124 (Romano et al. 2006) and GRB 061121 (Page et al. 2007) have precursors which triggered Swift–BAT and preceded the main events by several tens of sec. Although Swift–BAT could not completely follow the main events of GRB 060124 and GRB 050820A, due to the limited burst–mode memory buffer and to the passage over the South Atlantic Anomaly respectively, the Konus-Wind data complete the light curve allowing to study the main event. In Table 1 their main temporal and spectral properties and energetics are reported.
3 Precursors in the Swift sample
We have searched for precursor activity in all GRBs with measured redshift detected by Swift up to March 2008, comprising 105 GRBs. By applying our definition criteria, we found 15 GRBs with a precursor, including the three GRBs (061121, 060124 and 050820A) already discussed in the literature. All of them are long GRBs, i.e. s. Since GRB 070306 has two precursors, this implies a total of 16 precursors in the Swift sample. We have applied the standard Swift–BAT data reduction pipeline (v.2.8) to extract light curves and spectra for the GRBs in our sample. We computed the precursor and main GRB duration from the background subtracted 15–350 keV light curves binned at 1 s. The precursor and main GRB spectra were obtained with the standard procedure, taking into account the energy dependent systematic errors. The spectral analysis was performed with Xspec v11.3.2. The spectra were fit with a single (PL) and a cutoff (CPL) power–law model. For the precursors the PL model provides the best fit, i.e. the fit with the CPL model does not statistically improve (at the 3 confidence level).
Since, in some theoretical model, the precursor emission is expected to have a thermal origin, we also fit their spectra with a black–body (BB). For the 9 precursors with the largest ( 12) signal–to–noise ratio S/N (integrated over 15–150 keV), the BB representation is excluded at more than 3 in 6 cases and between 2 and 3 in 3 cases. In GRB 060115 and GRB 071010B (S/N10) the residuals of the BB fit show systematic deviations at low and high energies. For these two precursors, an hybrid BB+PL model (Ryde 2005, but see Ghirlanda et al. 2007) yielded a BB component contributing 50% of the total flux, but this model was only 1 significantly better than the single PL model. For the remaining 5 precursors the low S/N (10) does not allow to discriminate between the BB, PL, or other models with the same number of free parameters.
4 Results
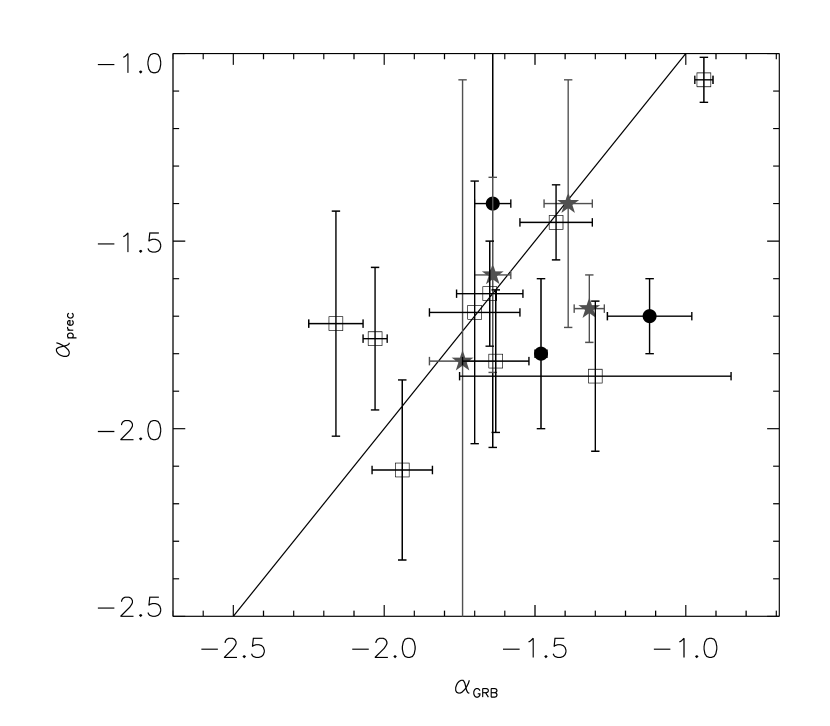
In Fig. 1 (left panel) the photon spectral indices of precursor () and main GRB () are compared. There is no clear tendency for the precursor emission to be harder or softer than the prompt. The typical photon index distributions of precursors and main events are both fully consistent with that for the whole Swift sample recently published (Sakamoto et al. 2008).
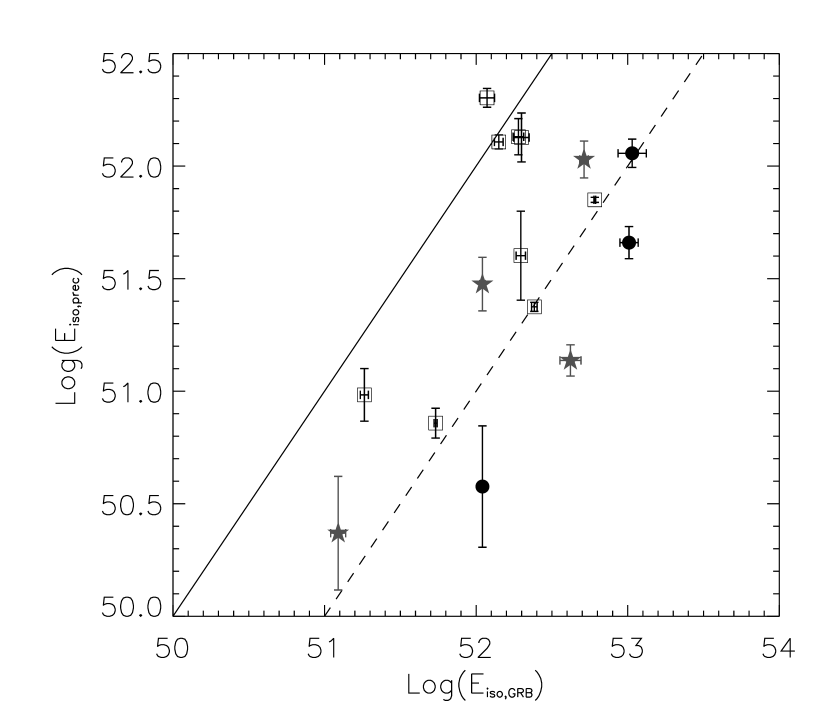
As all of the precursor spectra are best fitted by a single power–law, it is not possible to determine either the peak energy in or the bolometric energy . As the best possible proxy for the latter, we consider the energy emitted, in the rest frame, between 15 and 150 keV. As shown in Fig. 1 (right panel) the precursor isotropic energy is on average 1/3 of that of the corresponding main GRB event.
In order to examine the possible role of the duration of the quiescent time, i.e. the time delay between the end of the precursor and the start of the main event, we have divided the sample into three subsets, according to calculated in the source rest frame [], and are reported in Tab. 1). is broadly distributed between a few sec and a few tens of sec with an average value 10 s. By comparing the behavior of the precursors belonging to the three subgroups we can check whether our sample is “contaminated” by initial “pulses” that possibly have properties and origin different from those of “true” precursors. Both panels of Fig. 1 – where the events are coded according to (i.e. s, 15 s s and s) – show that there is no clear separation among them. In terms of energetics, a K–S test on the distributions of for Swift GRBs with redshift (adapted from Sakamoto et al. 2008) with and without precursors indicates that they are consistent with being drawn from the same distribution (null hypothesis probability =3%). As expected the corresponding distribution for the precursors is shifted towards lower .
Finally, an analysis of the rest frame pulse durations supports the finding by L05, namely the existence of a tentative (1 significant) correlation between the of precursors and the of main events.
5 Conclusions
Our results point to a clear but puzzling conclusion: the spectra and energetics of the selected initial pulses, being them bona fide precursors or not, are indistinguishable from those of the main event. While this could be not surprising for “precursors” which were in fact the initial pulse of the main event, in cases like GRB 060124 and GRB 050820A the precursor precedes the main event by 100 s (rest frame time): yet they behave as the rest of the main emission, like “normal” initial pulses.
This forces us to re–consider what the very same precursor phenomenon is. Our finding contrasts with that by L05, who found precursors much fainter and significantly softer than the main event. However the precursor selection criteria are different and in particular the requirement by L05 that the precursors did not trigger BATSE obviously biased the sample against strong precursors. Our result are instead more consistent with the Koshut et al. (1995) one, whose selection criteria is similar to ours. We therefore cannot exclude that there are two kinds of “precursors”: one as strong as and spectrally similar to the main event and the other being softer and dimmer. But – independent of that – both can occur 100 s before the main event. Indeed, this long delay is both the most intriguing feature and the main difficulty for all the proposed progenitor interpretation. As discussed by Wang & Meszaros (2007), the progenitor class of models cannot explain delays longer than 10 s.
The origin of quiescent times has been discussed by Ramirez–Ruiz, Merloni & Rees (2001), who considered the possibility that a temporal modulation in Lorentz factor of ejected shells/relativistic outflow would lead to time dependent emission via dissipation in internal shocks. “Fireball” models predict too short quiescent timescales if the main prompt emission mechanism is internal shocks taking place at typical radii cm, since s. External shocks occurring at cm can lead to time delays similar to what observed, but – in the case of a homogeneous fireball interacting with an homogeneous interstellar medium (ISM) – this process hardly accounts for fast prompt variability, suppressed by the curvature effect. More complex external shock scenarios can overcome this problem (e.g. Dermer et al. 1999), but in turn require a strongly clumped ISM.
A second issue emerging from our results concerns the spectral shape of the precursor. The non–thermal appearance of the spectra is not the chief problem, as this may arise as convolution of black-body emission at different temperatures and/or from different locations, consistently with the predicted thermal character. What remains puzzling (or revealing) is that, on average, the power–law fit spectral indices are very similar to those of the main event. The large energetics of the precursors studied here is also difficult to explain within the precursor models proposed so far as, whatever the progenitor nature, they rival the main event energetics.
In the collapsar model, the precursor photons may be produced in a region emerged from the progenitor star. Indeed, heated cocoon material has been proposed as responsible for the precursor (Ramirez-Ruiz, McFadyen & Lazzati 2002), but the expected energetics would be low compared to our findings. This also applies to the scenario proposed by Lazzati & Begelman (2005), where the jet opening angle increases in time, so an observer off axis could detect the prompt emission after the precursor, when the jet angle becomes equal to the viewing angle. The “two steps” engine model (Wang & Meszaros 2007) envisages that the precursor is associated with the cooling phase of the proto–neutron star and the delay time should correspond to the accretion phase which ultimately leads to the collapse of the neutron star to a black hole, when the “normal” GRB activity begins.
An alternative possibility is that precursors do not represent any distinct physical process, but are simply a manifestation of the same phenomenon producing the prompt emission, which sometimes does give raise to quiescent intervals between emission peaks. We can put an upper limit on the energy emitted during these quiescent times considering that the BAT sensitivity for a 5 detection is erg cm-2 s-1 (Markwardt et al. 2007), where is the exposure time. Using the delay times reported in Tab. 1 we estimate the mean value of the 1 upper limit to the energy emitted during the quiescence. The ratio of these limits to the precursors energy ranges from 0.012 for GRB 061007 to 0.25 for GRB 060124, with an average of 0.14.
Finally, we applied the same selection criterion, adopted for precursors, to search for emission episodes (“postcursors”) following the main bursts and separated by a quiescent phase. Within the 15 GRBs with precursors, GRB 060210 and GRB 0508020A show two and three pulses after the main burst111We recall that for GRB 050820A, Swift entered the SAA during the main event and therefore we could not perform the spectral analysis of the BAT data.. For GRB 060210 the two postcursors (separated by 60 and 150 s from the end of the main burst) have spectral indices and and energetics erg and erg, respectively. The spectra are softer and the energetics smaller than the main event and the precursor. Since this is the only burst, in our sample, having both a precursor and a postcursor, we cannot draw any strong conclusion. We plan to study spectra and energetics of postcursors by relaxing the condition of having also a precursor in a forthcoming paper.
References
- (1) Cenko S.B., et al., 2006, ApJ, 652, 490
- (2) Daigne F., Mochkovitch R., 2002, MNRAS, 336, 1271
- (3) Dermer C., Böttcher M. & Chiang J., 1999, ApJ, 515, L49
- (4) Gehrels N., et al., 2004, ApJ, 611, 1005
- (5) Ghirlanda G., Bosnjak Z., Ghisellini G., Tavecchio F. & Firmani C., 2007, MNRAS, 379, 73
- (6) Ghirlanda G., Nava L., Ghisellini, G., Firmani C. & Cabrera J.I., 2008, MNRAS, in press (arXiv:0804.1675)
- (7) Koshut T., et al., 1995, ApJ, 452, 145 (K95)
- (8) Lazzati D., 2005, MNRAS, 357, 722 (L05)
- (9) Lazzati D. & Begelman M.C., 2005, ApJ, 629, 903
- (10) Li L.–X., 2007, MNRAS, 380, 621
- (11) Lyutikov M. & Blandford R.D., 2003, preprint (astro-ph/0312347)
- (12) Markwardt C.B., et al., 2007, “The Swift BAT Software Guide” (v. 6.3) (swift.gsfc.nasa.gov/docs/swift/analysis)
- (13) Meszaros P. & Rees M.J., 2000, ApJ, 530, 292
- (14) Page K.L., et al., 2007, ApJ, 663, 1125
- (15) Piro L., et al., 2005, ApJ, 623, 314
- (16) Ramirez–Ruiz E., Merloni A. & Rees M.J., 2001, MNRAS, 324, 1147
- (17) Ramirez–Ruiz E., MacFadyen A.I. & Lazzati, 2002, MNRAS, 331, 197
- (18) Romano P. et al., 2006, A&A, 456, 917
- (19) Ruffini R., Bianco C.L., Fraschetti F., Xue S.-S., Chardonnet P., 2001, ApJ, 555, L113
- (20) Ryde F., 2005, ApJ, 625, 95
- (21) Sakamoto T., et al., 2008, ApJS, 175, 179
- (22) Vanderspek R., et al. 2004, ApJ, 617, 1251
- (23) Wang X.–Y. & Meszaros P., 2007, ApJ, 670, 1247
| GRB | Main pulse | Precursors | |||||||||
|---|---|---|---|---|---|---|---|---|---|---|---|
| s | s | erg | s | s | erg | ||||||
| 050820A∗ | 2.6 | 225 | 553 | –1.12 | 1.07(0.23)E53a | –17 | 22 | –1.740.08 | 1.14(0.16)E52a | ||
| 060124+ | 2.297 | 301.2 | 811.2 | –1.480.02 | 1.02(0.14)E53b | –1.5 | 13.5 | –1.800.20 | 4.57(0.75)E51b | ||
| 061121+# | 1.314 | 61.8 | 83.38 | –1.320.05 | 4.19(0.67)E52c | –5 | 10 | –1.680.09 | 1.37(0.22)E51d | ||
| 071010B | 0.947 | –1.5 | 15.23 | –2.030.04 | 5.40(0.13)E51 | –30.0 | –12.77 | –1.760.19 | 7.21(0.11)E51 | ||
| 070411 | 2.954 | 49.3 | 98.3 | –1.650.11 | 1.41(0.93)E51 | –19.7 | 31.3 | –1.640.14 | 1.28(0.09)E52 | ||
| 070306 | 1.49 | 83.5 | 154.5 | –1.640.06 | 1.10(0.05)E52 | –118.5 | –103.5 | –1.400.65 | 3.77(2.34)E50 | ||
| –12.48 | 40.51 | –1.590.26 | 2.99(0.82)E51 | ||||||||
| 061007 | 1.261 | 27.2 | 71.2 | –0.940.03 | 6.06(0.08)E52 | –2.8 | 12.2 | –1.070.06 | 7.08(0.18)E51 | ||
| 060729 | 0.54 | 56.9 | 123.9 | –1.740.11 | 1.23(0.14)E51 | –1.1 | 29.4 | –1.820.75 | 2.34(1.36)E50 | ||
| 060714 | 2.711 | 69.9 | 116.9 | –1.300.47 | 1.90(0.16)E52 | –13.1 | 43.9 | –1.860.20 | 1.35(0.25)E52 | ||
| 060707 | 3.425 | –7.3 | 49.7 | –1.700.15 | 1.97(0.14)E52 | –48.3 | –23.3 | –1.690.35 | 4.00(1.82)E51 | ||
| 060210 | 3.91 | –72.3 | 21 | –1.390.08 | 5.15(0.34)E52 | –236.3 | –200.3 | –1.400.33 | 1.07(0.20)E52 | ||
| 060115 | 3.53 | 78.9 | 129.9 | –1.630.11 | 1.99(0.24)E52 | –22.1 | 30.9 | –1.820.19 | 1.34(0.34)E52 | ||
| 050401 | 2.90 | 20.7 | 29.71 | –1.430.12 | 1.18(0.14)E52 | –7.28 | 6.71 | –1.450.10 | 2.01(0.20)E52 | ||
| 050318 | 1.44 | 22.9 | 29.9 | –1.940.09 | 1.83(0.11)E51 | –1.1 | 5.8 | –2.110.24 | 9.63(2.59)E50 | ||
| 050315 | 1.949 | –6.4 | 52. | –2.160.09 | 2.42(0.10)E52 | –57.5 | –25.5 | –1.720.30 | 2.37(0.11)E51 |