A general catalogue of extended objects in the Magellanic System
Abstract
We update the SMC, Bridge, and LMC catalogues of extended objects that were constructed by members of our group from 1995 to 2000. In addition to the rich subsequent literature for the previous classes, we now also include HI shells and supershells. A total of 9305 objects were cross-identified, while our previous catalogues amounted to 7900 entries, an increase of . We present the results in subcatalogues containing 1445 emission nebulae, 3740 star clusters, 3326 associations, and 794 HI shells and supershells. Angular and apparent size distributions of the extended objects are analysed. We conclude that the objects, in general, appear to respond to tidal effects arising from the LMC, SMC, and Bridge. Number-density profiles extracted along directions parallel and perpendicular to the LMC bar, can be described by two exponential-disks. A single exponential-disk fits the equivalent SMC profiles. Interestingly, when angular-averaged number-densities of most of the extended objects are considered, the profiles of both Clouds do not follow an exponential-disk. Rather, they are best described by a tidally-truncated, core/halo profile, despite the fact that the Clouds are clearly disturbed disks. On the other hand, the older star clusters taken isolately, distribute as an exponential disk. The present catalogue is an important tool for the unambiguous identification of previous objects in current CCD surveys and to establish new findings.
keywords:
(galaxies:) Magellanic Clouds1 Introduction
The Magellanic Clouds are fundamental galaxies for astrophysics owing e.g. to their proximity, chemical compositions, age distributions, star cluster structural properties and related dynamical evolution, and as two close-by interacting galaxies (e.g. Westerlund 1990, Da Costa 1991, Piatti et al. 2002, Mackey & Gilmore 2003, Dieball, Müller & Grebel 2002, Bekki & Chiba 2007). Schaefer (2008) reviews recent estimates of the distance to the Clouds and arrives at the values kpc and kpc.
More than 50 years have elapsed since the first attempts to systematically catalogue extended objects in the Magellanic Clouds (e.g. the nonstellar emission nebulae of Henize 1956). We refer as extended objects the emission nebulae, star clusters, associations, and HI shells and supershells. Early catalogues of star clusters included brighter ones in the SMC (Kron 1956, Lindsay 1958) and LMC (Shapley & Lindsay 1963; Lyngå & Westerlund 1963). Fainter clusters with deeper photographic material were detected, e.g. by Hodge & Sexton (1966) and Hodge (1986). Binary or multiple clusters are another characteristics of many Magellanic Cloud clusters, showing their importance for cluster dynamical evolution (Bhatia & Hatzidimitriou 1988; de Oliveira et al. 2000). Examples of catalogues of associations are Lucke & Hodge (1970) for the LMC, Hodge (1985) for the SMC, and Battinelli & Demers (1992) in the Bridge. A complementary study to Henize (1956) is the catalogue of nebular complexes by Davies, Elliott & Meaburn (1976) based on H plates.
Hubble Space Telescope (HST) instrumention revealed serendipitously two faint clusters in the LMC bar that were undetected in Sky Survey plates (Santiago et al. 1998). These two clusters suggested the existence of an important undetected faint population of clusters. CCD mosaics, e.g. Pietrzynski et al. (1998) in the SMC central parts, started to unveil that elusive cluster population.
| Reference | Analysed Number | New Objects | Acronym |
|---|---|---|---|
| (1) | (2) | (3) | (4) |
| Testor, Llebaria & Debray (1988) | 1 | 1 | TLB |
| Walborn & Blades (1997) | 5 | 1 | WB |
| Walborn et al. (1999a) | 2 | 2 | WBB |
| Walborn et al. (1999b) | 4 | 1 | WDP |
| Walborn, Maíz-Apellániz & Barbá (2002) | 5 | 3 | WMB |
| Heydari-Malayeri et al. (1999) | 3 | 1 | HCD99- |
| Heydari-Malayeri et al. (2000) | 2 | 1 | HRR |
| Heydari-Malayeri et al. (2001) | 1 | 1 | HCD01- |
| Heydari-Malayeri et al. (2001) | 2 | 1 | HCD02- |
| Heydari-Malayeri, Meynadier & Walborn (2003) | 2 | 2 | HMW |
| Meynadier, Heydari-Malayeri & Walborn (2005) | 1 | 1 | MHW |
| Bellazzini, Pancino & Ferraro (2005) | 1 | 1 | Bologna |
| Nota et al. (2006); Sabbi et al. (2007) | 16 | 16 | NSS |
| Nakajima et al. (2005) | 25 | 18 | NKD |
| Testor et al. (2006) | 2 | 2 | TLF |
| Testor et al. (2007) | 2 | 2 | TLK |
| Pietrzynski et al. (1999) | 615 | 126 | LOGLE |
| Gouliermis et al. (2003) - Clusters | 259 | 125 | GKK-O |
| Gouliermis et al. (2003) - Associations | 153 | 102 | GKK-A |
| Gouliermis, Quanz & Henning (2007) | 5 | 5 | GKH |
| Hennekemper et al. (2008) | 5 | 0 | HGH |
| Schmalzl et al. (2008) | 1 | 1 | SGDH |
-
Otherwise stated, objects are essentially all clusters.

Bica & Schmitt (1995, updated in Bica & Dutra 2000) and Bica et al. (1999) compiled general catalogues from numerous previous catalogues and many lists sparsely distributed in the literature, and presented new findings based on Sky Survey plates. The total number of extended objects in these catalogues is 7900, including the SMC, intercloud (Bridge) region, and LMC. Cross-identifications that take into account object plate identifications, class, size, positions, and uncertainties were carried out.
As present-day Magellanic Cloud Surveys provide their first results, like the University of Michigan UM/CTIO Magellanic Cloud Emission Line Survey (MCELS)111http://www.ctio.noao.edu/mcels/ , or are scheduled for soon, such as the Visible and Infrared Survey Telescope for Astronomy (VISTA)222http://www.eso.org/gen-fac/pubs/messenger/archive/no.127-mar07/arnaboldi.pdf, we found it timely to update the catalogues of Bica et al. (1999) and Bica & Dutra (2000), so that literature objects can be easily identified, and new findings in deeper surveys can be confidently asserted.
Besides the update, we will use the present catalogue to investigate structural properties of the Clouds as probed by the large-scale spatial distribution of different classes of objects. We will also examine potential effects of the LMC, SMC, and Bridge tidal fields on the structure of individual objects.
This paper is structured as follows. In Sect. 2 we present the updates and additions to the Magellanic System catalogue. In Sect. 3 we discuss statistical properties of the different object classes contained in the catalogue, such as the distributions of apparent size and ellipticity. In Sect. 4 we examine dependences of the object parameters with distance to the Clouds centroids. In Sect. 5 we investigate the structure of both Clouds with the spatial distribution of the catalogue objects. Concluding remarks are given in Sect. 6.
2 The updated Catalogue
The procedures used in this paper are essentially the same as those employed in our previous ones. We cross-identify new and old objects by position, angular size, and object class. We give in Table 1 the statistics on clusters and associations (and related objects) from papers published since the latest catalogue version. Most new papers deal with discoveries with HST. A large number of LMC clusters were studied in the central parts by Pietrzynski et al. (1999) as part of the Optical Gravitational Lens Experiment (OGLE; Udalski 2003). We also included information from Pietrzynski & Udalski (1999) dealing with SMC clusters, and about binary and multiplet clusters in the LMC from Pietrzynski & Udalski (2000).


Besides those, the updated catalogue includes 10 new findings (4 clusters, 3 associations, and 3 emission nebulae) under the acronym BBDS.
A new feature of the present catalogue is the literature indications of genuine ( Gyr) globular clusters (GCs), with two in the SMC (Olszewski, Aaronson & Schommer 1987; Mighell, Sarajedini & French 1998; Alcaino, Alvarado & Kurtev 2003) and 16 in the LMC (Dutra et al. 1999; Mackey & Gilmore 2004; Mackey, Payne & Gilmore 2006). From the latter study we include ESO 121-SC3 as an LMC GC, which is the only cluster in the 4-9 Gyr LMC age gap. They suggest that ESO 121-SC3 was accreted by the LMC. Also included are old SMC intermediate age clusters (IACs) at 4-9 Gyr. These studies are Da Costa (1999), Crowl et al. (2001), Piatti et al. (2001), Piatti et al. (2005), and Piatti et al. (2007). Known GCs and old IACs are very useful to trace the old systems of the Magellanic Clouds (Sect. 3).
The previous catalogue versions included 46 SNRs. Now there are 74 SNRs and candidates. The sources were Dickel et al. (2001), Lazendic, Dickel & Jones (2003), van der Heyden, Bleeker & Kaastra (2004), Blair et al. (2006), Williams, Chu & Gruendl (2006), Bojicic et al. (2007), and Chu et al. (1997).
The catalogue includes improved coordinates derived with DSS and XDSS333Extracted from the Canadian Astronomy Data Centre (CADC), at http://cadcwww.dao.nrc.ca/ images for star clusters in the Bridge and in the outer parts of the SMC. Several corrections were made throughout the previous catalogues, such as e.g. for LMC-N34A and LMC-N34B.
As another interesting case, Lindsay (1961) discovered the nebula L61-593 associated to an emission-line star in the SMC Wing. Westerlund & Henize (1963) interpreted it as a B star with mass loss. With the DSS B and XDSS R images, we find that a star cluster appears to be present, now favouring L61-593 as an H II region rather than a mass-loss star.
In Table 2 we show the updated census of the extended objects in the Magellanic System.
In electronic form, Tables 3 to 6 contain, respectively, 3740 star clusters, 3326 associations, 1445 emission nebulae, and 794 HI shells and supershells. The SMC shells and supershells were studied by Hatzidimitriou et al. (2005) and Staveley-Smith et al. (1997). Hatzidimitriou et al. (2005) pointed out 59 empty shells that do not appear to have stellar counterpart. Such objects are also indicated in Table 5. Muller et al. (2003) presented shells and supershells in the Western part of the Bridge, while Kim et al. (1999) presented those detected in the LMC. The electronic tables are arranged as follows, by column: (1) - designations; (2) and (3) - the central coordinates and , respectively; (4) - object class (see definitions in Table 2); (5) and (6) - major and minor diameters ( and , in arcmin), respectively; (7) - position angle (, in degrees), with to the North and to the East; and (8) - object classification, where “mP”, “mT”, “m4”, and so on, mean member of a pair, triplet, and so forth. For details see, e.g. Bica et al. (1999). Excerpts of the electronic tables showing the first 5 entries are given in Table 3.
We have checked with the present catalogue spatial coincidences between clusters or associations with the above empty shells. Except for a couple of new coincidences, the vast majority of these shells remain empty. Interestingly, a significant fraction of the empty shells distribute over a protuberance to the NE of the SMC, possibly an incipient tidal tail. This protuberance shows up in the Hatzidimitriou et al. (2005) study. A possible interpretation is that these empty shells are not related to recently-formed stars. Instead, they might be the first stages of the gravitational collapse leading to a molecular cloud and/or to star cluster formation.
Also included are H II regions in the Bridge that Muller & Parker (2007) cross-identified with associations from Bica & Schmitt (1995), Bica & Dutra (2000), and probable UV ionising stellar sources (FAUST - Bowyer et al. 1995).
In the present study we adopt shorter acronyms for frequent objects for the sake of space, inspired on SIMBAD444http://simbad.u-strasbg.fr/simbad/ designation contractions: SMC-DEM becomes DEMS, LMCDEM is now DEML, SMCOGLE is SOGLE, and LMCOGLE is LOGLE. In general, we adopt the authors initials as acronym, likewise SIMBAD. SIMBAD designations include the year of publication, and have the advantage to be unique, but often they are too long for a study like the present one. We also changed the BD designation of associations in the Bridge in our previous papers to ICA (intercloud association) according to Battinelli & Demers (1992) and Muller & Parker (2007).
The identification of DEML 147 as an emission nebula on the LMC bar is supported by the detection of a UV-bright cluster or association by Gouliermis et al. (2003), and is thus included in the present catalogue.
| Object type | Census | Comments |
|---|---|---|
| (1) | (2) | (3) |
| Star Clusters | 3740 | C+CN+CA+DCN |
| C | 2769 | ordinary cluster |
| CN | 91 | cluster in nebula |
| CA | 861 | cluster similar to association |
| DCN | 18 | decoupled cluster from nebula |
| Associations | 3326 | A+AN+AC+DAN |
| A | 1724 | ordinary association |
| AN | 257 | association w/nebular traces |
| AC | 1253 | association similar to cluster |
| DAN | 92 | decoupled association from nebula |
| Emission Nebulae | 1445 | NA+NC+EN+SNR+DNC+DNA |
| NA | 995 | nebula w/embedded association |
| NC | 260 | nebula w/probable embedded cluster |
| EN | 6 | nebula wo/association/cluster |
| SNR | 74 | supernova remnants |
| DNC | 18 | decoupled nebula from cluster |
| DNA | 92 | decoupled cluster from nebula |
| HI shells(HS) | 794 | HI shells and supershells |
| Object | Type | a | b | PA | Comments | ||
|---|---|---|---|---|---|---|---|
| (hms) | (° ′ ″) | (′) | (′) | (°) | |||
| (1) | (2) | (3) | (4) | (5) | (6) | (7) | (8) |
| Table 3 - Star Clusters | |||||||
| AM-3, ESO 28SC4 | 23:48:59 | 72:56:43 | C | 0.90 | 0.90 | — | Old IAC |
| L1, ESO 28SC8 | 0:03:54 | 73:28:19 | C | 4.60 | 4.60 | — | Globular Cluster |
| L2 | 0:12:55 | 73:29:15 | C | 1.20 | 1.20 | — | |
| L3, ESO 28SC13 | 0:18:25 | 74:19:07 | C | 1.00 | 1.00 | — | |
| HW1 | 0:18:27 | 73:23:42 | CA | 0.95 | 0.85 | 0 | |
| Table 4 - Associations | |||||||
| B3 | 0:24:00 | 73:38:10 | A | 1.20 | 1.10 | 40 | |
| HW2 | 0:27:57 | 74:00:05 | C | 0.75 | 0.55 | 70 | |
| H86-3 | 0:28:04 | 73:03:33 | AC | 0.75 | 0.55 | 70 | |
| H86-6 | 0:29:22 | 73:00:00 | AC | 0.60 | 0.45 | 20 | |
| HW3 | 0:29:54 | 73:42:03 | AC | 1.50 | 1.10 | 70 | |
| Table 5 - Emission nebulae | |||||||
| SMC-N3,DEMS1 | 0:31:40 | 73:47:43 | NA | 1.10 | 1.10 | — | |
| DEMS2 | 0:37:15 | 72:59:41 | DNA | 1.80 | 1.20 | 140 | in H-A1, DC K14 |
| DEMS5 | 0:41:00 | 73:36:22 | NA | 2.90 | 2.90 | — | |
| DEMS6 | 0:42:14 | 72:59:25 | NA | 1.10 | 1.10 | — | |
| L61-34,MA37 | 0:42:16 | 72:59:53 | NC | 0.40 | 0.35 | 120 | in DEMS6 |
| Table 6 - HI shells and supershells | |||||||
| SSH-GS1 | 0:31:26 | 72:52:24 | HS | 5.4 | 5.4 | — | |
| SSH-GS2 | 0:32:07 | 73:21:19 | HS | 5.8 | 5.8 | — | |
| SSH-GS3 | 0:32:15 | 72:49:46 | HS | 2.6 | 2.6 | — | |
| SSH-GS4 | 0:33:07 | 73:26:16 | HS | 11.6 | 11.6 | — | |
| SSH-GS5 | 0:33:09 | 73:23:17 | HS | 4.8 | 4.8 | — | |
-
Col. 4: Object type as defined in Table 2. Cols. 5 and 6: Major and minor axes. Col. 7: Major axis position angle.
With the recent additions and cross-identifications, the present catalogue contains about 12% more objects than those in Bica et al. (1999) and Bica & Dutra (2000) together.
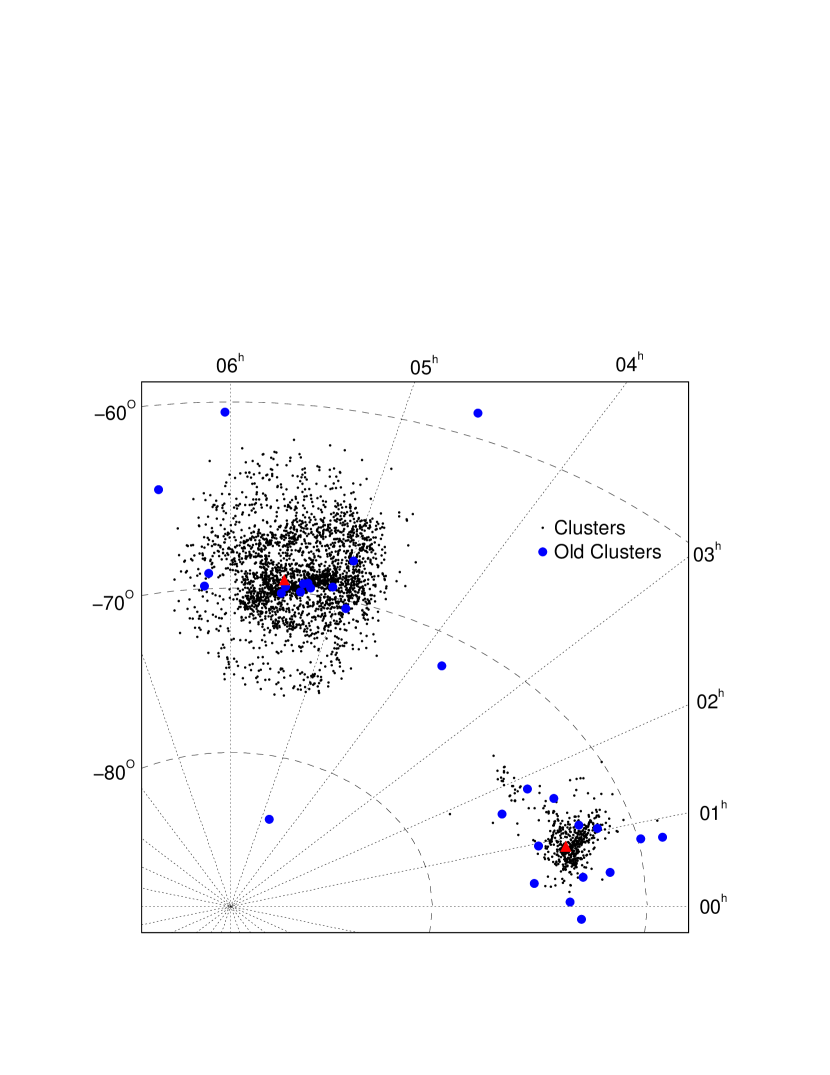
Figure 1 shows the angular distribution of the total sample of extended objects. Outstanding features such as the LMC central disk and bar (), outer de-centred ring, the Bridge, and the SMC Wing and disk (), have been discussed in, e.g. Westerlund (1990), Kontizas et al. (1990), Bica & Schmitt (1995), Bica et al. (1999), and Bica & Dutra (2000), and references therein.
In Fig. 1 the old LMC clusters trace a bar-like structure, somewhat rotated with respect to that defined by the extended objects in general. This effect was previously described by Dottori et al. (1996), where they found that the bar occupied preferentially by young clusters (SWB I) is rotated with respect to the older group (SWB II), owing to the propagation of the perturbation through the LMC disk that causes current star formation.
In Fig. 2 we show separate distributions for each individual class. We note that the LMC is still undersampled with respect to the SMC HI shells and super-shells, and the eastern part of the Bridge is yet to be observed. Besides the SMC bar and Wing, the HI shells may trace additional features possibly related to tidal effects. Interestingly, the associations suggest a spiral arm-like outer extension in the eastern side of the LMC. The SMC disk and the Bridge are better traced by associations. The nebulae in the LMC appear to follow a spiral pattern centred in the 30 Dor region (Fig. 2, lower-left panel). Finally, the old star clusters trace the LMC bar and outer parts, while the old SMC clusters are preferentially distributed in its outer parts.
3 Statistical properties of the extended objects
The relatively large number of objects included in the subsamples (electronic Tables 3 to 6), can be used to investigate statistical properties of some structural parameters, both in terms of object class and tidal field strength. Of particular interest is whether effects due to the very different LMC and SMC tidal fields on the structural parameters and spatial distribution of the objects can be detected and quantified with the presently updated catalogue.
For the sake of simplicity, we separate the objects into 2 classes, (i) clusters, which contain essentially the star clusters older than 5 Myr, and (ii) associations and related objects, in which we gather the HI shells and super shells, OB associations and emission nebulae. Besides, we also consider the spatial location of each object according to right ascension. We take as SMC objects those located within , LMC ones at , while Bridge objects are located in between (e.g. Fig. 1). We point out that the present definition of the Bridge is somewhat broader than that adopted in Bica & Schmitt (1995). It now includes part of the SMC Wing.
3.1 Apparent diameters
The updated MC catalogue gives the apparent major and minor axes, and , respectively, from which we compute the mean apparent diameter for each object. Based on this, we build the apparent diameter distribution function, defined as . In Fig. 3 (left panels) we show of the clusters and associations located in the LMC, SMC, Bridge, as well as in the MC system as a whole. Star clusters and associations present different distributions in all MC subsystems. In particular, associations tend to have objects with larger diameters than the clusters.
Another interesting fact is that the apparent diameter distributions fall off as a power-law for objects that occupy the large-size tail (Fig. 3). Indeed, the distributions can be reasonably well fitted with the function in the range (Fig. 3). Table 7 summarises the fit details. The number of LMC and SMC star clusters fall off towards large diameters at a faster rate () than the associations (), while in the Bridge the slopes are similar (). The slope in the apparent radii distribution of the associations agrees with that predicted (and measured) for H II regions in spiral galaxies (Oey et al. 2003). Since most of the clusters are significantly older than the associations, the difference in slope (and maximum size) probably reflects the several Myr of dynamical evolution and disruption effects operating on the former structures. Besides, the steeper decline with apparent diameter observed in the LMC and SMC cluster , with respect to the Bridge, is consistent with the stronger tidal field of the Clouds.
If extrapolated to the small-radii tail, the decaying-power law distribution of apparent diameters in the LMC, SMC, and Bridge (top-left panel in Fig. 3), would suggest that the number of observed objects represents a small fraction of the total population. Indeed, because of the difference in slope, the fraction of observed associations would be , and for the clusters. Known small clusters are in general embedded in HII region complexes (Table 1). Their small number certainly stresses the fact that systematic surveys for small-scale structures are yet to be carried out.

| Reference | ||||
|---|---|---|---|---|
| Sample | (′) | (′) | ||
| All assoc. | 4.4 | 100 | ||
| All clusters | 0.76 | 5.3 | ||
| LMC assoc. | 0.95 | 100 | ||
| LMC clusters | 0.76 | 5.3 | ||
| SMC assoc. | 5.4 | 43 | ||
| SMC clusters | 0.76 | 4.6 | ||
| Bridge assoc. | 4.4 | 55 | ||
| Bridge clusters | 0.54 | 4.4 |
-
Fits with the function are performed for . The combined LMC, SMC, and Bridge samples are represented by the ‘All’ reference sample.

The apparent diameter distribution functions (normalised to the same number of objects for inter-class comparisons) of similar classes of objects in the LMC, SMC, and Bridge, are shown in Fig. 4 (top panels). For a more intrinsic analysis, SMC and Bridge apparent diameters have been multiplied by 1.2, to account for the different distances with respect to the LMC (Sect. 1). Within uncertainties, the star clusters present similar distributions, especially in the LMC and SMC. With the available data, the Bridge appears not to harbour clusters smaller than . As for the HI shells, associations and nebulae, the SMC and Bridge present similar distributions, and both appear to have an excess of objects larger than with respect to the LMC. This effect may be associated to the weaker SMC and Bridge tidal fields, which allow the presence of distended, low-binding energy objects, such as those included in the association class. The LMC and SMC distributions present a steep drop towards smaller , beginning at . At the LMC and SMC distances, this corresponds to physical radii of pc. Such clusters (or associations) are not small by Galactic open cluster standards. In fact, this corresponds to average-size Galactic open clusters (see, e.g. Fig. 7 in Bonatto et al. 2007). This raises the question of whether such a drop is a real effect associated to formation processes and/or dissolution, an observational limitation linked to completeness, or more probably, a combination of both. In any case, the completeness is not the same in the 3 MC subsystems. Because of the lower surface brightness of the background and the less-populous nature of the Bridge, star clusters and associations stand out more, and completeness effects in the Bridge are expected to be less important than in the Clouds.
At this point, it may be interesting to compare the MCs apparent diameter distribution functions with the equivalent one built with the Galactic population of GCs, which is basically complete and probes all the old Galactic substructures (see, e.g. Bonatto et al. 2007). Obviously, the Galactic GCs are essentially old systems, while the MCs distribution functions contain young objects as well. However, the main purpose here is to examine the shape of the Milky Way (MW) GC size-distribution function, especially at the small-size tail. In principle, it should be more correct to include the Galactic open clusters in this analysis, since they span a wide range in ages and populate especially the young tail of the age distribution. However, contrary to the GCs, the open clusters are severely affected by completeness, especially at the faint-end of the luminosity distribution (e.g. Bonatto et al. 2006a), which might introduce a completeness-related drop towards small open clusters in the size distribution function.
Thus, with the above arguments in mind, we take as reference of GC size the tidal radii given by Harris (1996, and the update in 2003555http://physun.physics.mcmaster.ca/Globular.html). Additionally, we consider as well the tidal radii of 11 faint GCs (not included in Harris 1996) derived by Bonatto & Bica (2008), and the recently studied GC FSR 1767 (Bonatto et al. 2007). Since MCs objects are essentially at the same distance from the Sun, the MW GC tidal radii are converted to the parsec scale for a consistent comparison. The latter conversion is based on the updated GC distances to the Sun given by Bica et al. (2006). For comparison purposes, the dynamical range of the MW GCs tidal radii have matched to the angular scales of the MCs (Fig. 4).
The tidal radii distribution function of the MW GCs is shown in Fig. 4 (bottom panel). Qualitatively, it presents similar features as those of the MCs objects, especially the relatively narrow width of the MC star clusters distribution function. Besides a maximum between , the distribution function of the Galactic GCs drops off both towards small and large radii. If the MW GCs sample is indeed basically complete, this suggests that the small-size drop observed in the MCs distribution functions may be real, at least in part.
The peak distribution of apparent diameters in the MC system occurs for which, for an average distance of kpc, corresponds to radii in the range pc. Such radii are a factor smaller than the peak tidal radii of the MW GCs. Most of the difference may be accounted for by the fact that we deal with apparent sizes (measured on images as far as the background limit) in the MC system and tidal radii (which comes from, e.g. a King-profile fit) in the MW. Although most of the cluster stars can be considered to be contained inside the apparent radius, it is smaller than the tidal radius. For instance, the tidal radii computed for populous and relatively high Galactic latitude MW OCs such as M 67, NGC 188, and NGC 2477, are about 4 times larger than the respective apparent radii (Bonatto & Bica 2005).
3.2 Ellipticity
We apply a similar analysis to the ellipticity () distribution function, . LMC, SMC, and Bridge clusters follow similar distribution functions (Fig. 3, right panels), especially the LMC and SMC ones. The fractional number of clusters decreases monotonically with ellipticity within the range , in all structures considered.
While the ellipticity distribution function of the clusters is similar in the LMC, SMC, and Bridge, the associations, on the other hand, have different properties in different spatial structures. In particular, LMC and SMC associations contain objects with higher ellipticity values () than those of the clusters, with a slower decay of the fractional number with increasing (Fig. 3).
Bridge associations have an ellipticity distribution that is rather flat in the range , which indicates the presence of an important fraction of non-circular objects. Besides, the distribution reaches a peak for the nearly circular objects. SMC associations follow a similar, although less flat, distribution. LMC associations, on the other hand, follow a smoothly-decreasing distribution, with a peak at , and dropping somewhat at . Besides, LMC, SMC, and Bridge associations reach significantly higher values of than the corresponding clusters, .
Analytically, the combined LMCSMCBridge ellipticity distribution functions for the associations and clusters (Fig. 3, top-right panel) are well described by the function , with dimensionless ellipticity scales , respectively. Given the relative similarity of the remaining, isolated distribution functions in the LMC, SMC, and Bridge with the combined ones, it is obvious that they follow the same analytical function, but with different ellipticity scales. Indeed, the best-fit functions (Fig. 3, right panels) are obtained for association-ellipticity scales about twice larger than those of the clusters. While the cluster ellipticity scale increases from the LMC to the SMC and Bridge, for the associations increases by .
The above aspects are consistent with the fact that associations, in general, tend to be systems less-bound than clusters, and thus more subject to distortions by tidal fields. Besides, strong tidal fields may prevent the survival to advanced ages of a large population of distended objects, because of induced torques, tidal disruption, and so on. With time, such effects may either disrupt significantly-distended objects, or at least, make them more circular at later ages. In any case, the qualitative aspects of the ellipticity distribution functions, as well as the environmental dependence of the ellipticity-scale, appear to correlate with the relative strengths of the LMC, SMC, and Bridge tidal fields.
3.3 Position angle and alignment
In Fig. 5 we examine the distribution of the position angle () of the clusters and associations around both Clouds. Objects with ellipticity higher and lower than are considered separately. In the LMC, of the clusters with measured are more circular than (panel e), while in the SMC this fraction drops to (f). As for the associations, the corresponding fractions are in the LMC (i) and in the SMC (j). Clusters, in both Clouds, tend to be more circular than the associations, especially in the LMC, which again is consistent with the respective tidal field strengths of the Clouds, and the relative binding energy of the objects. Interestingly, there is a significant drop in the number of LMC objects with , especially the associations, but conspicuous as well for the clusters. Since the of the LMC bar (Fig. 1) is on average (Fig. 1), one might speculate whether there is an enhanced dissolution of objects with parallel to the bar. We expect that the maximum tidal effect will occur for extended objects at the tips of the bar with parallel , which might imply a resonant effect. The collapse of molecular clouds is expected to be essentially radial, so that clusters do not acquire much rotation during formation. Indeed, the bar/ alignment does not occur in the SMC, probably because of its less prominent bar.
We also estimate the alignment between each object’s and the angle defined by direction vector () with respect to the corresponding Cloud centroid, . The angle is measured in the same way as (Sect. 2). Since the alignment is symmetrical with respect to the sign of , and corresponds to the smaller angle, the measured values are in the range . Clusters and associations of both Clouds (Fig. 5, panels c, d, g, h, k, and l) do not appear to present statistically significant trends in .

4 Parameters as a function of distance to the centroids
Most Milky Way GCs have a size that scales with the Galactocentric distance (e.g. van den Bergh, Morbey & Pazder 1991; Bonatto & Bica 2008). Part of this relation may have been established as early as at the Galaxy formation, when the higher density of molecular gas in central regions may have produced smaller clusters (e.g. van den Bergh, Morbey & Pazder 1991). Dynamical evolution, especially that driven by external processes such as tidal disruption, collision with giant molecular clouds, disk and spiral arms, is important as well to establish a relation of increasing cluster size with Galactocentric distance. Such processes lead to the disruption of most star clusters in a mass-dependent time-scale shorter than Gyr (Gieles et al. 2006). Since the latter effects are more critical for low-mass objects located close to strong tidal fields, a similar relation has been observed for the Galactic open clusters (e.g. Lyngå 1982; Tadross et al. 2002; Bonatto & Bica 2005; Bonatto & Bica 2007).
In the top panels of Fig. 6 we investigate the above issue with the apparent diameters of the catalogue LMC and SMC objects (converted to the values corresponding to the LMC distance). The main purpose here is to search for trends, thus to minimise scatter we work with running averages, which correspond to the average value of a given parameter within bins usually containing 20% of the number of objects in each sample. The result of this procedure are the fiducial lines shown in Fig. 6. While LMC and SMC clusters have, on average, similar sizes, SMC associations are larger, as already implied by Fig. 4. Clusters and associations in both Clouds appear to follow a trend of increasing apparent size with angular distance to the respective centroid, except perhaps for some fluctuation in the LMC associations.
The ellipticity of the SMC objects presents a similar relation with distance to the centroids, in the sense that objects closer to each Cloud’s centroid tend to be less circular (middle-right panels of Fig. 6). However, this relation is milder in the LMC objects.

Finally, there appears to exist a mild correlation between the alignment angle and distance from the centroid for the LMC star clusters, in the sense that clusters closer to the LMC have the more aligned with the direction axis (bottom panels of Fig. 6). The alignment, in this case, occurs at the angle . A similar relation appears for the LMC associations and SMC associations and clusters, but only for objects more distant than (LMC) and (SMC). The trend appears to be reversed for objects closer than these distances. However, as a caveat we note that such trends are rather speculative, since variations of and in of the LMC and SMC, respectively, may be within the measurement uncertainties.
5 Large-scale structure of the MC system
We analyse the large-scale structure of the Clouds by means of the angular distribution of extended objects (adding star clusters and associations in general). Since the Clouds do not have symmetrical structures (Fig. 1), we employ two different approaches in what follows. First we explore angular slices along nearly perpendicular directions (Sect. 5.1), and concentric radial distribution (Sect. 5.2).
5.1 Azimuthal extractions
The position of the extracted slices take advantage of the direction of the prominent LMC bar, and the possible bar/disk structure. The adopted geometry of the extractions is illustrated in Fig. 7. We examine the structure along the LMC bar and in a perpendicular direction, which probes the underlying disk. In the SMC we extract slices along the disk/bar and nearly perpendicular directions. As reference, we take as centres of the slices the geometrical centroids of the LMC bar and the SMC disk/bar (Table 8).
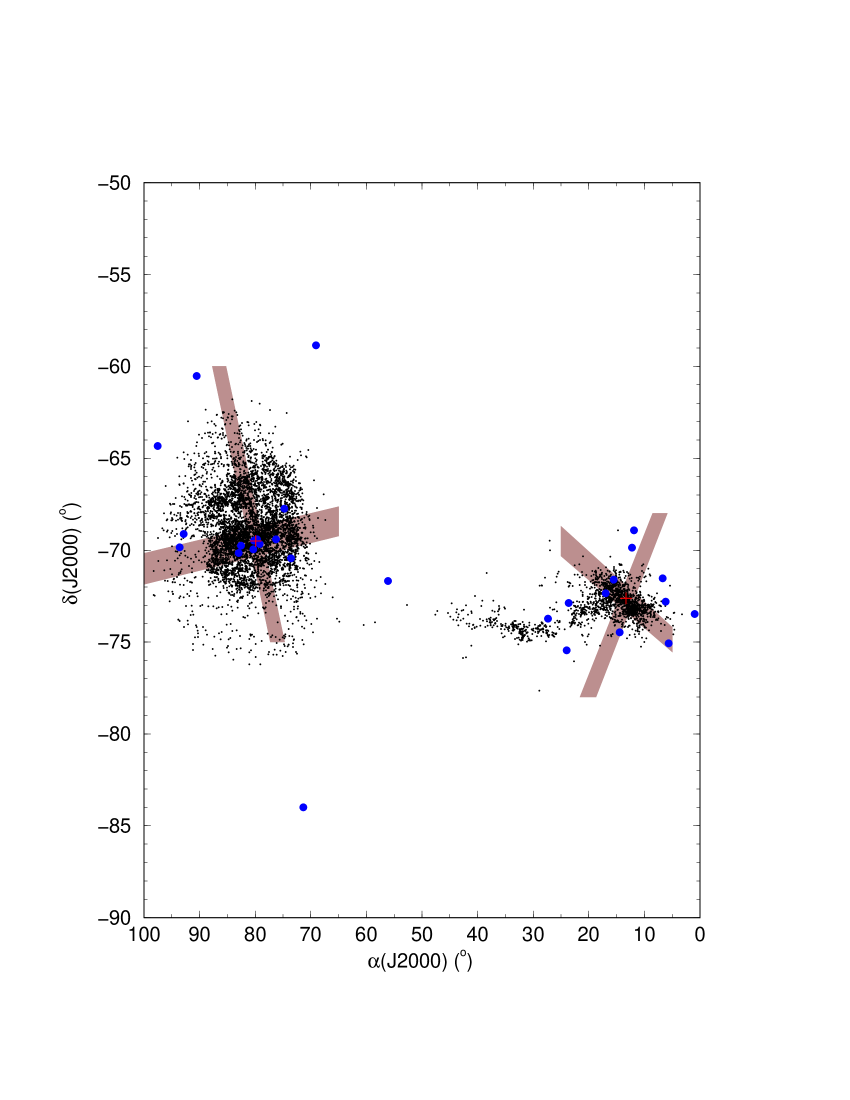
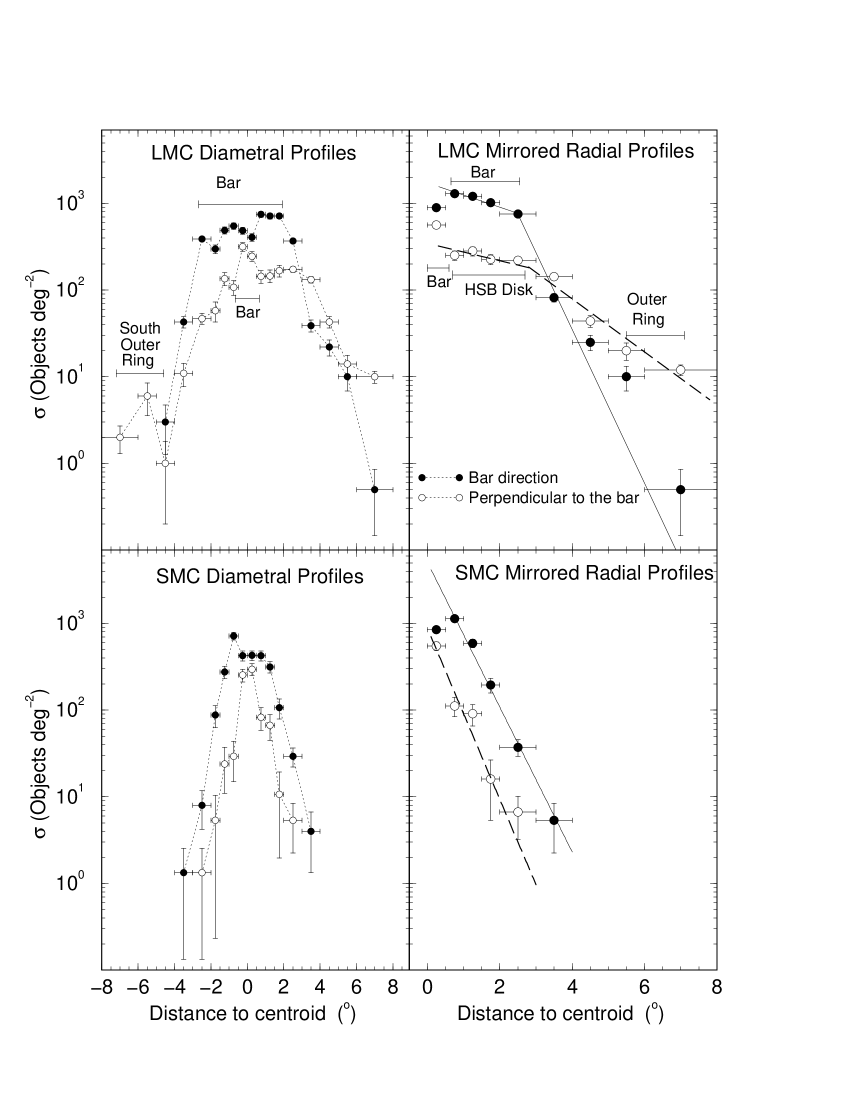
Figure 8 shows the azimuthal density profiles for the LMC (top-left panel) and SMC (bottom-left). The distance of a given object with the observed equatorial coordinates to the adopted centroid , is computed as . Thus, because of the declination of the Clouds, angular separations in Fig. 8 correspond to of those implied by the axes of Fig. 1.
As expected, the main LMC structures, such as the bar, the high-surface brightness (HSB) disk, and the outer ring, can be detected in the profiles. The SMC profiles appear to be described essentially by exponential disks. While both SMC profiles are almost symmetrical with respect to the adopted centroid, the prominent LMC structures introduce significant asymmetries, both with respect to the bar centroid and between the perpendicular slices. The LMC bar is a factor denser (in terms of the number of objects per area) than the HSB disk. The central excess in the perpendicular LMC profile corresponds to part of the bar. In the SMC, the average density of the bar/disk profile is a factor denser than that of the nearly-perpendicular direction.
In any case, we build as well pseudo-symmetrical profiles by folding the opposite sides of the azimuthal extractions over the respective centres. In this process, symmetrical points that occur at the same bin of distance to centroid are averaged out. The mirrored radial profiles are shown in the right panels of Fig. 8, where the main structural features can be seen as well. We fit these profiles with an exponential-disk function adapted to number counts, , where represents the number-density of objects at the centre, and is the disk scale length. As expected, both SMC profiles are well fit by exponential-disks, with the scale lengths and , respectively for the bar/disk parallel and nearly-perpendicular profiles. The LMC profiles, on the other hand, require two exponential-disks each to account for the dense structures. Thus, the profile parallel to the bar can be represented by the disk scale lengths and , for the bar region and beyond the bar limits, respectively. In the nearly-perpendicular direction, two disks are also necessary, but in this case the inner one (within the bar limits) corresponds to the HSB disk. In this case, the number-density excesses over the disk profile correspond to the additional outer disk (Fig. 1). We derive and for the inner and outer parts of the perpendicular profile. The innermost points (Fig. 8) in both profiles were excluded from the fits.
There is evidence that the Magellanic Clouds have complex spatial structure. Indeed, the LMC has an inclined disk-like structure (e.g. Olsen & Salyk 2002), which is warped (e.g. Nikolaev et al. 2004), and flared (e.g. Alves & Nelson 2000). Besides, the deprojected LMC structure is elliptical, being more extended along the North-South direction (van der Marel 2001). The SMC appears to have a 3-dimensional structure more extended along the line-of-sight (Crowl et al. 2001). The present analysis (Fig. 8) is based on the angular distribution of the objects in both Clouds. Thus, it is possible that part of the differences detected in the two perpendicular directions in both Clouds arises from their intrinsic properties and projection effects.
5.2 Concentric radial distribution
Alternatively, we analyse the spatial distribution of the extended objects by means of the radial density profiles (RDPs). The RDPs corrrespond to the projected radial surface-density, i.e, the number-density of objects contained in concentric rings around the LMC and SMC centroids. The underlying assumption for this kind of analysis, which is mostly applied to star clusters, is that the structures should present an important degree of radial symmetry. This is not the case of the Clouds, as discussed in previous sections. In any case, RDPs still can be used as probes of the radial distribution of objects averaged over all azimuthal directions and, consequently, of the large-scale structure.
Table 8 gives the LMC and SMC centroid coordinates derived for the spatial distribution of the combined clustersassociations (and related objects), as well as those corresponding to the clusters separately. These centroids correspond to the region where the maximum number-density of objects in each class occurs. In the LMC the cluster centroid is shifted and to the West and South, respectively, with respect to the combined distribution centroid. The offset in the SMC is about twice as large, but in the opposite directions. We recall that the position of 30 Dor (R 136) is , and , thus somewhat to the East and North of the centroids in Table 8 (Fig. 1).
| Reference | ||||
|---|---|---|---|---|
| System | (hms) | () | (′) | (′) |
| LMC combined | 05:31:28.8 | 69:22:30 | — | — |
| LMC clusters | 05:31:00.0 | 69:22:48 | ||
| SMC combined | 00:52:31.2 | 73:15:00 | — | — |
| SMC clusters | 00:53:28.8 | 73:07:48 | ||
| LMC bar | 05:19:36.6 | 69:07:08 | 178 | 7.7 |
| SMC bar/disk | 00:53:10.3 | 72:37:12 |
-
The offsets of the centroid coordinates derived from the cluster distribution with respect to the combined (clustersassociations) distribution are given by and . The last two lines correspond to the geometrical centroids of the LMC bar and SMC bar/disk.
It is worth noting that a centroid definition depends on which tracer is used. For instance, de Vaucouleurs & Freeman (1972) obtained and as the optical centre of the LMC bar. With stellar density contours in the infrared, van der Marel (2001) obtained and as the LMC centre. Finally, Kim et al. (1998) found the LMC HI kinematic centre to lie at and . Thus, our LMC bar centroid (Table 8), which is particularly sensitive to the distribution of young clusters and associations, lies somewhat to the North-West of the optical value provided by de Vaucouleurs & Freeman (1972). The present LMC centroid (Table 8) lies to the East of those of van der Marel (2001) () and Kim et al. (1998) (), and halfway () between them in declination. As for the SMC, Westerlund (1990) reported and as the optical centre, which lies and to the North-West of the centroid derived in this work (Table 8).
We build the RDPs with the centroid coordinates derived for the combined distributions (Table 8). They are shown in Fig. 9, with the combined clustersassociations (top panels) and clusters, separately (bottom). Many of the catalogue objects are young, and the corresponding RDPs should represent the relatively recent spatial distribution, Myr (Bica et al. 1996).
At first sight, the RDPs (Fig. 9) present similar shapes, with a relatively flat and extended central region followed by a steep decline towards large galactocentric radii. As expected from its larger size, the LMC RDPs reach a distance of from the centre, while in the SMC, .
As a first approach to describe the LMC and SMC structures implied by the RDPs, by means of an analytical function, we test an exponential-disk profile. In all cases, the overall fit fails to reproduce important RDP features. In particular, it overestimates the density of objects especially in the central parts and external region, and underestimates it in the mid region. Fit parameters are given in Table 9. In any case, this kind of fit suggests that the LMC disk-scale length is , about twice the SMC value. We also try the law (de Vaucouleurs 1948), but as shown for the LMC RDP (panel a), it fails completely. Obviously, a combination of both would not either describe the profiles. One conclusion, drawn from such a statistically comprehensive catalogue, is that the (angular-average) large-scale structure of both interacting irregular galaxies does not follow the classical disk and/or spheroidal laws.
Alternatively, we also test a 3-parameter profile based on the King (1966) law, which usually describes the structure of star clusters, especially the Galactic GCs and open clusters, by means of the surface-brightness distribution. Formally, we express the adopted King-like profile as , where and are the core and tidal radii, respectively, and is the central density of objects. Qualitatively, the corresponding profiles reproduce well the observed RDPs over the full radial range (Fig. 9). Within uncertainties, the structural parameters implied by the combined clustersassociations and clusters alone RDPs are similar (Table 9). For the LMC we derive a core radius which, at the LMC distance ( kpc), corresponds to kpc; for the tidal radius we derive kpc. Similar considerations for the SMC ( kpc) lead to kpc, and kpc. Thus, in absolute units, the SMC structural radii correspond to about half of the LMC ones. Finally, the concentration parameters , in all cases, are comparable to those of the least concentrated Galactic GCs (see, e.g. Fig. 7 in Bonatto et al. 2007).
King profiles usually describe the structure of virialised systems, such as the old Galactic GCs, but many of the LMC and SMC objects used in the above analysis are young. However, we note that the structure of some young Galactic star clusters have been shown to follow the King profile as well, e.g. the Myr open cluster NGC 6611 (Bonatto, Santos Jr. & Bica 2006), and NGC 4755 (Bonatto et al. 2006b), with Myr of age. Ironically, the best-fit to the average radial distribution of objects in both Clouds is given by the King-like profile, which is not usually applied to the structure of galaxies.
| RDP | CC | CC | ||||||
| (deg) | (deg) | (deg) | ||||||
| (1) | (2) | (3) | (4) | (5) | (6) | (7) | (8) | (9) |
| LMC combined | 0.52 | 0.982 | 0.898 | |||||
| LMC clusters | 0.48 | 0.984 | 0.897 | |||||
| SMC combined | 0.48 | 0.978 | 0.978 | |||||
| SMC clusters | 0.58 | 0.967 | 0.947 | |||||
| Old clusters | 0.44 | 0.912 | 0.943 | |||||
-
Col. 5: concentration parameter, . Col. 6: fit correlation coefficient. Combined: star clustersassociations.

Each Cloud harbours about half of the 29 old star clusters present in the catalogue (electronic Table 3; Fig. 1). Such clusters are much older than the time elapsed since the last encounter between both Clouds (e.g. Bekki & Chiba 2007), and they can be used to probe whether the present-day spatial distribution of the old clusters retains information on the early-Cloud structure. Two of these are the very distant GCs NGC 1841 and Reticulum, at (Fig. 1), which are likely LMC members (Suntzeff et al. 1992). We consider for this analysis a composite RDP, in which we compute for each old star cluster the distance to the nearest MC centroid. The combined LMC and SMC RDP is shown in Fig. 10. At first sight, it appears to represent a more extended structure than those discussed in Fig. 9, but the extension may be caused by the two distant GCs. In any case, the exponential disk, with a scale-length of about , now appears to describe the full radial range of the RDP somewhat better than the 3-parameter King profile, while the law fails altogether. The more extended character of this RDP is reflected on the fit structural parameters, which are larger than those derived with the younger objects (Table 9).

6 Summary and conclusions
The primary goal of this paper is to update the catalogue of extended objects in the Magellanic System. With the recent addition of HST, CCD mosaics, and survey data, the number of known objects in the Clouds now reaches 9503, which represents a relatively substantial increase of with respect to the previous versions (Bica & Schmitt 1995; Bica et al. 1999; Bica & Dutra 2000). It now includes HI shells and supershells, cross-identifications with the previous literature, and subsequently discovered objects.
Such a number of objects is large enough to allow for a statistically significant analysis of environmental effects on the distribution of structural parameters among the different classes of objects, in the LMC, SMC, and Bridge tidal fields separately. Star clusters present similar distributions of structural parameters in the three MC subsystems. SMC associations (and related objects, emission nebulae, and HI shells and supershells), on the other hand, tend to be larger and more circular than in the LMC. We also detect evidence that the apparent diameter of clusters and associations increase with the distance to each Cloud centroid. The ellipticity presents the opposite trend, especially in the SMC. These relations are consistent with the relative strengths of the LMC, SMC, and Bridge tidal fields. Indeed, the standard model of Bekki & Chiba (2007) assumes the masses and for the LMC and SMC, respectively. Obviously, the Bridge is less massive than the SMC. Such masses can produce significant tidal stress on star clusters and associations, depending on their location.
With respect to the angular distribution of objects, number-density profiles extracted along the LMC bar and in a perpendicular direction can be reasonably well represented by two exponential disks, one for the bar region and the other for the outer parts of the profile (Fig. 8). Disk scale-lengths parallel to the bar are kpc and kpc, for the bar region and beyond, respectively. In the perpendicular direction they are kpc and kpc, for the high-surface brightness disk and outer ring, respectively. Similar profiles extracted along equivalent directions in the SMC follow a single exponential disk with kpc of scale-length.
Alternatively, when (angular-averaged) radial number-density profiles are considered, the large-scale structure of both Clouds appears to be best described by a 3-parameter King-like function, characterised by core and halo sub-structures. In this case, the LMC core and tidal radii are and , respectively; SMC values are a factor of the LMC ones. In absolute scale, LMC values are kpc and kpc, while SMC ones are about half of these. The tidal/core radii ratio in both Clouds imply low concentration parameters, comparable to those of sparse Galactic GCs.
What emerges from the present work is a scenario where the present-day, (angular-averaged) large-scale structures of both Clouds appear to behave as tidally-truncated systems (which is not unexpected, since they are Milky Way satellites), characterised by well-defined core and halo sub-structures. This picture comes about despite the fact that both Clouds are not spherical systems (Fig. 1). Thus, they have undergone severe tidal perturbation when the last dynamical and hydrodynamical interaction between the Clouds took place, about 200 Myr ago (Bekki & Chiba 2007). Taken isolately, the older LMC and SMC star clusters, on the other hand, appear to be distributed as an exponential disk. This distribution is possibly reminiscent of the Clouds structure prior to the last interaction.
The LMC/SMC interaction is not unusual in the local Universe. They can be classified into the minor-merger interaction picture, which involves high and low-mass galaxies (e.g. Ferreiro & Pastoriza 2004, and references therein). A series of examples of such interactions involving galaxies with prominent bulge and disk has been studied in that paper. Some of the disk galaxies developed the double-disk structure, similarly to the present case of the LMC.
Acknowledgements
We acknowledge partial support from CNPq (Brazil). We thank the anonymous referee for interesting suggestions.
References
- Alcaino, Alvarado & Kurtev (2003) Alcaino, G., Alvarado, F. & Kurtev, R. 2003, A&A, 407, 919
- Alves & Nelson (2000) Alves, D.R. & Nelson, C.A. 2000, ApJ, 542, 789
- Battinelli & Demers (1992) Battinelli, P. & Demers, S. 1992, AJ, 104, 1458
- Bekki & Chiba (2007) Bekki, K. & Chiba, M. 2007, PASA, 24, 21
- Bellazzini, Pancino & Ferraro (2005) Bellazzini, M., Pancino, E. & Ferraro, F.R. 2005, A&A, 435, 871
- van den Bergh, Morbey & Pazder (1991) van den Bergh, S., Morbey, C. & Pazder, J. 1991, ApJ, 375, 594
- Bhatia & Hatzidimitriou (1988) Bhatia, R.K., Hatzidimitriou, D. 1988, MNRAS, 230, 215
- Bica & Schmitt (1995) Bica, E. & Schmitt, H. 1995, ApJS, 101, 41
- Bica et al. (1996) Bica, E., Clariá, J.J., Dottori, H., Santos Jr., J.F.C. & Piatti, A.E. 1996, ApJS, 102, 57
- Bica et al. (1999) Bica, E., Schmitt, H., Dutra, C.M. & Oliveira, H.L. 1999, AJ, 117, 238
- Bica & Dutra (2000) Bica, E. & Dutra, C.M. 2000, AJ, 119, 1214
- Bica et al. (2006) Bica, E., Bonatto, C., Barbuy, B., & Ortolani, S. 2006, A&A, 450, 105
- Blair et al. (2006) Blair, W.P., Ghavamian, P., Sankrit, R. & Danforth, C.W. 2006, ApJS, 165, 480
- Bojicic et al. (2007) Bojicic, I.S., Filipovic, M.D., Parker, Q.A., Payne, J.L., Jones, P.A., Reid, W., Kawamura, A. & Fukui, Y. 2007, MNRAS, 378, 1237
- Bonatto & Bica (2005) Bonatto, C. & Bica, E. 2005, A&A, 437, 483
- Bonatto, Santos Jr. & Bica (2006) Bonatto, C., Santos Jr., J.F.C. & Bica, E. 2006, A&A, 445, 567
- Bonatto et al. (2006a) Bonatto, C., Kerber, L.O., Bica, E. & Santiago, B.X. 2006a, A&A, 446, 121
- Bonatto et al. (2006b) Bonatto, C., Bica, E., Ortolani, S. & Barbuy, B. 2006b, A&A, 453, 121
- Bonatto et al. (2007) Bonatto, C., Bica, E., Ortolani, S. & Barbuy, B. 2007, MNRAS, 381, L45
- Bonatto & Bica (2007) Bonatto, C. & Bica, E. 2007, A&A, 473, 445
- Bonatto & Bica (2008) Bonatto, C. & Bica, E. 2008, A&A, 479, 741
- Bowyer et al. (1995) Bowyer, S., Sasseen, T.P., Wu, X. & Lampton, M. 1995, ApJS, 96, 461
- Chu et al. (1997) Chu, Y.-H., Kennicutt, R.C., Snowden, S.L., Smith, R.C., Williams, R.M. & Bomans, D.J. 1997, PASP, 109, 554
- Crowl et al. (2001) Crowl, H.H., Sarajedini, A., Piatti, A.E., Geisler, D., Bica, E., Clariá, J.J., Santos Jr., J.F.C. 2001, AJ, 122, 220
- Da Costa (1991) Da Costa, G.S. 1991, IAUS, 148, 183
- Da Costa (1999) Da Costa, G.S. 1999, IAUS, 190, 446
- Davies, Elliott & Meaburn (1976) Davies, R.D., Elliott, K.H. & Meaburn, J. 1976, MmRAS, 81, 89
- de Vaucouleurs (1948) de Vaucouleurs, G. 1948, Ann. Astrophys., 11, 247
- de Vaucouleurs & Freeman (1972) de Vaucouleurs, G. & Freeman, K.C. 1972, VA, 14, 163
- Dickel et al. (2001) Dickel, J.R., Williams, R.M., Carter, L.M., Milne, D.K., Petre, R. & Amy, S.W. 2001, AJ, 122, 849
- Dieball, Müller & Grebel (2002) Dieball, A., Müller, H. & Grebel, E.K. 2002, A&A, 391, 547
- Dottori et al. (1996) Dottori, H., Bica, E., Clariá, J.J. & Puerari, I. 1996, ApJ, 461, 742
- Dutra et al. (1999) Dutra, C.M., Bica, E., Clariá, J.J. & Piatti, A.E. 1999, MNRAS, 305, 373
- Ferreiro & Pastoriza (2004) Ferreiro, D.L. & Pastoriza, M.G. 2004, A&A, 428, 837
- Gieles et al. (2006) Gieles, M., Portegies Zwart, S.F., Baumgardt, H., Athanassoula, E., Lamers, H.J.G.L.M. Sipior, M. & Leenaarts, J. 2006, MNRAS, 371, 793
- Gouliermis et al. (2003) Gouliermis, D., Kontizas, M., Kontizas, E. & Korakitis, R. 2003, A&A, 405, 111
- Gouliermis, Quanz & Henning (2007) Gouliermis, D., Quanz, S.P. & Henning, T. 2007, ApJ, 665, 306
- Harris (1996) Harris, W.E. 1996, AJ, 112, 1487
- Hatzidimitriou et al. (2005) Hatzidimitriou, D., Stanimirovic, S., Maragoudaki, F., Staveley-Smith, L., Dapergolas, A. & Bratsolis, E. 2005, MNRAS, 360, 1171
- Henize (1956) Henize, K.G. 1956, ApJS, 2, 315
- Henize & Westerlund (1963) Henize, K.G. & Westerlund, B.E. 1963, ApJ, 137, 747
- Hennekemper et al. (2008) Hennekemper, E., Gouliermis, D.A., Henning, T., Brandner, W. & Dolphin, A.E. 2008, ApJ, 672, 914
- Heydari-Malayeri et al. (1999) Heydari-Malayeri, M., Charmandaris, V., Deharveng, L., Rosa, M.R. & Zinnecker, H. 1999, A&A, 347, 841
- Heydari-Malayeri et al. (2000) Heydari-Malayeri, M., Royer, P., Rauw, G. & Walborn, N.R. 2000, A&A, 361, 877
- Heydari-Malayeri et al. (2001) Heydari-Malayeri, M., Charmandaris, V., Deharveng, L., Rosa, M.R., Schaerer, D. & Zinnecker, H. 2001, A&A, 372, 527
- Heydari-Malayeri et al. (2002) Heydari-Malayeri, M., Charmandaris, V., Deharveng, L., Meynadier, F., Rosa, M.R., Schaerer, D. & Zinnecker, H. 2002, A&A, 381, 941
- Heydari-Malayeri, Meynadier & Walborn (2003) Heydari-Malayeri, M., Meynadier, F. & Walborn, N.R. 2003, A&A, 400, 923
- van der Heyden, Bleeker & Kaastra (2004) van der Heyden, K.J., Bleeker, J.A.M. & Kaastra, J. S. 2004, A&A, 421, 1031
- Hodge & Sexton (1966) Hodge, P.W. & Sexton, J.A. 1966, AJ, 71, 363
- Hodge (1985) Hodge, P. 1985, PASP, 97, 530
- Hodge (1986) Hodge, P. 1986, PASP, 98, 1113
- Kim et al. (1998) Kim, S., Staveley-Smith, L., Dopita, M.A., Freeman, K.C., Sault, R.J., Kesteven, M.J. & McConnell, D. 1998, ApJ, 503, 674
- Kim et al. (1999) Kim, S., Dopita, M.A., Staveley-Smith, L. & Bessell, M.S. 1999, AJ, 118, 2797
- King (1966) King, I. 1966, AJ, 71, 64
- Kontizas et al. (1990) Kontizas, M., Morgan, D.H., Hatzidimitriou, D. & Kontizas, E. 1990, A&AS, 84, 527
- Kron (1956) Kron, G.E. 1956, PASP, 68, 125
- Lazendic, Dickel & Jones (2003) Lazendic, J.S., Dickel, J.R. & Jones, P.A. 2003, ApJ, 596, 287
- Lindsay (1958) Lindsay, E.M. 1958, MNRAS, 118, 172
- Lindsay (1961) Lindsay, E.M. 1961, AJ, 66, 169
- Lucke & Hodge (1970) Lucke, P.B. & Hodge, P.W. 1970, AJ, 75, 171
- Lyngå & Westerlund (1963) Lyngå, G. & Westerlund, B.E. 1963, MNRAS, 127, 31
- Lyngå (1982) Lyngå, G. 1982, A&A, 109, 213
- Mackey & Gilmore (2003) Mackey, A. D. & Gilmore, G.F. 2003, MNRAS, 338, 85
- Mackey & Gilmore (2004) Mackey, A.D. & Gilmore, G.F. 2004, MNRAS, 352, 153
- Mackey, Payne & Gilmore (2006) Mackey, A.D., Payne, M.J. & Gilmore, G.F. 2006, MNRAS, 369, 921
- Meynadier, Heydari-Malayeri & Walborn (2005) Meynadier, F., Heydari-Malayeri, M. & Walborn, N.R. 2005, A&A, 436, 117
- Mighell, Sarajedini & French (1998) Mighell, K.J., Sarajedini, A. & French, R.S. 1998, AJ, 116, 2395
- Muller et al. (2003) Muller E., Staveley-Smith L., Zealey W. & Stanimirovic S. 2003, MNRAS, 339, 105
- Muller & Parker (2007) Muller, E. & Parker, Q.A. 2007, PASA, 24, 69
- Nakajima et al. (2005) Nakajima, Y., Kato, D., Nagata, T., Tamura, M., Sato, S., Sugitani, K., Nagashima, C., et al. 2005, AJ, 129, 776
- Nikolaev et al. (2004) Nikolaev, S., Drake, A.J., Keller, S.C., Cook, K.H., Dalal, N., Griest, K., Welch, D.L. & Kanbur, S.M. 2004, ApJ, 601, 260
- Nota et al. (2006) Nota, A., Sirianni, M., Sabbi, E., Tosi, M., Clampin, M., Gallagher, J., Meixner, M., Oey, M.S., Pasquali, A., Smith, L.J., and 2 coauthors 2006, ApJ, 640, 29
- Oey et al. (2003) Oey, M.S., Parker, J.S., Mikles, V.J. & Zhang, X. 2003, AJ, 126, 2317
- de Oliveira et al. (2000) de Oliveira, M.R., Dutra, C.M., Bica, E. & Dottori, H. 2000, A&AS, 146, 57
- Olsen & Salyk (2002) Olsen, K.A.G. & Salyk, C. 2002, AJ, 124, 2045
- Olszewski, Aaronson & Schommer (1987) Olszewski, E.W., Aaronson, M. & Schommer, R.A. 1987, AJ, 93, 565
- Piatti et al. (2001) Piatti, A.E., Santos Jr., J.F.C., Clariá, J.J., Bica, E., Sarajedini, A. & Geisler, D. 2001, MNRAS, 325, 792
- Piatti et al. (2002) Piatti, A.E., Sarajedini, A., Geisler, D., Bica, E. & Clariá, J.J. 2002, MNRAS, 329,556
- Piatti et al. (2005) Piatti, A.E., Sarajedini, A., Geisler, D., Seguel, J. & Clark, D. 2005, MNRAS, 358, 1215
- Piatti et al. (2007) Piatti, A.E., Sarajedini, A., Geisler, D., Gallart, C. & Wischnjewsky, M. 2007, MNRAS, 381, L84
- Pietrzynski et al. (1998) Pietrzynski, G., Udalski, A., Kubiak, M., Szymanski, M., Wozniak, P. & Zebrun, K. 1998, AcA, 48, 175
- Pietrzynski et al. (1999) Pietrzynski, G., Udalski, A., Kubiak, M., Szymanski, M., Wozniak, P. & Zebrun, K. 1999, AcA, 49, 521
- Pietrzynski & Udalski (1999) Pietrzynski, G. & Udalski, A. 1999, AcA, 49, 433
- Pietrzynski & Udalski (2000) Pietrzynski, G. & Udalski, A. 2000, AcA, 50, 355
- Reid et al. (2007) Reid, W.A., Payne, J.L., Filipovic, M.D., Danforth, C.W., Jones, P.A., White, G.L. & Staveley-Smith, L. 2007, MNRAS, 367, 1379
- Sabbi et al. (2007) Sabbi, E., Sirianni, M., Nota, A., Tosi, M., Gallagher, J., Meixner, M., Oey, M.S., Walterbos, R., Pasquali, A., Smith, L.J. & Angeretti, L. 2007, AJ, 133, 44
- Santiago et al. (1998) Santiago, B.X., Elson, R.A.W., Sigurdsson, S. & Gilmore, G.F. 1998, MNRAS, 295, 860
- Schaefer (2008) Schaefer, B.E. 2008, AJ, 135, 112
- Schmalzl et al. (2008) Schmalzl, M., Gouliermis, D., Dolphin, A.E. & Henning, T. 2008, ApJ, in press, (astro-ph/0804.0543)
- Shapley & Lindsay (1963) Shapley, H. & Lindsay, E. M. 1963, IrAJ, 6, 74
- Staveley-Smith et al. (1997) Staveley-Smith, L., Sault, R.J., Hatzidimitriou, D., Kesteven M.J. & McConnell, D. 1997, MNRAS, 289, 225
- Suntzeff et al. (1992) Suntzeff, N.B., Schommer, R.A., Olszewski, E.W. & Walker, A.R. 1992, AJ, 104, 1743
- Tadross et al. (2002) Tadross, A.L., Werner, P., Osman, A. & Marie, M. 2002, NewAst, 7, 553
- Testor, Llebaria & Debray (1988) Testor, G., Llebaria, A. & Debray, B. 1988, Msgr, 54, 43
- Testor et al. (2006) Testor, G., Lemaire, J.L., Field, D. & Diana, S. 2006, A&A, 453, 517
- Testor et al. (2007) Testor, G., Lemaire, J.L., Kristensen, L.E., Field, D. & Diana, S. 2007, A&A, 469, 459
- Udalski (2003) Udalski, A. 2003, Acta Astron., 53, 291
- van der Marel (2001) van der Marel, R.P. 2001, AJ, 122, 1827
- Walborn & Blades (1997) Walborn, N.R. & Blades, C.J. 1997, ApJSS, 112, 457
- Walborn et al. (1999a) Walborn, N.R., Barbá, R.H., Brandner, W., Rubio, M., Grebel, E.K. & Probst, R.G. 1999a, AJ, 117, 225
- Walborn et al. (1999b) Walborn, N.R., Drissen, L., Parker, J.W., Saha, A., MacKenty, J.W.& White, R.L. 1999b, AJ, 118,
- Walborn, Maíz-Apellániz & Barbá (2002) Walborn, N.R., Maíz-Apellániz, J. & Barbá, R.H. 2002, AJ, 124, 1601
- Westerlund & Henize (1963) Westerlund, B.E. & Henize, K.G. 1963, PASP, 75, 332
- Westerlund (1990) Westerlund, B.E. 1990, A&ARv, 2, 29
- Williams, Chu & Gruendl (2006) Williams, R.M., Chu, Y.-H. & Gruendl, R. 2006, AJ, 132, 1877