Q. He
J. Insler
H. Muramatsu
C. S. Park
E. H. Thorndike
F. Yang
University of Rochester, Rochester, New York 14627, USA
M. Artuso
S. Blusk
S. Khalil
J. Li
R. Mountain
S. Nisar
K. Randrianarivony
N. Sultana
T. Skwarnicki
S. Stone
J. C. Wang
L. M. Zhang
Syracuse University, Syracuse, New York 13244, USA
G. Bonvicini
D. Cinabro
M. Dubrovin
A. Lincoln
Wayne State University, Detroit, Michigan 48202, USA
P. Naik
J. Rademacker
University of Bristol, Bristol BS8 1TL, UK
D. M. Asner
K. W. Edwards
J. Reed
Carleton University, Ottawa, Ontario, Canada K1S 5B6
R. A. Briere
T. Ferguson
G. Tatishvili
H. Vogel
M. E. Watkins
Carnegie Mellon University, Pittsburgh, Pennsylvania 15213, USA
J. L. Rosner
Enrico Fermi Institute, University of
Chicago, Chicago, Illinois 60637, USA
J. P. Alexander
D. G. Cassel
J. E. Duboscq111DeceasedR. Ehrlich
L. Fields
R. S. Galik
L. Gibbons
R. Gray
S. W. Gray
D. L. Hartill
B. K. Heltsley
D. Hertz
J. M. Hunt
J. Kandaswamy
D. L. Kreinick
V. E. Kuznetsov
J. Ledoux
H. Mahlke-Krüger
D. Mohapatra
P. U. E. Onyisi
J. R. Patterson
D. Peterson
D. Riley
A. Ryd
A. J. Sadoff
X. Shi
S. Stroiney
W. M. Sun
T. Wilksen
Cornell University, Ithaca, New York 14853, USA
S. B. Athar
R. Patel
J. Yelton
University of Florida, Gainesville, Florida 32611, USA
P. Rubin
George Mason University, Fairfax, Virginia 22030, USA
B. I. Eisenstein
I. Karliner
S. Mehrabyan
N. Lowrey
M. Selen
E. J. White
J. Wiss
University of Illinois, Urbana-Champaign, Illinois 61801, USA
R. E. Mitchell
M. R. Shepherd
Indiana University, Bloomington, Indiana 47405, USA
D. Besson
University of Kansas, Lawrence, Kansas 66045, USA
T. K. Pedlar
J. V. Xavier
Luther College, Decorah, Iowa 52101, USA
D. Cronin-Hennessy
K. Y. Gao
J. Hietala
Y. Kubota
T. Klein
B. W. Lang
R. Poling
A. W. Scott
P. Zweber
University of Minnesota, Minneapolis, Minnesota 55455, USA
S. Dobbs
Z. Metreveli
K. K. Seth
A. Tomaradze
Northwestern University, Evanston, Illinois 60208, USA
J. Libby
L. Martin
A. Powell
G. Wilkinson
University of Oxford, Oxford OX1 3RH, UK
K. M. Ecklund
State University of New York at Buffalo, Buffalo, New York 14260, USA
W. Love
V. Savinov
University of Pittsburgh, Pittsburgh, Pennsylvania 15260, USA
H. Mendez
University of Puerto Rico, Mayaguez, Puerto Rico 00681
J. Y. Ge
D. H. Miller
I. P. J. Shipsey
B. Xin
Purdue University, West Lafayette, Indiana 47907, USA
G. S. Adams
M. Anderson
J. P. Cummings
I. Danko
D. Hu
B. Moziak
J. Napolitano
Rensselaer Polytechnic Institute, Troy, New York 12180, USA
(June 17, 2008)
Abstract
We report the first observation of , with branching fraction and statistical significance . Data were acquired with the CLEO III detector at the CESR
symmetric collider. This is the first process observed involving
a -quark spin flip. For related transitions, 90% confidence
limits in units of are
,
,
,
and .
pacs:
14.40.Gx, 13.25.Gv
††preprint: CLNS 08/2031††preprint: CLEO 08-14
In order to produce a pseudoscalar meson or in transitions, the pair must emit either
two M1 (chromomagnetic dipole) gluons or an E1 (chromoelectric dipole) and an
M2 (chromomagnetic quadrupole) gluon Yan:1980 ; Kuang:2006me ; Voloshin:2007dx , involving the flip of a heavy quark’s spin.
In this Letter we present the first observation of , and a search for similar or transitions from the
and . A spin-flip of a -quark can shed light
on its chromomagnetic moment, expected to scale as . Electromagnetic
transitions involving a -quark spin-flip should also have amplitudes scaling
as . They have not previously been observed.
The decay was observed in the early days of
charmonium spectroscopy Tanenbaum:1975gz . Its branching fraction is
PDG , while only an
upper limit is known for the corresponding
process CUSB2Seta1S . The upper
limit for is
Brock91 . The quark spin-flip involved in transitions (we consider )
and the -wave nature of the final state imply that
rates should scale from charmonium as
Yan:1980 ; Kuang:2006me , where is the three-momentum of the
or in the center-of-mass system and is the
heavy quark. Hence one expects
(1)
leading to . Direct calculation in a potential model Kuang:2006me yields
for these branching fractions. All predictions
involve a perturbative calculation of gluon-pair emission followed by a
nonperturbative estimate of materialization of the gluon pair into an .
Uncertainties associated with this estimate are difficult to quantify.
Similar predictions can be made for transitions under the assumption
that they are due to an isospin-zero admixture in the . The
isospin-forbidden decay has been seen
PDG with a branching fraction of
which is
of that for . Using values
of appropriate to each process and assuming the same isospin-zero
admixture in governs the transitions , one obtains the scaling predictions
(2)
There is no prediction at present for the kinematically-allowed decay
.
The data in the present analysis were collected in collisions at the
Cornell Electron Storage Ring (CESR), at center-of-mass energies at and about
30 MeV below the resonances. Integrated
luminosities at these resonances were (1.3,1.4) fb-1, amounting to
million decays of
, as in the analysis of Ref. number .
Events were recorded in the CLEO III detector, equipped with an electromagnetic
calorimeter consisting of 7784 CsI(Tl) crystals and covering 93% of solid
angle, initially installed in the CLEO II CLEO2 detector configuration.
The energy resolution of the crystal calorimeter is 5% (2.2%) for 0.1 (1) GeV
photons. The CLEO III tracking system CLEO3trk consists of a
silicon strip detector and a large drift chamber, achieving a charged particle
momentum resolution of 0.35% (1%) at 1 (5) GeV/ in a 1.5 T axial
magnetic field.
We look for candidate events of the form with , where . Candidates for are identified by picking the
two highest-momentum tracks in an event and demanding them to be of opposite
sign. We explore separate and samples in
decays by defining electron candidates to have a high ratio of energy
observed in the calorimeter to momentum measured in the tracking system,
i.e., , and muon candidates to have .
We choose lepton candidates from tracks satisfying ,
where is the angle with respect to the positron beam direction, to
avoid a region of less uniform acceptance at larger . With
these criteria we achieve a very clean separation of electron and muon
candidates. In order to suppress contributions from Bhabha scattering, we
demand for events with that candidates
satisfy . This greatly suppresses Bhabha scattering
background while keeping 93% of the signal. Once leptons are identified, the
entire event is kinematically fitted. We reconstruct the
candidates from their decays to , ,
and . We did not employ the decay mode
because of its small branching fraction ( PDG )
and large backgrounds,
primarily from .
Photon candidates must be detected in the central region of the
calorimeter (), must not be aligned with the initial
momentum of a track, and should have a lateral shower profile consistent with
that of a photon. Neutral pion candidates (except in the decay , where we only look for six photon candidates) are reconstructed from
a pair of candidates
required to have invariant mass between 120 and 150 MeV.
Monte Carlo (MC) samples were generated for generic decays
using the routine QQQQ , and for and dipion transitions between states using the
package EvtGenLange:2001uf . The final state was
taken to decay to or . A Geant-based
GEANT
detector simulation was used. These samples, as well as off-resonance
data, are useful both for validating background suppression
methods and as possible background sources. In calculating branching fractions
from data, we take PDG and Adams:2004xa based
on the
more accurately measured branching fractions and assuming lepton
universality.
The MC samples were generated with
and decaying through all known decay modes. These decays
proceed via a -wave, and hence are described by a matrix element
in the nonrelativistic limit (here ∗ denotes complex conjugation),
with f,i the polarization vectors of the final and
initial . The distribution for the final-state leptons in
then is , and
was used in all signal MC samples for . For it was assumed
that the retains the polarization of the initial ,
so the lepton angular distribution for is
.
As a cross-check, data were analyzed for the known transitions , and branching fractions were found in sufficiently good
agreement with world averages PDG . We looked for systematic differences
between detection of and . Efficiencies for the two modes can differ as a result of the
requirement on mentioned above. The branching fractions
calculated from and
were found to be equal within statistical uncertainty, and consistent with
those obtained from recoil mass spectra without requiring final leptons.
Kinematic fitting was used to study the decays . The two tracks selected as leptons, including photon
bremsstrahlung candidates within 100 mrad of the initial lepton direction,
were constrained to have the known masses of with a resultant
reduced (),
required to be less
than 10. (For off-resonance data the dilepton masses were reduced by an amount
equal to the initial minus the off-resonance center-of-mass
energy.) The sum of the four-momenta of these two fitted tracks, including
photon bremsstrahlung candidates as well as the decay products of the
, were further constrained to the initial
four-momentum, with a reduced
required to be
less than 10, or 3 for to help suppress doubly
radiative Bhabha events. Some of these Bhabha events can give small
fitted , but have photon momenta shifted by relatively
large
amounts compared to signal events. To further suppress such events, two-photon
“pull” masses,
defined as (fitted–measured)/, where is the two-photon mass
resolution, were chosen on the basis of signal MC and off-resonance data
(containing the doubly radiative Bhabha contribution) to lie between –2 and 3.
Over 99% of the signal MC events for all transitions satisfy this
criterion. All particles were also required to have common vertices in the
above two constrained fits, with reduced
required for the dilepton vertex, and reduced
required for the full event vertex.
For , the photons from
have energies MeV, where is the angle between the photon in the
center-of-mass and the boost, so MeV.
Choosing MeV then eliminates background from
with little
effect on the signal.
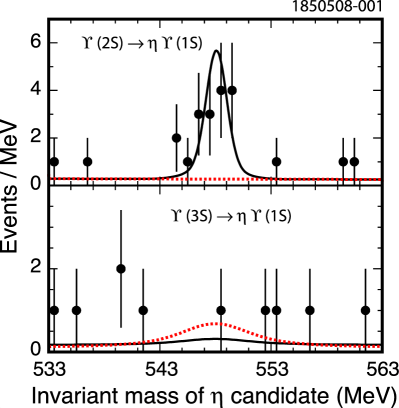
Using the MC sample, the candidate
mass distribution was fitted to the sum of a double Gaussian and a linear
background. Constant background gave a
worse fit because of the
kinematic limit at MeV. The fitting
range was chosen to be 533 to 563 MeV: roughly symmetric about the peak
( MeV PDG ) with upper boundary at
above which few events are expected or
observed. The difference between fits with linear and flat backgrounds was
found to be insignificant compared with the systematic error associated with
fitting range. The double Gaussian parameters
included a narrow width MeV, a wide width
MeV, area of second peak 20% of total, and mean of second peak 0.14 MeV
below the first.
The mass distribution for the sum of the modes ,
, and in data (upper plot, Fig. 1) shows a clear peak near . We fit data
points to the sum of the double Gaussian with floating area but fixed shape
obtained from signal MC and a linear background. The and
decay modes each contribute two events near the peak and none
elsewhere. The combined fitted peak corresponds to a branching fraction
.
Defining the significance as , where
is the likelihood, the difference between fits with and without
signal yields a statistical significance of 5.3 standard deviations.
Figure 1: Events per MeV vs. invariant mass of candidates for (top) and (bottom).
The sum of the modes , ,
and is shown. In the top figure the solid curve corresponds
to the total fit, involving a signal of events above
background (dashed line). In the bottom figure the solid curve corresponds to
a best fit with signal MC shape, while the dotted curve corresponds to a 90%
confidence level (CL) upper limit.
In searching for
transitions, we suppress backgrounds from cascades involving intermediate
states by requiring one photon to have MeV and the other to have MeV.
Signal photons satisfy , so
about 2/3 of them are retained by these choices. Small differences with
respect to include (a) an fit range
523–573 MeV
and (b) a flat background, found here to be sufficient to describe
MC and data. The best fit to signal MC shape and the 90% confidence level
(CL) upper limit are shown in the lower plot of Fig. 1.
(No events were observed in the
regions included in the fit but not shown in Fig. 1.)
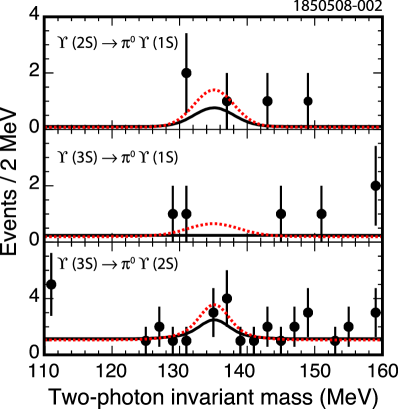
For , the photons from have energies
MeV, so MeV.
The choice MeV for both photons, made to
eliminate background from , then retains about 30% of the signal.
A fit of the
distribution in the data (using the signal MC
double-Gaussian shape and uniform background) is shown in the top plot of
Fig. 2. Details of this and other limits, as well as of the
signal, are shown in Table I.
For all transitions, MC simulations indicate a constant function is
adequate to describe the background.
Efficiency differences between decay modes are typically due to
details of photon acceptance.
Figure 2: Best fits to two-photon invariant mass distributions with signal MC
shapes (solid curves are the results of total fits) and 90% CL upper limits
(dotted curves) for
(top), (middle), and (bottom).
For , where signal photons from satisfy ,
the same ranges of are chosen as for . For , we
suppress backgrounds from cascades involving intermediate states
by excluding photons with MeV and MeV. Here, the signal photons satisfy , so about 40% are retained. No signal is seen in any of
these transitions (Fig. 2).
Table I: Efficiencies, events in data, and product branching fractions , where ,
and or .
Efficiencies are based on MC samples generated with standard and
branching fractions and with . Decays involving are based on combined , , and modes.
Decay
MC %
Events
detected
in data
()
14.0
6.8
10.4
13.2
7.8
Systematic errors are shown in Table II. Other contributions
investigated and found to be negligible were (i) cross feeds among
modes, (ii) signal shape, (iii) background shape, (iv) triggering details,
and (v) differences in reconstruction.
The dominant sources of systematic uncertainties are described below.
1. Bhabha event suppression: Uncertainties for all processes will arise
from our Bhabha event suppression requirement. Although it is applied only to
modes, it will affect not only transitions but also
those with , whose decays dominate our analyses
statistically. To probe this uncertainty,
we consider the separate sample of those events with which were removed by the Bhabha suppression requirement. The resultant
is consistent
with our nominal result. Averaging the two gives a deviation of 9% which we
take as a possible systematic uncertainty due to this requirement.
We then propagate this estimated
uncertainty to the rest of the decay modes with suitable weight for the
fraction of the decay due to .
2. Kinematic fitting: To probe any systematic bias
introduced by our kinematic fitting procedure, we look at events with
very similar topology to our signals: ,
,
where or . We use the same analysis requirements as for
but relax the requirements on in
order to accept two-photon cascades through states. Varying
the requirement on from none to
, we observe a maximum deviation
of 7% in this product of branching fractions which we
assign as a possible source of systematic uncertainty.
Table II: Systematic errors, in percent, on branching fractions for
(a) ; (b) ; (c)
. All errors are assigned symmetrically. Decays involving
are based on combined , , and
modes.
The last line (d) includes systematic errors.
Decay
Final state
(a)
(b)
(a)
(b)
(c)
Tracks
2
2
2
2
2
Number of
1.5
1.5
1.7
1.7
1.7
recon.
6
5
8
5
5
2
2
2
2
4
pull mass
4
0
4
0
0
Bhabha event sup.
7
9
6
9
9
Fit range
1
1
8
6
4
cuts
7
7
7
7
7
MC stat.
1.1
1.6
1.3
1.1
1.5
Quad. sum
13
13
16
14
14
(d)
0.3
3. reconstruction: We assign 5% per
or decaying into two photons based on
CLEO studies pi0syst .
4. Fit ranges: Uncertainties due to fit ranges differ
for different final states.
To estimate them, we prepare many MC samples in which points are randomly
scattered around best-fit values from data (signal plus background),
bin-by-bin according to a Poisson distribution.
We then fit them with the
fit range boundaries symmetrically changed by MeV
for .
In as well as in
,
where wider kinematic ranges are available,
the fit range boundaries are symmetrically changed by MeV.
We assign variations of averages of these fitted yields as
possible systematic shifts.
Combining the effects from the systematic errors linearly with the results
already listed, we find the results shown in the last line of
Table II.
To summarize, we have observed for the first time a process involving -quark
spin-flip, with
. The statistical significance of the signal is 5.3
. The result is about 1/4 of the value one would predict on the basis
of Eq. (1), indicating either a shortcoming in the description of
two-gluon hadronization into an or a fundamental suppression of the
chromomagnetic moment of the quark. In addition, we have set 90% CL
upper limits on other pseudoscalar transitions summarized on the bottom line of
Table II. The limit
on is about a factor of two below
that predicted from Eq. (1), while the limits on the transitions
are consistent with the estimates of
Eq. (2).
We gratefully acknowledge the effort of the CESR staff in providing us with
excellent luminosity and running conditions. This work was supported by the
A. P. Sloan Foundation, the National Science Foundation, the U. S. Department
of Energy, the Natural Sciences and Engineering Research Council of Canada, and
the U. K. Science and Technology Facilities Council.
References
(1) T.-M. Yan, Phys. Rev. D 22, 1652 (1980).
(2) Y. P. Kuang,
Front. Phys. China 1, 19 (2006).
(3) M. B. Voloshin, Prog. Part. Nucl. Phys. 61, 455 (2008).
(4)
W. M. Tanenbaum et al. [Mark-I Collaboration],
Phys. Rev. Lett. 36, 402 (1976).
(5) W.-M. Yao et al. [Particle Data Group], J. Phys. G
33, 1 (2006) and 2007 partial update for 2008.
(6) V. Fonseca et al. [CUSB Collaboration], Nucl. Phys. B 242, 31 (1984).
(7) I. C. Brock et al. [CLEO Collaboration], Phys. Rev. D 43, 1448 (1991).
(8) M. Artuso et al.
[CLEO Collaboration], Phys. Rev. Lett. 94, 032001 (2005).
(9)
Y. Kubota et al. [CLEO Collaboration],
Nucl. Instrum. Meth. A 320, 66 (1992).
(10) D. Peterson et al. [CLEO Collaboration],
Nucl. Instrum. Meth. A 478, 142 (2002).
(11) “QQ – The CLEO Event Generator,”
http://www.lns.cornell.edu/public/CLEO/soft/QQ (unpublished).
(12) D. J. Lange,
Nucl. Instrum. Meth. A 462, 152 (2001).
(13)
R. Brun et al.Geant 3.21, CERN Program Library Long Writeup
W5013 (1993), unpublished.
(14)
G. S. Adams et al. [CLEO Collaboration],
Phys. Rev. Lett. 94, 012001 (2005).
(15)
S. A. Dytman et al. [CLEO Collaboration],
arXiv:hep-ex/0307035, as quoted in S. B. Athar et al. [CLEO Collaboration],
Phys. Rev. D 76, 072003 (2007).