Thermal Emission from Warm Dust in the Most Distant Quasars
Abstract
We report new continuum observations of fourteen z6 quasars at 250 GHz and fourteen quasars at 1.4 GHz. We summarize all recent millimeter and radio observations of the sample of the thirty-three quasars known with , and present a study of the rest frame far-infrared (FIR) properties of this sample. These quasars were observed with the Max Plank Millimeter Bolometer Array (MAMBO) at 250 GHz with mJy sensitivity, and of them were detected. We also recover the average 250 GHz flux density of the MAMBO undetected sources at , by stacking the on-source measurements. The derived mean radio-to-UV spectral energy distributions (SEDs) of the full sample and the 250 GHz non-detections show no significant difference from that of lower-redshift optical quasars. Obvious FIR excesses are seen in the individual SEDs of the strong 250 GHz detections, with FIR-to-radio emission ratios consistent with that of typical star forming galaxies. Most 250 GHz-detected sources follow the – relationship derived from a sample of local IR luminous quasars (), while the average ratio of the non-detections is consistent with that of the optically-selected PG quasars. The MAMBO detections also tend to have weaker emission than the non-detected sources. We discuss possible FIR dust heating sources, and critically assess the possibility of active star formation in the host galaxies of the z6 quasars. The average star formation rate of the MAMBO non-detections is likely to be less than a few hundred , but in the strong detections, the host galaxy star formation is probably at a rate of , which dominates the FIR dust heating.
1 Introduction
More than thirty quasars at z6 have been discovered (e.g., Fan et al. 2000, 2001a, 2003, 2004, 2006a; Jiang et al. 2007a; Willott et al. 2007). These objects are the earliest massive black hole accretion systems known (Jiang et al. 2006; 2007b), seen at an epoch close to the end of cosmic reionization (Fan et al. 2006b). They provide us with unique information on both the growth of supermassive black holes (SMBHs) and the formation of massive galaxies when the age of the universe was .
There are fundamental relationships between SMBH mass and bulge stellar mass/velocity dispersion in the local universe (e.g., Tremaine et al. 2002; Marconi & Hunt 2003; Hopkins et al. 2007), indicating that the formation of SMBHs and their spheroidal hosts are coupled. Active galactic nuclei (AGNs) buried in dusty starburst environments have been discovered in samples of low redshift ultraluminous infrared galaxies (ULIRGs), which are believed to be a transition phase between starburst mergers and typical optically bright AGNs (Sanders et al. 1988; Wu et al. 1998; Zheng et al. 2002). Studies of large samples of galaxies and AGNs also provide clues about the ’downsizing’ process in galaxy and SMBH formation, whereby the formation of the most massive systems occur at early epochs (Cowie et al. 1996; Heckman et al. 2004; Kauffmann & Heckman 2005).
Examples of massive quasars hosted by interacting systems or bright submillimeter galaxies have been found at redshifts greater than 4, such as BR 1202-0725 at z=4.7 and BRI1335-0417 at z=4.4 (Omont et al. 1996a, 1996b; Benford et al. 1999; Beelen et al. 2006). These objects are all characterized by strong molecular CO line emission (Guilloteau et al. 1997, 1999; Carilli et al. 2002; Solomon & Vanden Bout 2005; Riechers et al. 2006) and FIR (Guilloteau et al. 1999) and radio (Momjian et al. 2005, 2007) emission originating from a starburst, with implied star formation rates of a few thousand . The results suggest that the galaxies are at an earlier evolution stage than are typical optically bright quasars in which the central AGN dominates the emission from X-ray to radio.
These studies have been extended to z6 quasar sample with sensitive submillimeter, millimeter, and radio telescopes (Priddey et al. 2003b; Bertoldi et al. 2003; Petric et al. 2003; Carilli et al. 2004; Wang et al. 2007). About 1/3 of these z6 quasars were detected at millimeter wavelengths, at mJy sensitivity (Priddey et al. 2003b; Wang et al. 2007). The millimeter detections imply FIR luminosities of and dust masses of in the quasar host galaxies (Bertoldi et al. 2003a, Beelen et al. 2006). Such huge dust masses require rapid metal and dust enrichment via a starburst in the early evolution of these galaxies (Bertoldi et al. 2003a; Walter et al. 2003; Venkatesan et al. 2006; Li et al. 2007b; Dwek et al. 2007).
The heating sources of the FIR-emitting dust in the quasar systems at z6 have become a key question. The reprocessed emission from star formation-heated dust can provide a direct estimate of the star formation rate, thus constraining the bulge building stage in these quasar hosts. Observations at submillimeter wavelengths imply that the FIR emission in the two sources with the strongest millimeter detections, SDSS J114816.64+525150.3 at z=6.42 (hereafter J1148+5251) and SDSS J092721.82+200123.7 at z=5.77 (hereafter J0927+2001), is from dust components with temperatures of 50 to 60 K (Beelen et al. 2006; Wang et al. 2008a). Large amounts of highly excited molecular CO were also detected in the host galaxies of these two sources (Bertoldi et al. 2003b; Walter et al. 2003; Carilli et al. 2007), as well as strong [C II] 158m ISM gas cooling line emission in J1148+5251 (Maiolino et al. 2005). These results suggest that star formation plays an important role in the heating of FIR-emitting warm dust. The implied star formation rate is , which argues for active bulge building in these two z6 quasars.
We have a long standing program to study the dust and gas emission from the z6 quasars (e.g., Wang et al. 2007, 2008a). In this paper, we report new observations and present an FIR emission study of the full sample of thirty-three z6 quasars discovered to date, aiming (i) to give a general view of the FIR emission properties of the sample, and (ii) to further constrain the dust heating and star forming activity in the quasar hosts. We describe the full quasar sample, the new observations, and summarize the current millimeter and radio results in section 2. The analysis of the full sample is given in Sections 3, 4, and 5. We present a discussion of star formation in Section 6, and give a brief summary in Section 7. We adopt a -model cosmology with , and throughout this paper (Spergel et al. 2007).
2 Sample and observations
2.1 The sample of z6 quasars
Thirty-three quasars have been discovered at z6 (, see Table 1 and 2). Twenty-two of these objects were selected from 8000 deg2 of the Sloan Digital Sky Survey (SDSS, York et al. 2000) imaging data (Fan et al. 2000, 2001a, 2003, 2004, 2006a, 2008, in prep.; Goto 2006). These objects typically have rest frame AB magnitudes . The SDSS imaging survey is using a dedicated 2.5m telescope and a large format CCD camera (Gunn et al. 2006) at the Apache Point Observatory in New Mexico to obtain images in five broad bands (, , , and , centered at 3551, 4686, 6166, 7480 and 8932 , respectively; Fukugita et al. 1996) of high Galactic latitude sky in the Northern Galactic Cap. The imaging data are processed by the astrometric pipeline (Pier et al. 2003) and photometric pipeline (Lupton et al. 2001), resulting in astrometric calibration errors of rms per coordinate, and photometric calibration to better than 0.03 mag (Hogg et al. 2001, Smith et al. 2002, Ivezić et al. 2004, Tucker et al. 2006). These data have been made available to the public in a series of data releases (EDR: Stoughton et al. 2002; DR1 – DR6: Abazajian et al. 2003, 2004, 2005, Adelman-McCarthy et al. 2006, 2007, 2008).
Five additional z6 quasars were discovered in the SDSS Deep Equatorial Stripe (’Stripe 82’) by Jiang et al. (2007a). These five sources were selected from deep optical imaging of 260 deg2. These objects are about one magnitude fainter in the optical (i.e., ) than the primary SDSS sample. One source in this sample, J020332.39+001229.3 (hereafter J0203+0012), was also independently discovered in the UKIRT Infrared Deep Sky Survey (Venemans et al. 2007).
Four new quasars at have been published (Willott et al. 2007) from the Canada-France High-z Quasar Survey (CFHQS). These quasars were selected from imaging of 400 deg2; three of them have . The fourth source, CFHQS J1509-1749, is comparable in brightness to the faintest source in the primary SDSS sample, but the optical spectrum is much steeper than that of the typical quasars, indicating significant dust reddening.
Another two z6 quasars were discovered in the NOAO Deep Wide-Field Survey (Jannuzi et al. 2004) using optical, infrared, and radio data (McGreer et al. 2006; Cool et al. 2006). One of them, J1427+3312 at z=6.12, was selected by McGreer et al. (2006) from 4 deg2 by matching infrared and radio sources to optical counterparts. It is the brightest radio source in the z6 quasar sample. The UV to optical spectrum of this object is likely to be reddened by dust, and the rest frame magnitude derived from near-infrared data is 111derived from the absolute magnitude of presented in McGreen et al. (2006). The other quasar was infrared selected from Spitzer mid-infrared data, and identified in the AGN and Galaxy Evolution Survey (Cool et al. 2006) with .
2.2 New observations
Twenty-two sources in the z6 quasar sample have published 250 GHz continuum observations with the Max-Planck Millimeter Bolometer Array (MAMBO, Kreysa et al. 1998) on the IRAM 30-m telescope (Bertoldi et al. 2003a; Petric et al. 2003; Wang et al. 2007; Willott et al. 2007; Priddey et al. 2008), and nineteen sources in the sample have published 1.4 GHz continuum observations with the VLA (Petric et al. 2003; Carilli et al. 2004; Wang et al. 2007; McGreer et al. 2006). We report our new MAMBO and VLA observations of totally nineteen z6 quasars in this paper. These sources are unobserved or marginally detected in the previous observations, and we present new data for them at either 250 GHz or 1.4 GHz. We describe the new observations below and list the measurements for the nineteen quasars in Table 1. We also summarise the previous observations for other z6 quasars in Table 2.
We present new 250 GHz observations for fourteen z6 quasars, including eleven sources that have never been previously observed. The new observations have been obtained with the MAMBO-II 117-element array in Winter 2006-2007, we adopted the same observing mode as was used in the previous observations (Wang et al. 2007), i.e., doing chopping photometry at 2 Hz with throw in azimuth. We typically spent 1-3 hours on each source to achieve the sub-mJy rms noise level reached in previous observations. The data were reduced with the standard MOPSIC pipeline (Zylka 1998). Three sources, J1044-0125, J1425+3254, and J2054-0005, were detected from the new data at level. The MAMBO detection of J1044-0125 was recently reported in Priddey et al. (2008) from an independent observation with a 250 GHz flux density of . We observed this source down to a lower rms noise level, and our result, , is a bit lower compared to the value in Priddey et al. (2008) but consistent within the error limits (see Table 1). By including the data from the new observations, we also confirmed the previous detection in the source J0818+1722 (Wang et al. 2007) with a lower rms of 0.4 mJy.
New 1.4 GHz data were obtained with the VLA for fourteen quasars, including thirteen previously unobserved sources and a published marginally detected source, J0927+2001 (, Wang et al. 2007). The new observations were carried out in 2006 and 2007 with the array in the A or B configurations, down to an rms noise level of for most of the sources. There is a 1 Jy source in the field of the quasar J0303-0019, leading to a high rms of in the image. All the data were reduced using AIPS. One source, J0203+0012, was detected by our new observation with a 1.4 GHz flux density of , and the previous detection of J0927+2001 was confirmed at level.
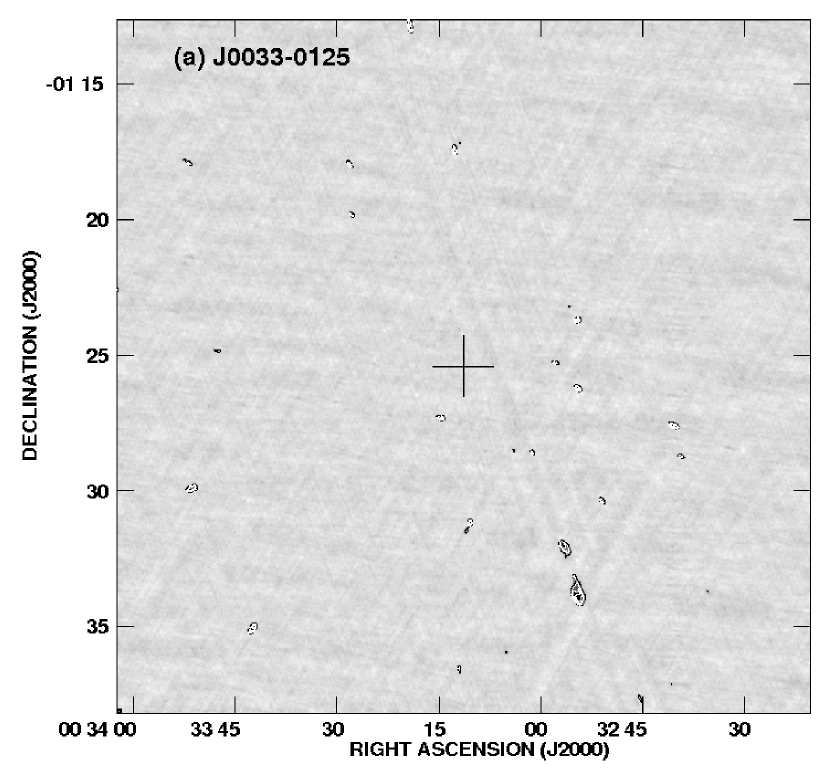
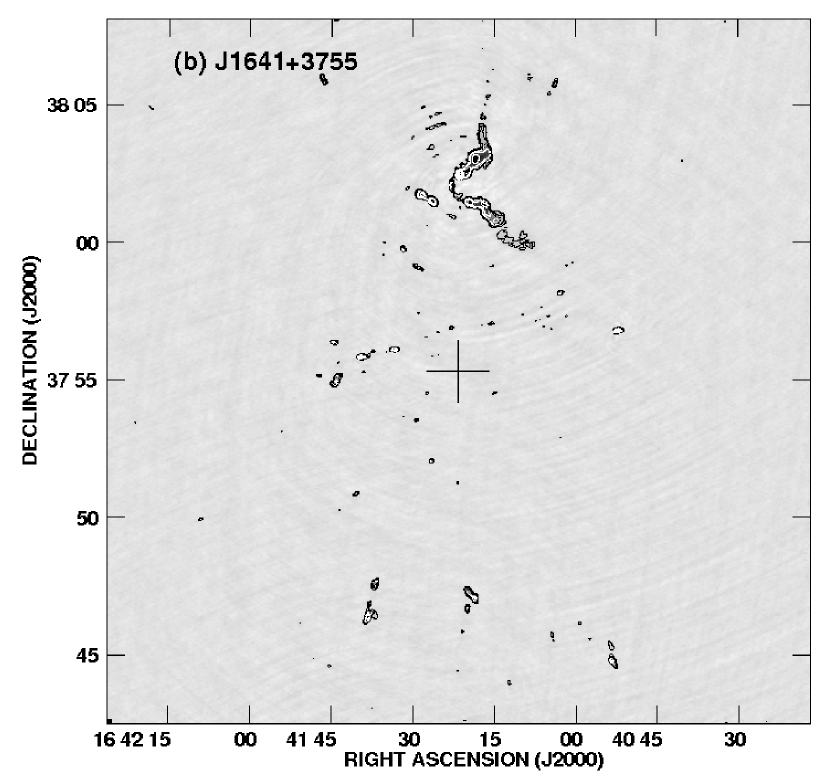
There are fairly bright and extended radio sources in the 1.4 GHz field images of the CFHQS quasars J0033-0125 and J1641+3755 (Figure 1), though these two quasars are not detected. One double-lobe radio source is found about away from the optical position of the quasar J0033-0125, with integrated 1.4 GHz flux density of . This radio source was also detected in the NVSS survey (Condon et al. 1998) and FIRST survey (White et al. 1997), and there is no published deep optical data for this area yet. Five radio sources with integrated flux densities are seen in the field of the source J1641+3755, including extended double radio sources, within 10′ from the optical quasar position. According to the FIRST 1.4 GHz source counts (White et al. 1997), about 1.6 source with is expected within this amount of sky area. The brightest radio source in the field of J1641+3755 was identified as a radio-loud AGN with a spectroscopic redshift of z=0.162 (Best et al. 2005). Further optical imaging and spectrography will address the question of whether the bright radio sources in the fields of the two CFHQS quasars is due to foreground galaxy clusters. We notice that bright extended radio sources and overdensities were previously reported in the 1.4 GHz observations of the two SDSS z6 quasars J1030+0524 and J1148+5251 (Petric et al. 2003; Carilli et al. 2004). Carilli et al. (2004) investigated the SDSS data of the J1148+5251 field, and however, there is no evidence for dense foreground clusters or gravitational lensing.
2.3 Summary of the millimeter and radio results
In summary, all the thirty-three source in the z6 quasar sample have been observed by MAMBO at 250 GHz. The observations have rms values in the range of with a median value of about , and ten sources are detected (see Table 1 and 2). This yields a detection rate of which is consistent with the submillimeter and millimeter detection rates of optically bright quasars at redshifts 2 and 4 (Priddey et al. 2003a; Omont et al. 2001; 2003; Carilli et al. 2001).
Thirty-two z6 quasars have 1.4 GHz radio continuum observations by the VLA, with a median rms level of , Ten out of the thirty-two sources have been detected, including four 250 GHz detections (see Table 1 and 2). Two of the radio detections, J0836+0054 and J1427+3312, have flux densities . These two sources, together with the new radio detection J0203+0012, have radio loudness222The and 5 GHz flux densities are derived from the 1450 magnitude and the observed 1.4 GHz flux density, assuming power law spectra indices of -0.5 in the optical and -0.75 in the radio, respectively. , and hence are radio loud according to the definition by Kellermann et al. (1989).
Data at other wavelengths for the analysis in this paper were collected from the literature, including optical data from the original papers (Fan et al. 2000; 2001a; 2003; 2004; 2006a; 2008, in prep; Goto 2006; McGreer et al. 2006; Willott et al. 2007; Jiang et al. 2008), near-infrared data from Jiang et al. (2006), submillimeter data from Priddey et al. (2003b), Robson et al. (2004) and Beleen et al. (2006), and the millimeter continuum data from the PdBI CO observations (Carilli et al. 2007; Wang et al. 2008b, in prep.).
3 The UV-to-radio SEDs of the z6 quasars
Using the 250 GHz and 1.4 GHz continuum measurements,
we derive the average FIR and radio emission of these
z6 quasars and compare it to the typical
quasars at low redshift. The calculations
are performed for three groups: (I) the whole
sample of thirty-three sources, (II) the subsample of
ten sources detected with MAMBO at , and
(III) the subsample of twenty-three sources not detected with MAMBO.
Using the MAMBO 250GHz data, we calculate the weighted
average 250GHz flux densities for each group, namely:
| (1) |
| (2) |
| (3) |
where is the MAMBO observed flux density for each source, and is the rms. For the calculation of of the whole sample and the subsample of 250 GHz non-detections, we weighed the data by (equation (2)). However, equal weights were adopted (i.e. ) when calculate for the 250 GHz detections, as the observed rms values spread in a smaller range (0.360.75 mJy) and we do not want to bias the average toward the weakest sources. The average flux density ratios between 250GHz and the rest frame 1450 are then calculated as , where the average 1450 flux density is derived from the AB magnitudes presented in the discovering papers (see Section 2.1). The average radio emission and 1.4GHz-to-1450 ratios for each group are calculated using the same method.
The average FIR luminosities (42.5m – 122.5m, rest frame) for each group can be estimated333A typical redshift value of z=6 is adopted here as , assuming a dust temperature of 47 K and an emissivity index of 1.6 (Beelen et al. 2006). Based on this estimation, the mean FIR-to-radio ratios for each group can be calculated as (Helou et al. 1985):
| (4) |
The rest-frame 1.4 GHz radio luminosity densities () are derived with the average radio flux densities, assuming a power-law radio spectrum of (Condon 1992). The q values can be increased by 0.2 if we assume a flater radio spectrum of . The mean flux densities, luminosities, and q values are listed in Table 3. We exclude the three radio loud sources in the first and the third groups, and present the corresponding results in the second row of each group in Table 3. The ten MAMBO detected sources in the second group are all radio quiet (according to the definition in Kellermann et al. 1989).
3.1 The mean SED
The mean 250 GHz flux density is for the whole sample, and for the MAMBO detections. The mean 250 GHz flux density of MAMBO non-detections is recovered by averaging all the on-source pixel values. A signal of is obtained for this group, which is about one quarter of the value of the typical MAMBO detections. We ran the stacking with the non-detection group several times, omitting one source each stack, to see if this signal is due to a single source that is just below the detectability. The test shows stacking flux densities in the range of 0.47 to 0.56 mJy with rms values of 0.13 mJy. Thus it is unlikely that the average flux density is dominated by one object. No significant differences are found in the values when the radio-loud sources are excluded in each group.
The average 1.4 GHz observed flux densities are to for the radio quiet sources in the three groups. We convert these measurements to the flux densities at rest frame 5 GHz assuming a power-law radio spectrum of (Condon 1992). This gives an average radio loudness (i.e. average radio to optical emission ratio ) of 0.7, which is consistent with the typical radio loudness values of found with local(Kellermann et al. 1989) and z2 (Cirasuolo et al. 2003) radio quiet quasars. The derived q parameters (i.e. FIR to radio emission ratios) are all lower or at the edge of the range of for typical star forming galaxies (Yun et al. 2001), but are consistent with the values of q2 found in the local Seyfert 1 galaxies (Ulvestad & Ho 2001). This result suggests that, as was found in the local universe and at z2 to 4, AGN power dominates the radio emission in a large fraction of these radio quiet quasars, i.e., the radio quiet AGNs are in fact not radio silent (Barvainis et al. 2005; Carilli et al. 2001; Petric et al. 2006).
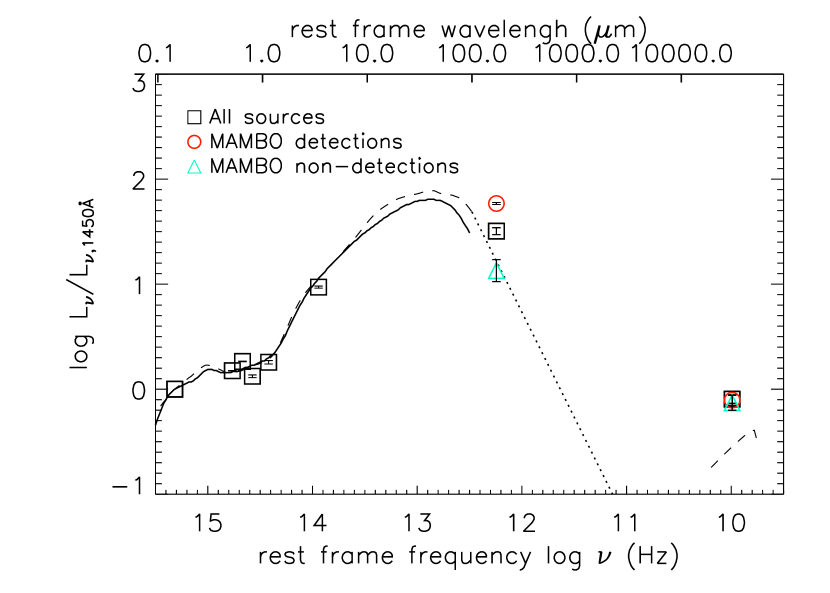
We plot the mean SED (normalized by the rest frame 1450 flux density) of the radio quiet sources in each group in Figure 2, together with the templates of low-z optical quasars from Elvis et al. (1994) and Richards et al. (2006). We also plot the average optical to near infrared emission based on the Spitzer photometry of 13 z6 quasars from Jiang et al. (2006), who show that the ratio is consistent with the local templates. The FIR-to-1450 ratios of the three z6 quasar groups have a range of 0.6 dex, and no obvious excess is seen between the value of the whole sample and the FIR end of the templates. However, due the lack of millimeter and submillimeter data, the available templates do not give a good constraint of the FIR-to-millimeter SED for the local optical quasars. Sanders et al. (1989) studied a sample of optically selected Palomar-Green quasars (PG quasars; Schmidt & Green 1983; Boroson & Green 1992), and their analysis suggest that the typical 100m to 1 spectral index (()) is . We extrapolate the FIR emission of the templates with this result (an example of is plotted in Figure 2). The extrapolation matchs the mean value of the z6 MAMBO undetected quasars very well, while the average value of the MAMBO detection is 2.5 times higher.
3.2 The SEDs of objects with 250 GHz detections
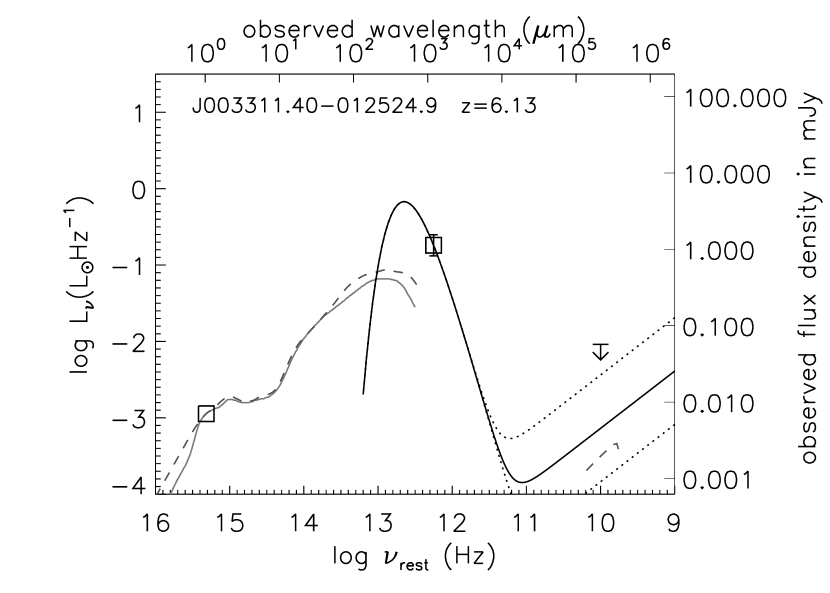
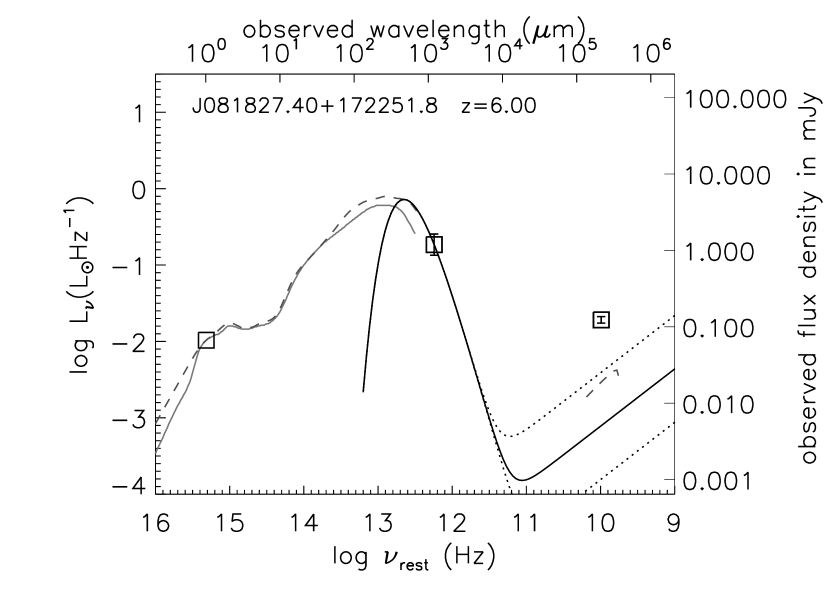
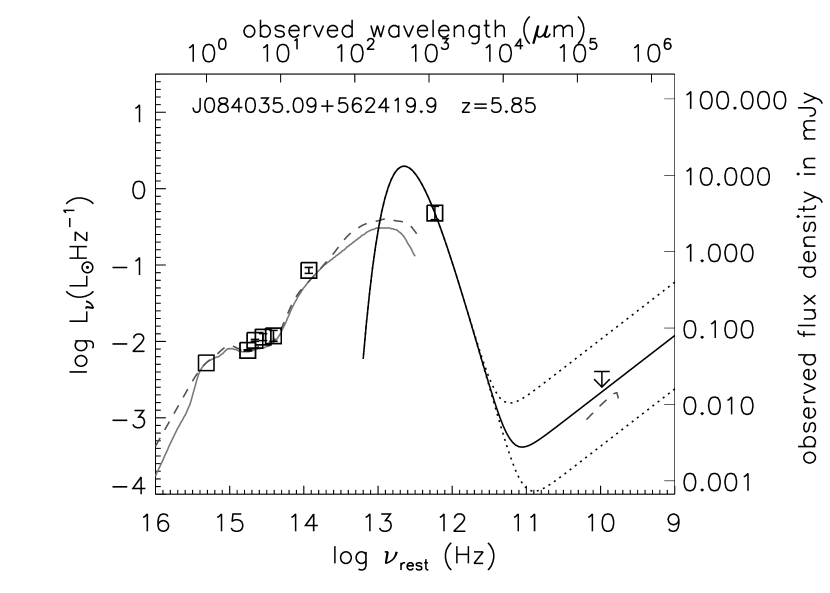
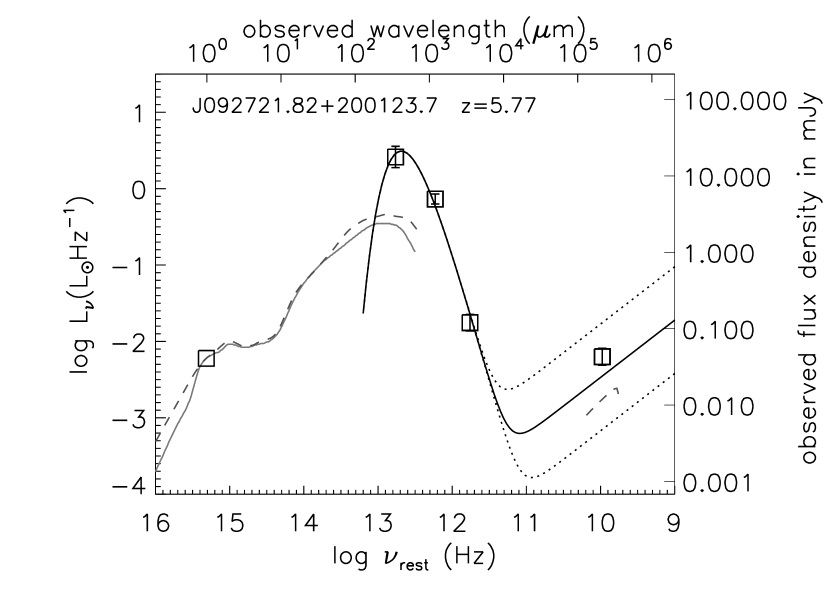
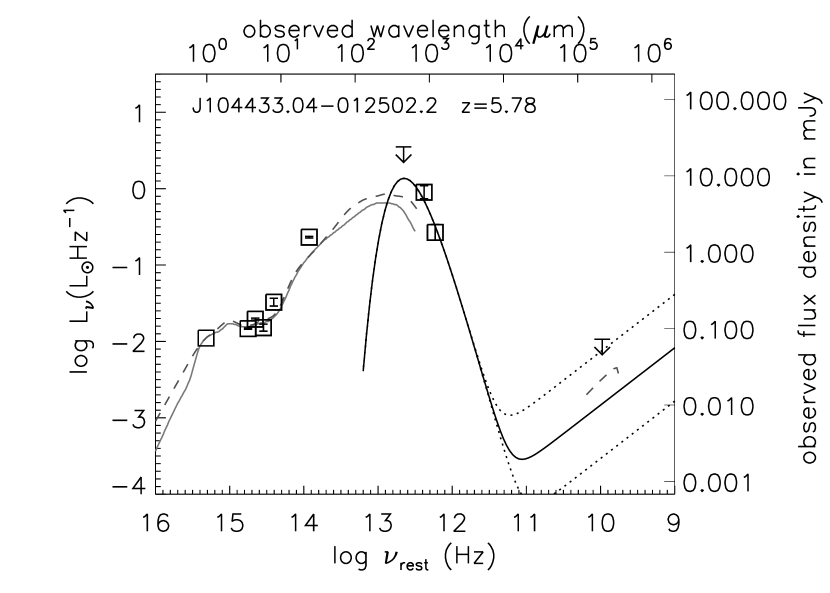
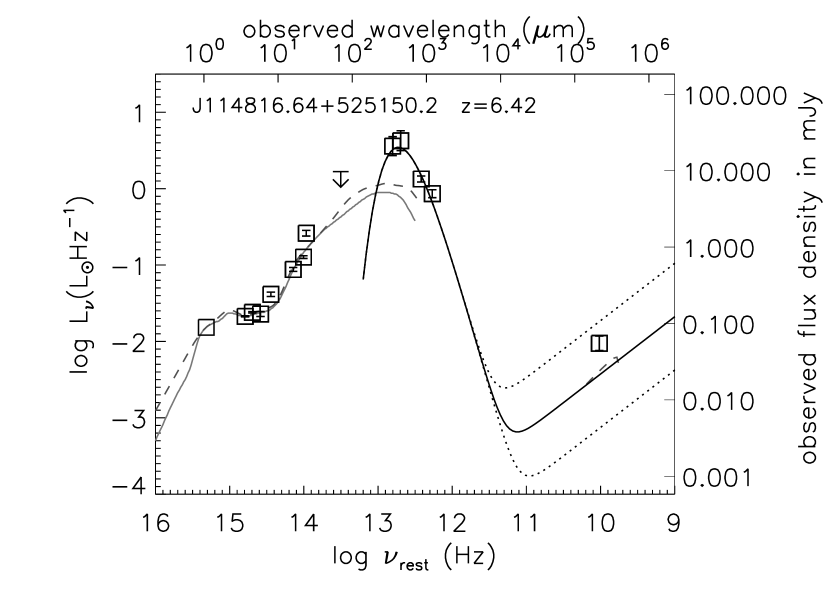
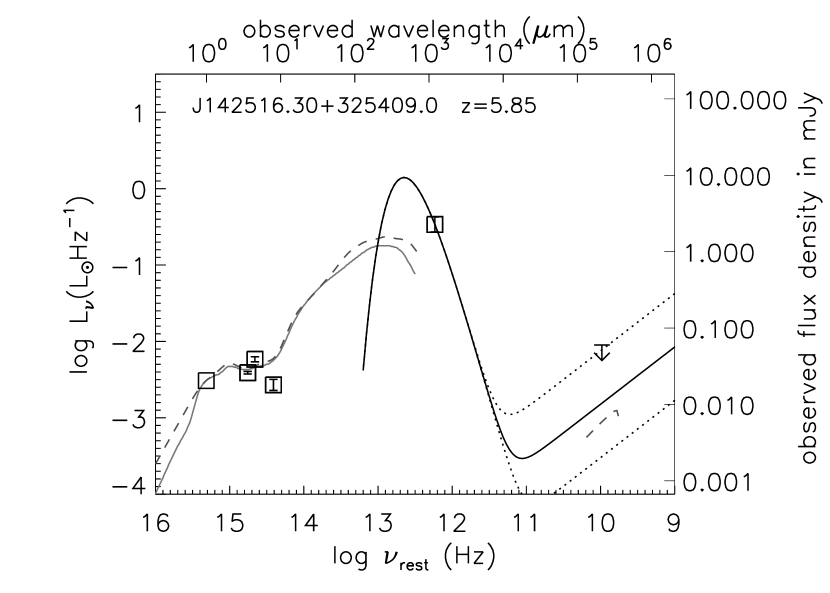
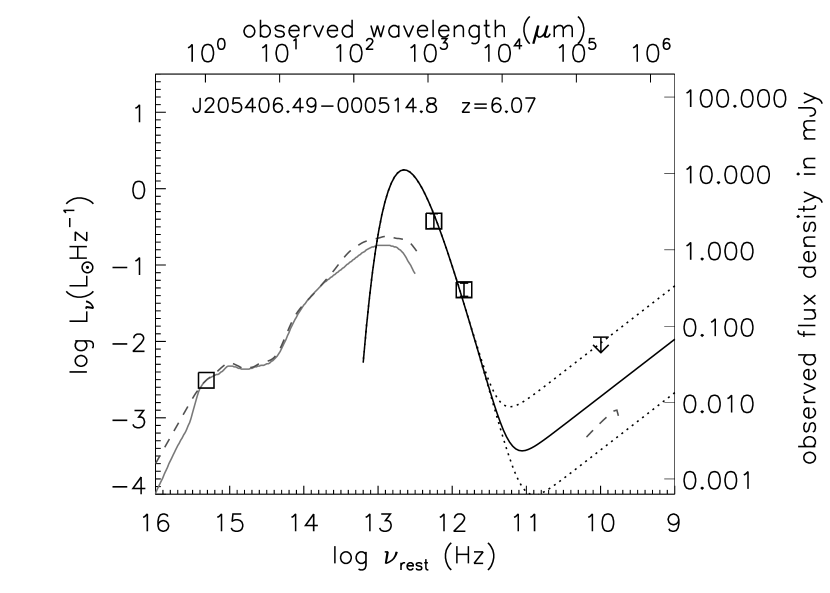
We plot the individual optical-to-radio spectral energy distribution (SEDs) for the ten sources that were detected by MAMBO in Figure 3. The FIR emission from the two strongest MAMBO detections, J1148+5251 and J0927+2001, was well measured with SHARC-II and SCUBA at shorter wavelengths, which show FIR emission bumps in the SEDs with dust temperatures of 55 K and 52 K, respectively (Robson et al. 2004; Beelen et al. 2006; Wang et al. 2008a). Similar excesses are also seen in the SEDs of another five sources: J0033-0125, J0840+5624, J1335+3533, J1425+3254, and J2054-0005, where the observed 250 GHz flux densities are dex higher than those expected from the quasar templates fit to the observed optical emission.
We model the FIR emission of these sources with a optically thin graybody assuming an emissivity index of (Beelen et al. 2006). For J0927+2001 and J1148+5251, we directly adopt the dust temperatures fit in Wang et al. (2008a) and Beelen et al. (2006), respectively. For the other nine sources, we assume a dust temperature of 47K (Beelen et al. 2006; Wang et al. 2007). The model FIR SED was extrapolated to the radio band using the typical FIR to radio correlation defined by star forming galaxies, i.e. q=2.34 (Yun et al. 2001). A radio spectral index of -0.75 is adopted here (Condon 1992). Three out of the seven FIR excess sources have been detected at 1.4GHz with deep VLA observations, and the observed flux densities are all above the average for their 250 GHz flux and q=2.34, but the values are within the range in which star forming galaxies lie.
4 Correlations between FIR emission and the AGN
To investigate the origin of the FIR emission, we compare the correlation between the FIR luminosities and the central AGN bolometric luminosities of these z6 quasars to that of two samples of local quasars: a sample of forty-five local (z0.5) PG quasars from Hao et al. (2005), a sample of thirty-one z0.35 type I AGNs hosted in ULIRGs with IR luminosities (IR quasars; Zheng et al. 2002; Hao et al. 2005).
Hao et al. (2005) reported that the IR quasar sample showed stronger FIR emission and
a shallower slope in the 60 m-optical luminosity relationship
when compared to the PG quasars (see also Hao et al. 2007).
They attributed this result to the starburst-dominated FIR dust heating
in the host galaxies of these IR quasars.
We re-fit these FIR-AGN relationships using the FIR and AGN
bolometric () luminosities of the two samples. The bolometric
luminosities are taken from Hao et al. (2005), which were derived from the
extinction-corrected quasar optical emission (see also Zheng et al. 2002).
The FIR luminosities of the IR quasars are taken from Zheng et al. (2002),
while for the PG quasar sample we adopt the FIR luminosities and upper limits presented
in Haas et al. (2003). All these data are corrected to our cosmology.
We adopt the Expectation-Maximization
method in the IRAF STSDAS package (Isobe et al. 1986) which can perform linear
regression with censored data. The results are:
| (5) |
| (6) |
Figure 4 compares the z6 quasars to these two local
quasar samples in the plane.
All the millimeter detected sources, and the average of the
non-detections are presented. For millimeter detections,
was integrated
using the modeled FIR SEDs described in Section 3.2
(see also Wang et al. 2007), and for non-detections we
adopt the estimation of average FIR luminosity in
Section 3. The AGN bolometric luminosities of these z6
quasars are estimated based on optical and near-infrared
observations. Jiang et al. (2006) presented for the
Spitzer observed sources. We adopted their results
(corrected to the cosmology we adopted in this paper) and estimated
from the optical B-band luminosity for the other sources,
(Richards et al. 2006). The B-band
luminosities are estimated with the rest frame 1450
magnitudes assuming a power-law spectrum of .
We also convert to
black hole accretion rate using
| (7) |
and an assumed efficiency . The derived parameters for the ten sources are listed in Table 4.
Nine of the ten MAMBO-detected z6 quasars stand close to the relationship derived from local IR quasars in the plot (Figure 4), while the other source J0818+0722 has a lower FIR luminosity, falling between the relationships of the IR and PG quasars. This may suggest that the strong millimeter detections at z6 are the high-mass counterparts of the local IR selected quasars, and a similar starburst dust-heating mechanism dominates their FIR emission. However, these z6 quasars are much more luminous in the optical than the two local quasars and the trends derived with the two local samples are getting mixed at high luminosity end. Thus extending the millimeter study to the optically fainter quasar population at z6 will help to determine the correlation for the millimeter bright z6 quasars and make a better comparison at low and high redshifts. On the other hand, the average value of the MAMBO non-detections is consistent with the trend defined by the local PG quasars.
5 A link between millimeter detection and the strength of emission
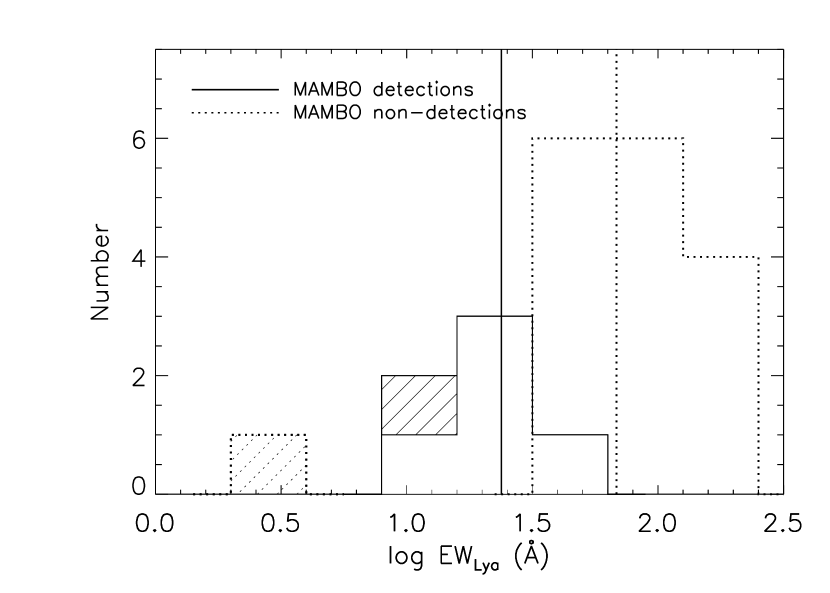
Omont et al. (1996b) studied a sample of z4 optically bright quasars and found that the millimeter detected sources tend to have weaker UV emission lines compared to the average line strength of the millimeter non-detections. Bertoldi et al. (2003a) found a similar trend with MAMBO observations of five z6 quasars. In this section, we investigate this effect with the emission of full sample of z6 quasars observed with MAMBO. The rest-frame equivalent widths () of five quasars in the SDSS deep strip were presented in Jiang et al. (2007a). The UV spectra of another 20 sources are available in the papers of Fan et al. (2000, 2001a, 2003, 2004, 2006a, 2008, in prep). We estimate for 18 of them. The spectra have been corrected for Galactic extinction, adopting the extinction curve presented in Savage & Mathis (1979). We then fit the spectra using a method similar to that used in Jiang et al. (2007a), i.e. a power-law () for the UV continuum and gaussians for the and line emission. The sources J1044-0125 and J1048+4637 have broad absorption line features and their equivalent widths are therefore unavailable.
We plot the histograms of for MAMBO detections (solid line) and non-detections (dotted line) in Figure 5. Most of the MAMBO detections distribute in the region of with a median value of 24 , while most non-detections have with a median value of 68 which is comparable to the average value of 70 from the large optical quasar samples at lower redshifts (Schneider et al. 1991; Fan et al. 2001b). However, there is also one MAMBO non-detected source, J1621+5155, which shows very weak emission with .
The physical origin of this curious trend is not clear. According to the spectra study with samples of z4 quasars presented in Omont et al. (1996b), similar weaker emission is also seen in other UV emission lines, such as the Si IV/O IV] and C IV lines. Though the UV line emission is weak in the MAMBO detected sources, there is no evidence of strong dust reddening in the UV continuum. We can speculate that intrinsically different physical conditions associated with the broad line emission cloud, or a special dust obscuration geometry that affects only the broad line region, may explain this effect. Further tests with other strong broad lines, such as the C IV, and Mg II lines in the UV, the H, and H lines in the optical, and the Paschen lines in near-infrared, are required to give a better understand of this trend. In particular, the trend may disappear when tested with the near-infrared lines if it is due to dust absorption.
6 Discussion
In this paper, we analyze the FIR properties of the current quasar sample at z6. These quasars are mainly optically selected, and represent the luminous end of the quasar population at this early epoch. The X-ray to near-infrared SEDs of these sources are dominated by powerful AGN, just as in optical quasars at lower redshift (Jiang et al. 2006). We divide the sample into MAMBO 250 GHz detections of 10 sources and non-detections of 23 sources. Their FIR emission was compared to that of the low-z quasars, and with the results listed above we will further discuss the FIR dust heating and evolution stage of these z6 quasars in this section.
6.1 The average FIR emission of the 250 GHz non-detections
The average FIR emission of the MAMBO non-detections is recovered at by stacking the 250 GHz measurements of each source, and the mean SED is similar to the low-z quasar templates of Elvis et al. (1994) and Richards et al. (2006). This suggests that the emission from the outer part of AGN-heated dust torus may dominates the FIR SED in these sources, as was found in the low-z optically bright quasars (Sanders et al. 1989; Haas et al. 2003). However, we cannot rule out contributions from star formation in the quasar hosts. Further surveys of PAH and other star forming features will address the average contribution from star formation to FIR dust heating in these objects. The average FIR luminosity (42.5m – 122.5m, rest frame) derived from the stacking flux density is 1.2. If star formation is not the dominating dust heating source (i.e. contributes 50%), the average star formation rate in the quasar hosts444The star formation rate is estimated with the empirical relationship from Kennicutt (1998), assuming a standard Salpeter initial mass function, i.e. , where is the infrared luminosity (8-1000m) in unit of , and is for warm dust emission. should be less than .
6.2 The FIR emission of the strong 250 GHz detections
Excess FIR emission is seen in seven of the MAMBO detected sources (see Figure 3). Their 250 GHz flux densities are much stronger ( dex) than the values expected from the quasar templates when normalized in the rest-frame UV. These sources show FIR-to-radio luminosity ratios within the range defined by typical star forming galaxies (Section 3.2, see also Carilli et al. 2004; Wang et al. 2007). The relation between FIR and AGN bolometric luminosity for these sources follows the trend defined by a sample of low-redshift IR luminous quasars which are hosted by ULIRGs (Section 4). The Spitzer near-infrared photometry by Jiang et al. (2006) detected the AGN-heated hot dust (1000 K) in some of these bright millimeter sources; the optical-to-near infrared SEDs of these sources match the low-z templates very well. The strong FIR emission bump in these sources indicates an additional warm dust component, with a dust temperature of 50 to 60 K. Brightness temperature arguments imply that the warm dust emission region must be extended over a few kpc (Wang et al. 2008a). Thus either a significant fraction of the dust heating is due to star formation in the host galaxy, or the AGN must heat dust over large scales.
Intense star formation activity is suggested by other observations of these strong millimeter quasars. Molecular CO emission is detected in the three strongest z6 millimeter sources: J1148+5251 (Bertoldi et al. 2003b; Walter et al. 2003, 2004), J0927+2001 (Carilli et al. 2007), and J0840+5624 (Wang et al. 2008b, in prep). These CO detections indicate the presence of of molecular gas in the quasar hosts (Walter et al. 2003; Bertoldi et al. 2003b; Carilli et al. 2007), which can provide the fuel required for star formation rates of up to . Indeed, it is hard to see how the host galaxies can avoid massive star formation with so much molecular gas. The measurement of several CO transitions in J1148+5251 suggests a gas density of about and a kinetic temperature of 100 K (Bertoldi et al. 2003b), which are similar to values in starburst environments found in other quasars and submillimeter galaxies at lower redshifts (Carilli et al. 2002; Solomon & Vanden Bout 2005; Riechers et al. 2006). In addition, recent high resolution observations of [C II] in J1148+5251 (Walter et al. 2008, in prep.; Carilli 2008) show an emission region extended over many kpc, i.e., comparable to that of the CO (3-2) line.
Further studies also suggest connections between the CO and FIR emission. The FIR-to-CO luminosity ratios of J1148+5251 and J0927+2001 are about 500 and 650 , respectively, which are consistent with the values found in other high-z CO emitting galaxies (Solomon & Vanden Bout 2005). In Figure 6, we indicate these two CO detected z6 quasars (as stars) on the FIR-CO luminosity correlation plot discussed in Riechers et al. (2006). The two points fall a little above but within the observed scatters of the FIR-CO luminosity relation of the typical star forming galaxies at both low and high redshifts.
All these facts suggest that massive star formation is an important source of the FIR dust heating. However, it is difficult to constrain what fraction of the FIR dust heating is contributed by star formation in these FIR luminous quasars. According to the FIR-to-CO luminosity correlation in Figure 6, at least of the FIR emission should originate from star formation, giving a corresponding star formation rate of .
6.3 The evolutionary stage of the z6 quasars
Observations from optical to near-infrared of these z6 quasars indicate that the central SMBHs have masses of (Willott et al. 2003; Jiang et al. 2006). Based on the SMBH-bulge mass relationship (eg. Marconi & Hunt 2003), the final stellar bulge mass should be on order of for a mature system. The formation of such a massive stellar system may require a star formation rate of on time scales of a few hundred million years as was suggested by some numerical simulations (eg. Li et al. 2007a, b). Thus the average star formation rate of found in the 250 GHz non-detected quasars can be either the case that the major bulge building has already been finished and the SMBH-bulge mass relationship seen at z=0 has already been established, or that the host galaxy is has not yet reached the massive star formation phase, and the growth of the stellar bulge is lagging behind that of the SMBH (see eg. Shields et al. 2006; Ho 2007). Deep and high-resolution imaging at near-IR wavelengths may provide a direct measurement of the stellar population in these z6 quasar hosts.
For the strong millimeter quasars at z6, the FIR excess suggests a star formation rate of from the host galaxies. It is likely that we are witnessing simultaneous building of the stellar bulge and growth of the SMBH in these objects. The case of J1148+5251 is the best documented: Willott et al. (2003) derived an estimate of for the black hole mass, while Walter et al. (2004) estimated a dynamical mass of . The SMBH-bulge mass ratio is thus clearly more than one order of magnitude larger than the local SMBH-bulge relationship (eg. Marconi & Hunt 2003), as in several other high-z CO-detected QSOs (Shields et al. 2006; Ho 2007). However, the amount of gas detected in CO observations such as in J1148+5251, a few , is far short of the value required to reach the bulge mass given by the local black hole-bulge relationship.
To fully understand the evolutionary stage of these strong millimeter quasars at z6, further observations are required. First, CO and [C II] searches and excitation studies should be extended to all the z6 quasars with strong FIR excesses to determine the host galaxy ISM properties. Second, high resolution () CO, [C II] and dust mapping should be made of all the CO detections. If the FIR-emitting dust and molecular gas are distributed similarly, the FIR emission is likely to be due to a starburst, while more compact FIR emission will argue for AGN dust heating. The resolved CO emission would also provide an estimate of the dynamical mass of the quasar hosts on kpc scales. This is a direct, and perhaps the only, way to test the black hole-bulge relationship at the highest redshifts. These observations can be done with sensitive submillimeter, millimeter and radio telescopes such as the PdBI, CARMA, and SMA, and the coming ALMA and EVLA.
7 Conclusion
We study the SEDs of 33 quasars at z6 from FIR to radio wavelengths. We conclude that, when averaged with the whole sample and the 250 GHz undetected sources, no significant difference is seen between the mean FIR-to-radio SEDs and the templates of low-redshift optically selected quasars. In particular, we extrapolate the FIR emission of the templates with the typical quasar FIR-to-millimeter spectrum (i.e. ) from Sanders et al. (1989). This extrapolation is consistent with the average FIR emission of the 250 GHz undetected z6 quasars very well (see Section 3.1 and Figure 2). This fact suggests that these sources have a similar AGN dominated dust heating mechanism. The average star formation rate from the host galaxies of the quasars undetected by MAMBO is estimated to be less than a few hundred .
We detect a strong FIR excess in seven of the ten z6 quasars detected in the millimeter band. These FIR luminous sources are likely to be the high-mass counterparts of local IR luminous quasars which are in transition between the starburst phase and the mature quasar phase. Star formation at rates of may be the dominant mechanism to heat the dust that gives rise to the FIR emission. The millimeter detected sources also show weaker Lya emission compared to that of the non-detections, but the origin of this trend is not clear yet. Further observations of these FIR luminous quasars, especially spatially resolved line and dust studies, are required to further address questions of star formation and FIR dust heating in these extreme objects.
The current sample of z6 quasars is optically selected. There may be other quasar populations at z6 which are still buried in their starburst environment and are obscured in the optical. Sensitive IR and millimeter facilities, such as Spitzer, ALMA, and Herschel, may discover such objects and provide a more complete view of galaxy and SMBH evolution in the early universe.
References
- (1) Abazajian, K. et al. 2003, AJ, 126, 2081
- (2) Abazajian, K. et al. 2004, AJ, 128, 502
- (3) Abazajian, K. et al. 2005, AJ, 129, 1755
- (4) Adelman-McCarthy, J. et al. 2006, ApJS, 162, 38
- (5) Adelman-McCarthy, J. et al. 2007a, ApJS, 172, 634
- (6) Adelman-McCarthy, J. et al. 2008, ApJS, 175, in press
- (7) Barvainis, R., Lehr, J., Birkinshaw, M., Falcke, H., & Blundell, K. M. 2005, ApJ, 618, 108
- (8) Beelen, A., Cox, P., Bertoldi, F. et al. 2006, ApJ, 642, 694
- (9) Benford, D. J., Cox, P., Omont, A., Phillips, T. G., & McMahon, R. G. 1999, ApJ, 518, 65
- (10) Bertoldi, F., Carilli, C. L., Cox, P. et al. 2003a, A& A, 406, L55
- (11) Bertoldi, F., Cox, P., Neri, R. et al. 2003b, A& A, 409, L47
- (12) Best,P. N., Kauffmann, G., Heckman, T. M., & Ivezić, Ž. 2005, MNRAS, 362, 9
- (13) Boroson, T. A., & Green, R. F. 1992, ApJS, 80, 109
- (14) Carilli, C. L., Bertoldi, F., Rupen, M. P. et al. 2001, ApJ, 555, 625
- (15) Carilli, C. L. et al. 2002, AJ, 123, 1838
- (16) Carilli, C. L., Walter, F., Bertoldi, F. et al. 2004, AJ, 128, 997
- (17) Carilli, C. L. et al. 2007, ApJ, 666, L9
- (18) Carilli, C. L. 2008, in Proceedings of Science, ’From planets to Dark ages: the modern radio Universe,’ ed. Beswick
- (19) Cirasuolo, M., Celotti, A., Magliocchetti, M. & Danese, L. 2003, MNRAS, 346, 447
- (20) Cool, R. J., Kochanek, C. S., Eisenstein, D. J. et al. 2006, AJ, 132, 823
- (21) Condon, J. J. 1992, ARA& A, 30, 575
- (22) Condon, J. J., Cotton, W. D., Greisen, E. W., Yin, Q. F., Perley, R. A., Taylor, G. B., & Broderick, J. J. 1998, AJ, 115, 1693
- (23) Cowie, L. L., Songaila, A., Hu, E. M., & Cohen, J. G., 1996, AJ, 112, 839
- (24) Dwek, E., Galliano, F., & Jones, A. P. 2007, ApJ, 662, 927
- (25) Elvis, M. et al. 1994, ApJS, 95, 1
- (26) Fan, X., White, R. L., Davis, M. et al. 2000, AJ, 120, 1167
- (27) Fan, X., Narayanan, V. K., Lupton, R. H. et al. 2001a, AJ, 122, 2833
- (28) Fan, X. et al. 2001b, AJ, 121, 31
- (29) Fan, X., Strauss, M. A., Schneider, D. P. et al. 2003, AJ, 125, 1649
- (30) Fan, X., Hennawi, J. F., Richards, G. T. et al. 2004, AJ, 128, 515
- (31) Fan, X., Strauss, M. A., Richards, G. T. et al. 2006a, AJ, 131, 1203
- (32) Fan, X., Carilli, C. L., & Keating, B. 2006b, ARA&A, 44, 415
- (33) Fan, X. et al. 2008, in prep.
- (34) Fukugita, M., Ichikawa, T., Gunn, J. E., Doi, M., Shimasaku, K., & Schneider, D. P. 1996, AJ, 111, 1748
- (35) Goto, T. 2006, MNRAS, 371, 769
- (36) Guilloteau, S., Omont, A., McMahon, R. G., Cox, P., & Petitjean, P. 1997, A&A, 328, L1
- (37) Guilloteau, S., Omont, A., Cox, P., McMahon, R. G., & Petitjean, P. 1999, A&A 349, 363
- (38) Gunn, J. E. et al. 2006, AJ, 131, 2332
- (39) Hao, C. N., Xia, X. Y., Mao, S. et al. 2005, ApJ, 625, 78
- (40) Hao, C. N., Xia, X. Y., Mao, S., Deng, Z. G., & Wu, H. 2007, ChJAA, submitted, (astro-ph/0704.3247)
- (41) Haas, M., Klaas, U., Mller, S. A. H. et al. 2003, A& A, 402, 87
- (42) Helou, G., Soifer, B. T., & Rowan-Robinson, M. 1985, ApJ, 298, L7
- (43) Heckman, T. M., Kauffmann, G., Brinchmann, J. et al. 2004, ApJ, 613, 109
- (44) Ho, L. C. 2007, ApJ, 669, 821
- (45) Hogg, D. et al. 2001, AJ, 122, 2129
- (46) Hopkins, P. F., Hernquist, L., Cox, T. J., Robertson, B., & Krause, E. 2007a, ApJ, 669, 67
- (47) Isobe, T., Feigelson, E. D., & Nelson, P. I. 1986, ApJ, 306, 490
- (48) Ivezić, Ž. et al. 2004, Astronomische Nachrichten, 325, 583
- (49) Jannuzi, B. T. et al. 2004, AAS, 204, 4801
- (50) Jiang, L., Fan, X., Hines, D. C. et al. 2006, AJ, 132, 2127
- (51) Jiang, L. et al. 2007, AJ, 134, 1150
- (52) Jiang, L. et al. 2008, AJ, 2008, 135, 1057
- (53) Kauffmann, G., & Heckman, T. M. 2005, Philos. Trans. R. Soc. London, A, 363, 621
- (54) Kellermann K. I., Sramek, R., Schmidt, M. et al. 1989, AJ, 98,1195
- (55) Kennicutt, R. C. 1998, ARA&A, 36, 189
- (56) Kreysa, E. et al. 1998, in Proc. SPIE Vol. 3357, p. 319-325
- (57) Li, Y. et al. 2007a, ApJ, in press, astro-ph (0608190)
- (58) Li, Y. et al. 2007b, ApJ, submitted, astro-ph (0706.3706)
- (59) Lupton, R. H., Gunn, J. E., Ivezić, Ž., Knapp, G. R., Kent, S. M., & Yasuda, N., 2001, ASP Conf. Ser. 238: Astronomical Data Analysis Software and Systems X, 10, 269
- (60) Maiolino, R., Cox, P., Caselli, P. et al. 2005, A& A, 440, L51
- (61) Marconi, A., & Hunt, L. K. 2003, ApJ, 589, L21
- (62) McGreer, I. D., Becker, R. H., Helfand, D. J. et al. 2006, ApJ, 652, 157
- (63) Momjian, E., Carilli, C. L., & Petric, A. O. 2005, AJ, 129, 1809
- (64) Momjian, E., Carilli, C. L., Riechers, D. A., Walter, F. 2007, 134, 694
- (65) Omont, A., Petitjean, P., Guilloteau, S, McMahon, R. G., Solomon, P. M., & Pcontal, E. 1996a, Nature, 382, 428
- (66) Omont, A., McMahon, R. G., Cox, P., Kreysa, E., Bergeron, J., Pajot, F., & Storrie-Lombardi, L. J. 1996b, A&A, 315, 1
- (67) Omont, A., Cox, P., Bertoldi, F. et al. 2001, A& A, 374, 371
- (68) Omont, A., Beelen, A., Bertoldi, F. et al. 2003, A& A, 398, 657
- (69) Petric, A. O., Carilli, C. L., Bertoldi, F. et al. 2003, AJ, 126, 15
- (70) Petric, A. O., Carilli, C. L., Bertoldi, F. et al. 2006, AJ, 132, 1307
- (71) Pier, J. et al. 2003, AJ, 125, 1559
- (72) Priddey, R. S., Isaak, K. G., McMahon, R. G. et al. 2003a, MNRAS, 339, 1183
- (73) Priddey, R. S., Isaak, K. G., McMahon, R. G. et al. 2003b, MNRAS, 344, L74
- (74) Priddey, R. S., Ivison, R. J., & Isaak, K. G. 2008, MNRAS, 383, 289
- (75) Richards, G. T. et al. 2006, ApJS, 166, 470
- (76) Riechers, D. A. et al. 2006, ApJ, 650, 604
- (77) Robson, I., Priddey, R. S., Isaak, K. G. et al. 2004, MNRAS, 351, L29
- (78) Sanders, D. B., Soifer, B. T., Elias, J. H., Madore, B. F., Matthews, K., Neugebauer, G., & Scoville, N. Z. 1988, ApJ, 325, 74
- (79) Sanders, D. B., Phinney, E. S., Neugebauer, G., Soifer, B. T., & Matthews, K. 1989, ApJ, 347, 29
- (80) Savage, B. D., & Mathis, J. S. 1979, ARA&A, 17, 73
- (81) Schmidt, M., & Green, R. F. 1983, ApJ, 269, 352
- (82) Schneider, D. P., Schmidt, M., & Gunn, J. E. 1991, AJ, 101, 2004
- (83) Shields, G. A., Menezes, K. L., Massart, C. A., & Vanden Bout, P. 2006, ApJ, 641, 683
- (84) Smith, J. et al. 2002, AJ, 123, 2121
- (85) Solomon, P. M., & Vanden Bout, P. A. 2005, ARA&A, 43, 677
- (86) Spergel, D. N. et al. 2007, ApJS, 170, 377
- (87) Stoughton, C. et al. 2002, AJ, 123, 485
- (88) Tremaine, S., Gebhardt, K., Bender, R. et al. 2002, ApJ, 574, 740
- (89) Tucker, D. et al. 2006, Astron. Nachr., 327, 821
- (90) Ulvestad, J. S., & Ho, L. C. 2001, ApJ, 558, 561
- (91) Venemans, B. P., McMahon, R. G., Warren, S. J., Gonzalez-Solares, E. A., Hewett, P. C., Mortlock, D. J., Dye, S., & Sharp, R. G. 2007, MNRAS, 376, L76
- (92) Venkatesan, A., Nath, B. B., & Shull, J. M. 2006, ApJ, 640, 31
- (93) Walter, F., Bertoldi, F., Carilli, C. L. et al. 2003, Nature, 424, 406
- (94) Walter, F., Carilli, C. L., Bertoldi, F. et al. 2004, ApJ, 615, L17
- (95) Walter, F. et al. 2008, in prep.
- (96) Wang, R., Carilli, C. L., Beelen, A. et al. 2007, AJ, 134, 617
- (97) Wang, R. et al. 2008a, AJ, 135, 1201
- (98) Wang, R. et al. 2008b, in prep.
- (99) White, R. L., Becker, R. H., Helfand, D. J. et al. 1997, ApJ, 475, 479
- (100) Willott, C. J., Steve, R., & Grimes, J. A. 2003, ApJ, 598, 909
- (101) Willott, C. J. et al. 2007, AJ, 134, 2435
- (102) Wu, H., Zou, Z. L., Xia, X. Y., & Deng, Z. G. 1998, A&AS, 132, 181
- (103) York, D. G., Adelman, J., Anderson, J. E. et al. 2000, AJ, 120, 1579
- (104) Yun, M. S., Reddy, N. A., & Condon, J. J. 2001, ApJ, 554, 803
- (105) Zheng, Z., Xia, X. Y., Mao, S. et al. 2002, AJ, 124, 18
- (106) Zylka, R. 1998, MOPSI Users Manual, (IRAM: Grenoble)
| Name | redshift | Referencea | ||||
|---|---|---|---|---|---|---|
| mJy | Jy | |||||
| (1) | (2) | (3) | (4) | (5) | (6) | (7) |
| J000552.34000655.8 | 5.85 | 20.23 | -26.47 | 0.360.48 | 40130 | 1,,2 |
| J003311.40012524.9 | 6.13 | 21.78 | -25.00 | 1.130.36 | -2719 | 3,3, |
| J020332.39+001229.3 | 5.86 | 20.97 | -25.73 | 1.520.67 | 19522 | 4,, |
| J030331.40001912.9 | 6.07 | 21.33 | -25.43 | 0.230.51 | -8562 | 4,, |
| J035349.76+010405.4 | 6.05 | 20.21 | -26.55 | 1.200.46 | 1719 | 4,, |
| J081827.40+172251.8 | 6.00 | 19.34 | -27.40 | 1.190.38 | 12312 | 5,,2 |
| J084119.52+290504.5 | 5.96 | 19.61 | -27.12 | 1.000.43 | 4327 | 8,, |
| J084229.23+121848.2 | 6.08 | 19.58 | -27.18 | 0.110.55 | -819 | 9,, |
| J092721.82+200123.7 | 5.77 | 19.87 | -26.81 | 4.980.75 | 5011 | 5,2, |
| J104433.04012502.2 | 5.78 | 19.21 | -27.46 | 1.820.43 | -1524 | 10,,7 |
| J142516.30+325409.0 | 5.85 | 20.62 | -26.08 | 2.270.51 | 2020 | 14,, |
| J142738.59+331242.0 | 6.12 | 20.33 | -26.44 | 0.390.66 | 1730131 | 15,,15 |
| J160253.98+422824.9 | 6.07 | 19.86 | -26.90 | 1.410.54 | 6015 | 1,,2 |
| J162100.70+515544.8 | 5.71 | 19.89 | -26.77 | 0.300.55 | -1221 | 9,, |
| J163033.90+401209.6 | 6.05 | 20.64 | -26.12 | 0.800.60 | 1415 | 11,12, |
| J164121.64+375520.5 | 6.04 | 21.30 | -25.45 | 0.080.46 | -3032 | 3,3, |
| J205406.42000514.8 | 6.07 | 20.67 | -26.09 | 2.380.53 | 1723 | 4,, |
| J231546.36002357.5 | 6.12 | 21.31 | -25.46 | 0.280.60 | 3116 | 4,, |
| J232908.28030158.8 | 6.43 | 21.65 | -25.20 | 0.010.50 | 1422 | 3,3, |
Note – The detections are marked as boldface.
aThe three references are for the optical, 250 GHz,
and 1.4 GHz data, respectively. The asterisks denote new data reported in this paper.
References for Table 1 and 2 – (1) Fan et al. 2004; (2) Wang et al. 2007; (3) Willott et al. 2007;
(4) Jiang et al. 2008; (5) Fan et al. 2006a;
(6) Fan et al. 2001a; (7) Petric et al. 2003; (8) Goto 2006; (9) Fan et al.
2008, in prep. (10) Fan et al. 2000; (11) Fan et al 2003; (12) Bertoldi et al.
2003a; (13) Carilli et al. 2004; (14) Cool et al. 2006; (15) McGreer et al. 2006.
| Name | redshift | Referencea | ||||
|---|---|---|---|---|---|---|
| mJy | Jy | |||||
| (1) | (2) | (3) | (4) | (5) | (6) | (7) |
| J000239.39+255034.8 | 5.80 | 19.02 | -27.67 | 0.200.88 | 8914 | 1,2,2 |
| J083643.85+005453.3 | 5.81 | 18.81 | -27.88 | -0.390.96 | 174040 | 6,7,7 |
| J084035.09+562419.9 | 5.85 | 20.04 | -26.66 | 3.200.64 | 129 | 5,2,2 |
| J103027.10+052455.0 | 6.31 | 19.66 | -27.16 | -1.151.13 | -320 | 6,2,2 |
| J104845.05+463718.3 | 6.20 | 19.25 | -27.55 | 3.000.40 | 713 | 11,12,2 |
| J113717.73+354956.9 | 6.01 | 19.63 | -27.12 | 0.101.13 | 917 | 5,2,2 |
| J114816.64+525150.2 | 6.42 | 19.03 | -27.82 | 5.000.60 | 5512 | 11,12,13 |
| J125051.93+313021.9 | 6.13 | 19.64 | -27.14 | 0.070.90 | 3721 | 5,2,2 |
| J130608.26+035626.3 | 6.02 | 19.55 | -27.19 | -1.051.04 | 1421 | 6,7,7 |
| J133550.81+353315.8 | 5.95 | 19.89 | -26.84 | 2.340.50 | 3510 | 5,2,2 |
| J141111.29+121737.4 | 5.93 | 19.97 | -26.75 | 1.000.62 | 6116 | 1,2,2 |
| J143611.74+500706.9 | 5.83 | 20.16 | -26.54 | -0.211.14 | 616 | 5,2,2 |
| J150941.78174926.8 | 6.12 | 19.82 | -26.95 | 1.000.46 | – | 3,3,- |
| J162331.81+311200.5 | 6.25 | 20.13 | -26.67 | 0.170.80 | 2431 | 1,2,2 |
Note – The detections are marked as boldface.
aThe three references are for the optical, 250 GHz,
and 1.4 GHz data, respectively, and the corresponding literatures are listed at the end of Table 1.
| Group | q | ||||||
|---|---|---|---|---|---|---|---|
| mJy | Jy | ||||||
| (1) | (2) | (3) | (4) | (5) | (6) | (7) | (8) |
| Whole sample | 33 | 1.260.10 | 2.90.2 | 32 | 463 | 0.0310.002 | 1.410.04 |
| (radio quiet) | 30 | 1.290.10 | 3.00.2 | 29 | 323 | 0.0220.002 | 1.570.05 |
| MAMBO detections | 10 | 2.730.06 | 6.40.1 | 10 | 374 | 0.0240.003 | 1.840.05 |
| Non-detections | 23 | 0.520.13 | 1.20.3 | 22 | 564 | 0.0380.003 | 0.940.11 |
| (radio quiet) | 20 | 0.510.13 | 1.20.3 | 19 | 274 | 0.0180.003 | 1.240.13 |
a Number of sources observed at 250 GHz.
b Number of sources observed at 1.4 GHz.
c A radio spectral index of -0.75 (Condon 1992) is adopted here to calculate the rest frame 1.4 GHz lunimosity.
| Name | |||
|---|---|---|---|
| (1) | (2) | (3) | (4) |
| J003311.40-012524.9 | 1.4 | 9.4 | 2.60.8 |
| J081827.40+172251.8 | 12.8 | 86.3 | 2.80.9 |
| J084035.09+562419.9 | 6.5 | 43.6 | 7.61.5 |
| J092721.82+200123.7 | 7.4 | 50.0 | 12.22.8 |
| J104433.04-012502.2 | 13.5 | 91.1 | 5.30.8 |
| J104845.05+463718.3 | 14.6 | 98.4 | 6.90.9 |
| J114816.64+525150.2 | 18.8 | 126.8 | 13.43.4 |
| J133550.81+353315.8 | 7.6 | 51.4 | 5.51.2 |
| J142516.30+325409.0 | 3.8 | 25.6 | 5.41.2 |
| J205406.42-000514.8 | 3.8 | 25.8 | 6.81.1 |
Note – is the black hole accretion rate derived with equation (7) in Section 4.