Detection of a Hot Subdwarf Companion to the Be Star FY Canis Majoris
Abstract
The rapid rotation of Be stars may be caused in some cases by past mass and angular momentum accretion in an interacting binary in which the mass donor is currently viewed as a small, hot subdwarf stripped of its outer envelope. Here we report on the spectroscopic detection of such a subdwarf in the Be binary system FY Canis Majoris from the analysis of data acquired by the IUE spacecraft and KPNO Coudé Feed Telescope over the course of 16 and 21 years, respectively. We present a double-lined spectroscopic orbit for the binary based upon radial velocities from the IUE spectra and use the orbital solutions with a Doppler tomography algorithm to reconstruct the components’ UV spectra. The subdwarf is hot ( kK) and has a mass of about and a radius of about . It contributes about as much flux as the Be star does in the FUV. We also present observations of the H and He I emission features that are formed in the circumstellar disk of the Be star. Orbital flux and velocity variations in the He I profile indicate that much of the emission forms along the disk rim facing the hot subdwarf where the disk is probably heated by the incident radiation from the subdwarf. A study of the FUV infall shell lines discovered in the 1980s confirms their episodic presence but reveals that they tend to be found around both quadrature phases, unlike the pattern in Algol binaries. Phase-dependent variations in the UV N V doublet suggest the presence of a N-enhanced wind from the subdwarf and a possible shock-interaction region between the stars where the subdwarf’s wind collides with the disk of the Be star.
1 Introduction
The component stars of massive interacting binaries experience profound transformations over their lifetimes. Their evolutionary stages are defined by how mass and angular momentum are shared and lost during the mass transfer stages (Wellstein, Langer, & Braun, 2001). The originally more massive star grows faster and upon reaching a size comparable to its Roche lobe begins mass and angular momentum transfer to the mass gainer companion. The orbit shrinks until the mass ratio reverses, but mass transfer will continue with an expanding orbit as long as the donor grows in proportion. The result will be a donor that is stripped of most of its outer envelope and a gainer that now appears rejuvenated by mass transfer (Dray & Tout, 2007). Mass transfer may also cause the gainer to spin up to a rotational speed close to the critical value where centripetal and gravitational accelerations are equal at the equator (Petrovic, Langer, & van der Hucht, 2005). Pols et al. (1991) and van Bever & Vanbeveren (1997) suggest that these mass gainer stars may include some of the rapidly rotating, classical Be stars, B-type stars that display emission lines formed in outflowing, circumstellar disks (Porter & Rivinius, 2003).
There is now a substantial body of evidence that the supports the idea that some Be stars were spun up by mass transfer in interacting binaries. Most of the known massive X-ray binaries consist of a Be star and neutron star companion, the remains of the former donor star (Coe, 2000). Donor stars that end up with a mass lower than the Chandrasekhar limit will probably avoid a supernova explosion, but will appear first as a hot subdwarf star and then eventually as a massive white dwarf. Although there are no known examples of Be plus white dwarf binaries, there are a few identified cases of Be plus hot subdwarf binaries. The first discovery of the spectrum of a subdwarf companion was made from the analysis of UV spectra from the International Ultraviolet Explorer (IUE) spacecraft (Thaller et al., 1995) and the Hubble Space Telescope (Gies et al., 1998) of the well-known Be star Persei. The hot companion in Per (catalog ) is an object of solar mass and radius but with an effective temperature of kK. However, the hot subdwarf is much fainter than the Be star, and its presence is perhaps best observed through its heating effects on the disk gas nearest to the subdwarf (Štefl, Hummel, & Rivinius, 2000; Hummel & Štefl, 2001). Maintz et al. (2005) show that the binary 59 Cygni shows many of the same characteristics found in Per and is probably the second example of a Be plus hot subdwarf system. A third candidate, HR 2142 (catalog ) (Peters, 1983), may also belong this category (Waters et al., 1991) but at the present the evidence is not compelling. The fact that the nature of the companions in Per and 59 Cyg (catalog ) were only discovered after a century of spectroscopic observation, however, highlights the difficulties of their detection (Gies, 2000).
Here we report on the identification of a hot subdwarf companion in the Be binary FY CMa (catalog ) (HR 2855, HD 58978). Balmer emission lines in the Be star primary in this system (B0.5 IVnpe, Hiltner, Garrison, & Schild 1969; B0.5 IVe, Slettebak 1982) were first discovered by Pickering & Fleming (1905). Although at first glance it appears to be a classical Be star, it has historically displayed much more spectroscopic variability in its optical and UV spectrum than is typical for Be stars (Slettebak, 1982; Peters, 1982, 1988; Grady et al., 1988; Cao, 2001). Some of the first IUE observations of FY CMa showed evidence of sharp, red-shifted, “shell” spectral lines that varied significantly on a timescale of days (Grady et al., 1988). Peters (1988) argued that the time scales of variability indicated a binary origin. Spectroscopic variability with a period of 37.26 d was subsequently found by Rivinius et al. (2004) who showed that the strength and profile of the N V wind line fluctuates with this period. Rivinius et al. (2004) also presented observations of the H and He I emission lines that suggested that they also varied in radial velocity and strength in much the same way as observed in Per and 59 Cyg, and suggested that FY CMa might be generically similar to these systems. However, Rivinius et al. (2004) could not confirm binarity as the orbital elements and the nature of the companion remained unknown.
Below we present an investigation of FY CMa that is based upon a re-examination of the IUE spectra and an analysis of a large collection of optical spectra obtained between 1985 and 2006 (§2). We first discuss the use of cross-correlation measurements of the IUE spectra to obtain radial velocities for both components and to derive the orbital elements (§3). We then use the orbital velocity curves to reconstruct the individual UV spectra of the components using a Doppler tomography algorithm, and we compare the reconstructed spectra to models to estimate basic stellar properties (§4). We then describe the orbital and temporal variations we find in the H and He I emission lines (§5). We argue in §6 that the emission line variations are probably due to heating of the part of the disk rim that faces the hot subdwarf companion. We also discuss the long-term and phase-dependent variability in the strength and velocity of the Fe III shell-type infall lines that were discovered in the mid-1980s and suggest two possible mechanisms for their formation. Finally, we show that phase-dependent profile, strength, and velocity variability in the N V wind lines suggest that the subdwarf’s wind is N-enhanced and that there is a significant interaction between the subdwarf’s wind and the disk of the Be star.
2 Observations
Ninety-seven high resolution FUV spectra were obtained with IUE over the period from 1979 to 1995. The spectra were secured with the Short Wavelength Prime (SWP) camera in echelle mode, and the extracted and flux calibrated spectra from the final archive were downloaded from the Multimission Archive at the Space Telescope Science Institute444http://archive.stsci.edu/iue/. We binned each spectrum onto a uniform wavelength grid (bin size equivalent to 10 km s-1), aligned them with a global average using cross–correlation shifts from the vicinity of strong interstellar lines (after which the interstellar lines are removed by interpolation), and then rectified the fluxes by a spline fit to a series of pseudo-continuum zones. We discuss the radial velocity measurements and the appearance of the UV spectra in the next two sections.
We also obtained 158 red spectra of FY CMa with the Kitt Peak National Observatory 0.9 m Coudé Feed Telescope between 1985 and 2006. The various observing runs are summarized in Table 1 that lists the heliocentric Julian dates of observation, Besselian year range, wavelength range, spectral resolving power, number of individual spectra obtained, and a summary of the instrumental configuration. The spectra all record the H emission line and all but six also record the He I feature. All the spectra were made with the long collimator, camera 5, and either grating A (632 grooves mm-1) or grating B (312 grooves mm-1) in second order. The CCD detector of choice changed over the years as better instruments became available, and these are listed in the final column using their standard KPNO designations. Most of the spectra are well exposed and have a S/N of 200 or better in the continuum.
The spectra were extracted and calibrated using standard routines in IRAF555IRAF is distributed by the National Optical Astronomy Observatory, which is operated by the Association of Universities for Research in Astronomy, Inc., under cooperative agreement with the National Science Foundation.. All the spectra were rectified to a unit continuum by fitting line-free regions with a low-order polynomial. During most of the runs from 2000 to 2006, we also observed a number of rapidly rotating A-type stars (primarily Aql) for the removal of atmospheric telluric lines from the target spectra. We created a library of atmospheric spectra for each run by removing the broad stellar features, and then we divided each target spectrum by the modified atmospheric spectrum that most closely matched the target spectrum in a selected region dominated by atmospheric absorptions. The spectra from runs before 2000 were transformed to the wavelength grid for the fourth to last run listed in Table 1 and then were corrected for telluric absorption using the atmospheric spectra from that run (sometimes with less than optimal results because of differences in spectral resolution). The spectra from each run were then transformed to a common heliocentric wavelength grid. Measurements of these red spectra are presented in §5.
3 Radial Velocities and Orbital Elements
The first detection of the UV spectrum of the hot subdwarf in Per was based upon IUE spectra that recorded many lines of high excitation transitions especially in the 1310 – 1385 Å range (Thaller et al., 1995). Thus, we began our search for evidence of a hot companion by calculating cross-correlation functions (ccfs) of each spectrum with a template spectrum within this restricted wavelength range (where the lines of the primary are relatively broad and weak). We formed the template spectrum from the synthetic spectral atlas associated with the non-LTE, line-blanketed models of Lanz & Hubeny (2003) that were rebinned to the IUE wavelength grid. We selected a solar abundance model with kK and for the template (close to the optimal values; §4). The resulting ccfs immediately revealed a narrow but weak signal that displayed a coherent Doppler shift when plotted against the orbital period from Rivinius et al. (2004) (see Fig. 1). We then made Gaussian fits of these ccfs to determine the radial velocity shifts for 50 of the 97 spectra where the ccf signal was clearly visible. We used the method of Zucker (2003) to estimate errors in the ccf velocities, and these range from 7 to 20 km s-1 depending on the S/N ratio of the spectrum.
We also measured ccf radial velocities for the Be star primary using two spectral regions where its photospheric lines are particularly strong (1423 – 1523 and 1570 – 1800 Å). In this case we used a template spectrum derived from the models of Lanz & Hubeny (2003) for kK and , first guesses based upon calibrations for the star’s spectral classification. The resulting ccfs are broad because of the star’s large projected rotational velocity, and instead of fitting these with a Gaussian, we determined the radial velocity shifts relative to the average ccf. According to the method of Zucker (2003), the errors in the ccf velocities for the Be star are about 3 km s-1. We then added the Gaussian-fitted radial velocity of the average ccf ( km s-1) to each of these relative velocities to end up with the primary star velocities listed in Table 2. This table lists the heliocentric Julian and UT dates of mid-exposure, the IUE image number for the spectrum, the orbital phase (see below), and the radial velocities and for the Be star (subscript 1) and the hot subdwarf (subscript 2), respectively. Also given with the same subscripts are the observed minus calculated residuals from the orbital fits (see Table 3), and we see that in general the deviations from the fit are comparable to the error estimates and to the scatter between measurements of pairs of spectra obtained close in time.
We made a period search of the two sets of velocities using the discrete Fourier transform methods of Roberts, Lehár, & Dreher (1987), and this analysis confirmed the period found by Rivinius et al. (2004). We then used the non-linear, least-squares program of Morbey & Brosterhus (1974) to determine independent orbital elements for the primary and secondary. These produced consistent results for the orbital period and epoch, and we adopted the period and epoch from the larger amplitude secondary that had significantly lower errors. We found that elliptical solutions did not yield any significant improvement in the residuals to the fits, so we assumed that the orbit is circular. Our final orbital elements are presented in column 3 of Table 3 and the radial velocity curves are plotted in Figure 2. Table 3 lists period, , epoch of the superior conjunction of the Be star, (defining orbital phase 0.0), semiamplitudes, , and systemic velocities, , for both components, mass ratio, , mass–inclination functions, , projected semimajor axis, , and r.m.s. residuals for each fit (where subscripts 1 and 2 refer to the orbits of the Be and subdwarf star, respectively)
4 Tomographic Reconstruction of UV Spectra
We used the Doppler tomography algorithm described by Bagnuolo et al. (1994) to reconstruct the individual primary and secondary spectra from the composite IUE spectra. We took the radial velocity shifts for each component from the orbital solutions in Table 3, and then the reconstruction was run for 50 iterations with a gain of 0.8 (the results are insensitive to these values). The flux ratio required for the reconstruction was determined from the secondary’s line depths after making a comparison of the secondary’s spectral properties with those in model spectra.
We began our comparison of the reconstructed secondary spectrum and model spectra from Lanz & Hubeny (2003) by considering the appropriate line broadening. We selected several strong and minimally blended metallic lines to compare with a grid of synthetic profiles formed by convolution with a rotational broadening function for a linear limb darkening law (Wade & Rucinski, 1985) and a range in assumed projected rotational velocity . The resulting mean of km s-1 indicates that the secondary’s lines are narrow and only barely resolved in the IUE spectra. We then experimented with a range of model effective temperatures and gravities to try to reproduce the relative patterns of line strength (especially in the region surrounding the weak Si III feature). We also compared the reconstructed and model profiles of the Stark broadened He II feature to help estimate the appropriate value of gravity . The parameters for the best matching solar abundance model spectrum are listed in column 3 of Table 4.
We then estimated the mean UV flux ratio to be based upon a comparison of the line strengths in the best match model and in the reconstructed secondary spectrum for a range in test values of flux ratio. We show in Figures 3 and 4 the good agreement between the reconstructed secondary and model spectra for two regions of the UV spectrum that contain a number of prominent Fe V and O V photospheric lines.
We also explored the range in synthetic spectral matches that were consistent with the appearance of the reconstructed Be star spectrum. Once again we compared the profile widths of several conspicuous absorption lines with models for a range in projected rotational velocity, and we found a mean value of km s-1. This estimate is similar to the result from Frémat et al. (2005), 375 km s-1, but it is larger than those reported in other optical studies (280 km s-1, Slettebak 1982; 155 km s-1, Abt, Levato, & Grosso 2002). We suspect that the optical lines may at times appear narrower because of unrecognized shell components formed in the Be star’s disk. We estimated the best match effective temperature based on the metallic line strengths (avoiding the use of narrow features like Si III that are probably partially formed in the disk; §6), and the best match model has a temperature consistent with the star’s spectral classification (Table 4). We simply assumed the gravity for the Be star based on its luminosity class since there are no easily made gravity estimates from the UV photospheric lines. We note that both the temperature and the gravity agree well with estimates made by Peters (1976) based upon the continuum colors and the profiles of H and H.
FY CMa is not a known eclipsing binary, so we cannot directly determine the system inclination and masses. However, the appearance of shell lines in the UV and optical spectra suggests that the inclination is probably large, (Hanuschik, 1996), if the disk resides in the orbital plane. The typical mass for a B0.5 V star is (Harmanec, 1988), and from the value of in Table 3, this would imply that the inclination could be as small as . The range in probable masses is given in Table 4.
We can estimate the radius of the Be star primary from its visual magnitude and its parallax as measured by Hipparcos (ESA, 1997). Adopting (Sterken, Vogt, & Mennickent, 1996), (Kaiser, 1989), , mas, and a bolometric correction of (Lanz & Hubeny, 2003), then the radius from the luminosity and adopted temperature is , where we have ignored the minor flux contributions from the disk and subdwarf. The radius of the subdwarf then follows from the observed and model UV flux ratios, . These mass and radius estimates yield gravities that are similar within errors to those from spectroscopic considerations.
5 Red Spectra Measurements
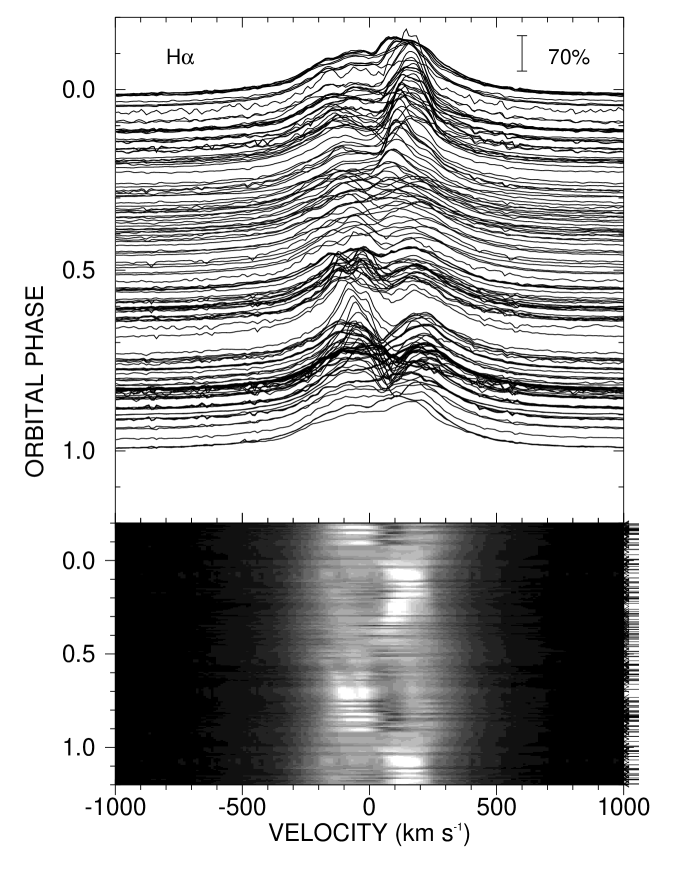
The H feature in our spectra always appeared as a strong emission line indicating that the Be disk was present throughout the period 1985 – 2006. We show in Figure 5 a montage of all the H profiles arranged according to orbital phase. The profile is often double-peaked, usually in the sense that the red peak is stronger around phase while the blue peak is stronger near phase . Thus, the observations appear to confirm the suggestion by Rivinius et al. (2004) that the variations are orbitally modulated. On the other hand, our spectra also show that there are temporal variations present unrelated to orbital phase that appear as alternating bright and dark horizontal segments in the gray-scale representation. We measured the H equivalent widths by making a numerical integration of the line flux over the interval from 6528 to 6599 Å (a region including weak emission components of C II ), and these are listed in Table 5. The typical equivalent width measurement error is 0.04 Å. We find that there are significant variations in line strength over time scales of a week or so that appear to be unrelated to orbital phase and that probably reflect changes in the disk density distribution.
The outer wings of H show a hint of an “S”-shaped velocity variation that is similar to the orbital velocity curve of the Be star. Since the outer parts of the profile are formed in the disk gas closest to the star, the line wings may share in the orbital motion of the underlying star. We measured the bisector position of the emission line wings near the 25% maximum flux level using the method of Shafter, Szkody, & Thorstensen (1986), and these wing velocities are listed in column 4 of Table 5 and are plotted together with the UV ccf velocities in Figure 2. The typical error for the radial velocities from the H wings is 1.0 km s-1. The H wing velocities indeed follow the orbital motion of the Be star, and the orbital elements based upon them are in substantial agreement with those from the UV ccfs (see column 2 of Table 2). The differences in systemic velocity are not significant given the asymmetries and line blending present in the H profile.
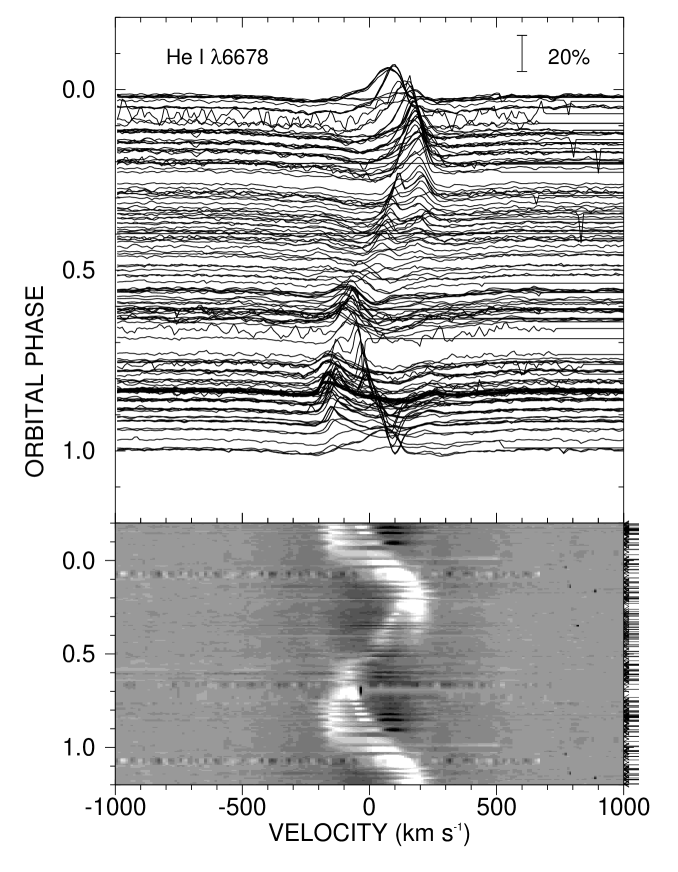
We show the dramatic variations of the He I profile with orbital phase in Figure 6. Here the emission displays a backwards “S”-shaped velocity variation that is similar to the secondary’s orbital velocity curve. The emission is strongest around orbital phase 0.0 when the hot subdwarf is in the foreground. The emission sometimes assumes a pronounced double-peaked shape, especially when the emission is relatively strong. In the same way as H, the He I line also displays non-orbital related variations that give a banded appearance to the gray-scale representation of the variations. We also see the occasional development of a central shell absorption feature at phases prior to superior conjunction of the Be star.
We made simple measurements of the peak velocity positions by locating the maximum flux positions in the He I profile. If two peaks were present and clearly separated by a local minimum, then we measured both peaks and recorded their mean position and their separation . If only one peak was visible, then only was measured. These measurements are given in the final two columns of Table 5 for all those cases where at least one strong peak was visible. They are also plotted in Figure 7 together with the orbital velocity curve of the hot subdwarf. We see that the velocity amplitude of the He I emission is actually larger than that of the subdwarf and that the episodes of greatest peak separation occur just prior to the orbital conjunctions. We show in the next section that these characteristics are consistent with an emission origin in the outer part of the disk that faces the subdwarf.
6 Discussion
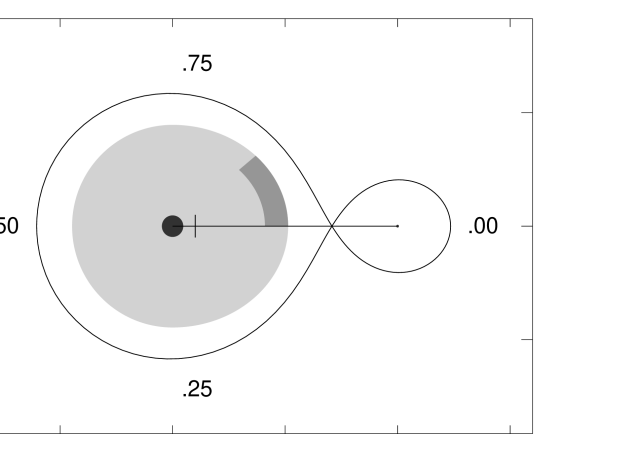
Our spectroscopic results provide the ingredients to estimate the basic elements of the system geometry. Here we discuss the system dimensions and the evidence that the hot subdwarf is implicated in local heating of the Be star’s disk in much the same way as was found for Per by Štefl et al. (2000) and Hummel & Štefl (2001) and for 59 Cyg by Maintz et al. (2005). We present in Figure 8 a sketch of the inferred system geometry as viewed from above the orbital plane. For the purpose of this illustration, we assume an orbital inclination of and a semimajor axis of (where the acceptable range is probably for ). We also adopt a Be star radius of (where the probable range is for distances of pc). The Be star is represented by the solid disk on the left while the hot subdwarf is shown by the small dot on the right. The double-lobe surrounding them shows the much larger Roche surface boundary. We can estimate the half light radius of the H emitting disk using the method described by Grundstrom & Gies (2006). This estimate is derived from a simple density power law for the disk, the mean equivalent width ( Å), the adopted Be star temperature and disk inclination, and an assumed disk outer boundary equal to the volume-equivalent, Roche radius. These parameters lead to an estimated disk to star radius ratio of , or a half-light emitting radius of for the adopted radius of the Be star. We caution that the simplicity of the models may lead to errors in the half-light radius of and that the models assume an azimuthal symmetry for the emission flux, which is probably not the case for the disk emission of FY CMa (see below). Nevertheless, this simple estimate of disk radius is indicated by the lighter gray shaded region on the left side of Figure 8. Okazaki & Negueruela (2001) argue that the disks of Be stars in binaries with nearly circular orbits are truncated at the 3:1 orbital resonance radius, and this occurs at a distance from the Be star of that is only slightly larger than our disk half-light radius estimate.
We showed in §5 that the He I emission has an orbital modulation that leads to greatest emission strength when the hot subdwarf is in the foreground. Furthermore we found that the semiamplitude of the orbital Doppler shift of the emission peaks was larger than that of the subdwarf (from Fig. 7, km s-1 km s-1). These facts suggest that a significant fraction of the emission forms in the part of the disk near the subdwarf where the Keplerian velocity of the disk gas is larger than the orbital velocity of the subdwarf. Ignoring three-body effects, we can estimate the radius of the emission source by assuming both the disk gas and the subdwarf obey Keplerian motion around the Be star, or . This radius is about larger than the half-light radius, which suggests that the emission forms mainly along the outer rim of a disk that may be extended towards the hot subdwarf (see Fig. 8). We suspect that this outer disk region is heated by the combined effects of the incident subdwarf radiation and the impact of the subdwarf’s wind on the disk. We imagine that the rest of the disk also contributes to the line emission flux, and, for example, those times when weak emission is observed (see Fig. 7) may correspond to episodes when the gas density declines in the outer rim facing the subdwarf and the flux from the rest of the disk dominates.
Since the heated disk gas nearest the hot subdwarf will have a higher Keplerian velocity, the center of the heated region will move ahead of the axis joining the stars by an amount that depends on the cooling and orbital timescales. We can estimate the phase offset of this asymmetry in two ways. First, the central heated region should reach inferior conjunction about midway between the observed velocity extrema at phases and 0.17 (see Fig. 7), i.e., at . Second, the velocity peak separation is presumably caused by the heated region forming in a sector of a ring. We will observe the largest velocity separations when the mid-point of the ring segment is oriented along our line of sight. According to the peak separations plotted in Figure 7, greatest peak separations occur around and . This suggests that the apex of the heated rim is offset by about 0.06 in phase () ahead of the subdwarf inferior junction at . From simple geometric arguments, we expect that the maximum half-peak separation is related to the emission semiamplitude by , where is half the ring sector opening angle. From the values of peak separation in Table 5, we estimate km s-1 and . These values were used to plot a representative heated region in the darker gray shaded area of Figure 8. The actual extent of the heated ring is probably larger than shown since the separated emission peaks actually sample a range of ring azimuthal angles and not just the termination angles.
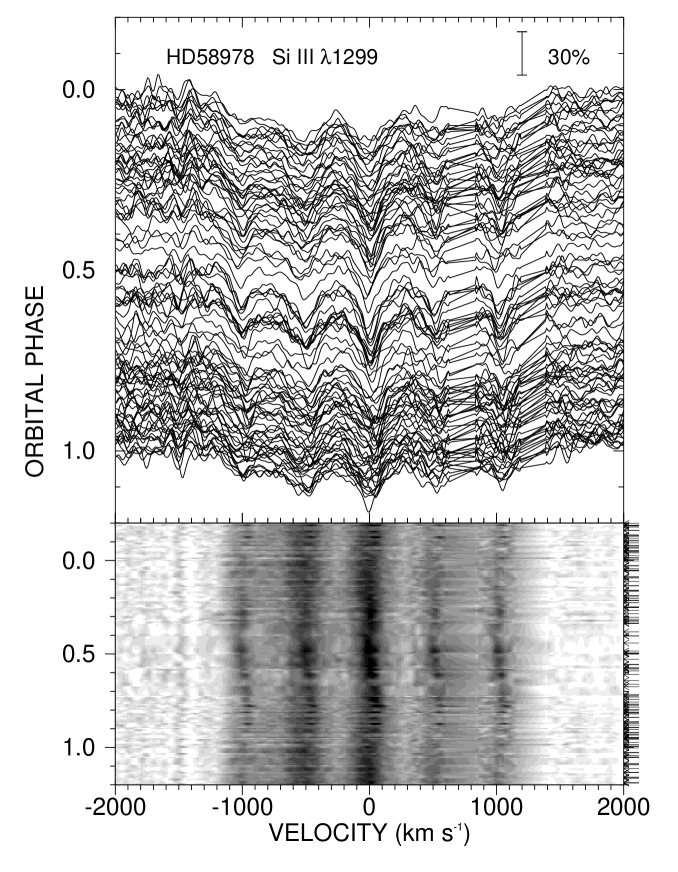
The subdwarf may also affect the kinematics of the gas motion in the disk rim. We show in Figure 9 the orbital phase variations in the appearance of the Si III lines near Si III . The cores of these lines are shell-type features formed in the disk gas seen in projection against the photosphere of the Be star. We see evidence that the shell feature broadens from to and apparently shifts from a redshifted to a blueshifted position at phases surrounding conjunction at . We imagine that the motion of the outer disk gas is influenced by subdwarf as the disk gas passes and overtakes the star. The gravitational attraction would cause acceleration and outward motion as the disk gas approaches the subdwarf, but the same forces would cause deceleration and inward motion following closest passage. Thus, we would observe infalling (redshifted) disk gas before and then outward moving (blueshifted) gas after . On the other hand, the disk gas projected against the Be star has more nearly Keplerian and tangential motion at leading to the appearance of narrow shell lines at that phase. This kind of perturbation in the Keplerian motions may also partially explain the appearance of a redshifted shell feature in the He I profiles near (Fig. 6), an orientation where the disk gas projected against the Be star would be infalling and relatively dense.
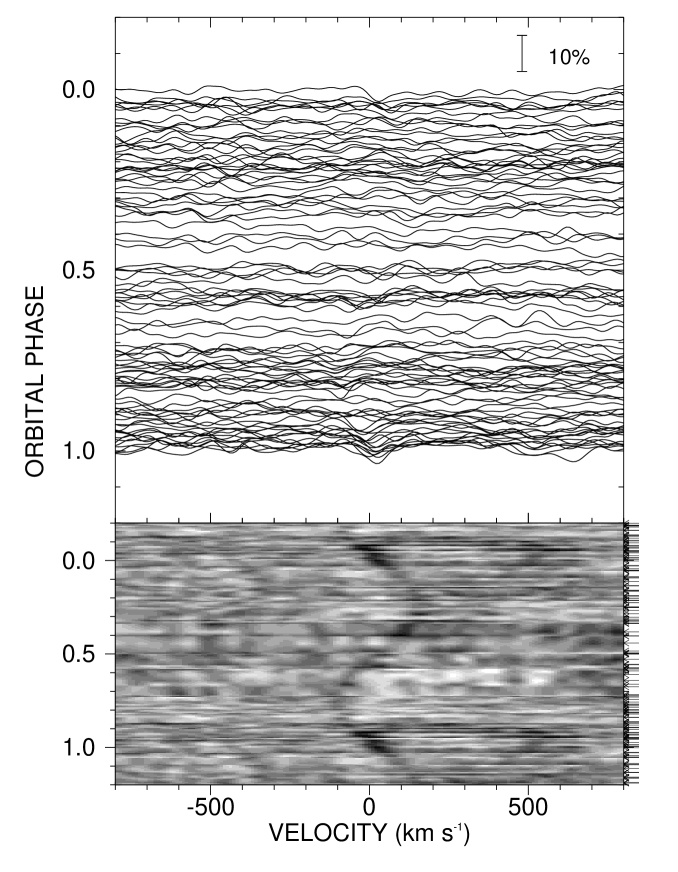
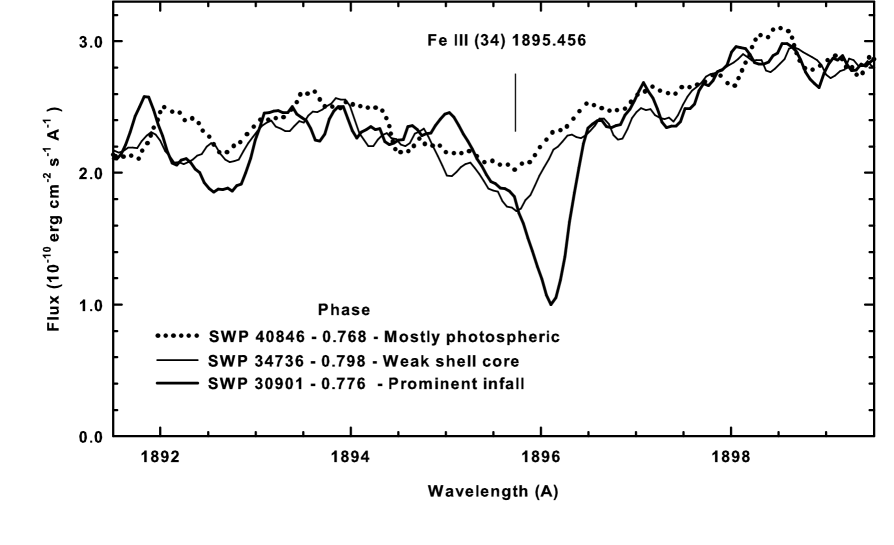
In addition to the shell features discussed above that predominantly are formed in the disk, another circumstellar component is seen in some intermediately-ionized species (e.g. S III, Fe III). These variable features, which rarely show velocities less than the photospheric value and can display velocities as large as 50 relative to the photosphere of the Be star, were discovered in IUE images obtained in the 1980s (Peters, 1988; Grady et al., 1988) and they clearly show the presence of significant infall of material toward the Be star. Often times these lines are asymmetric with enhanced absorption on the red side of the profile. Grady et al. (1988) identified six infall episodes that are best seen in the Fe III (multiplet 34) line at 1895.456 Å, since the feature does not have to compete with a strong photospheric component and it is not blended with interstellar or other circumstellar lines.
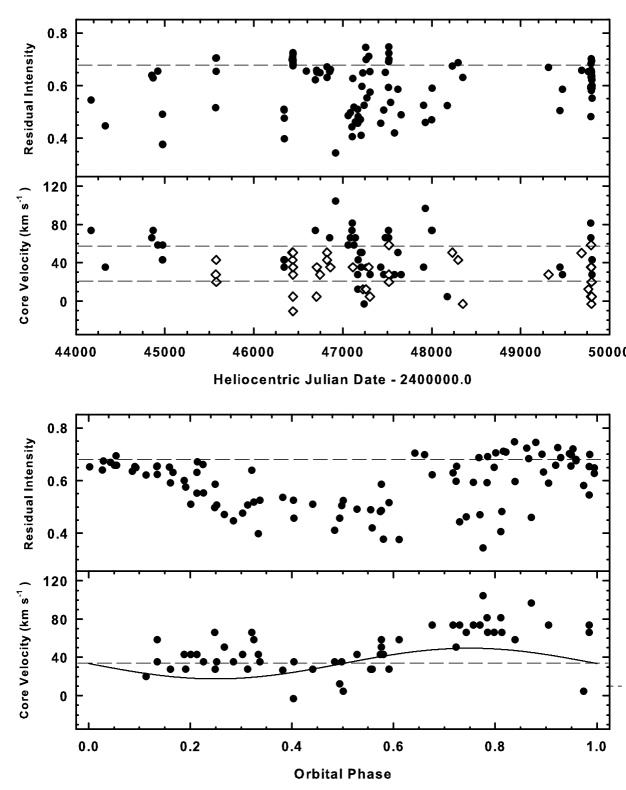
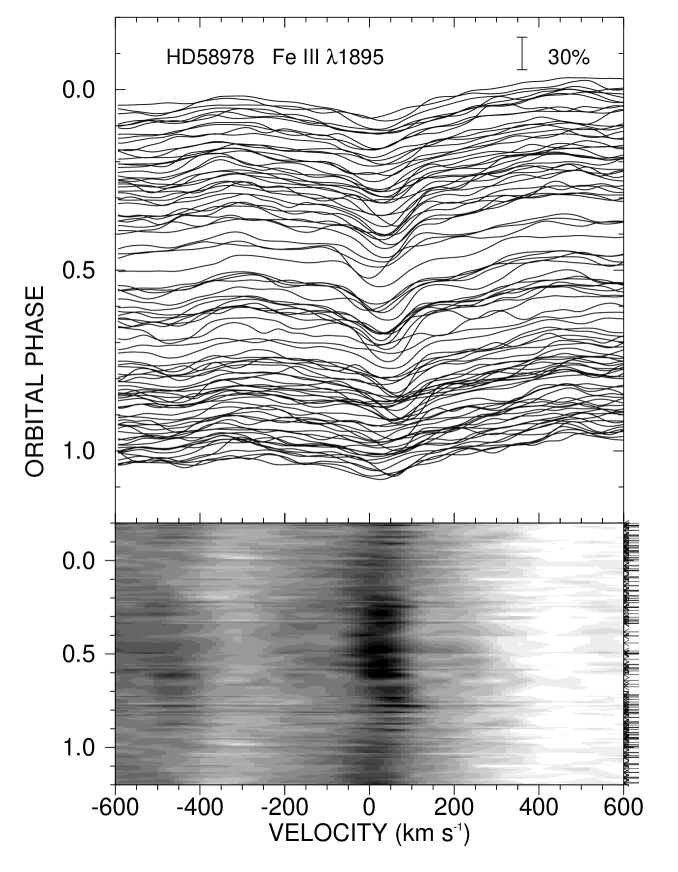
From the entire set of 97 IUE SWP high resolution (HIRES) images that span more than 15 years of observation and our knowledge of the orbit of the system, we now have more insight on the nature of the infall lines. Their behavior in strength and velocity are shown in Figures 10, 11, and 12. Representative examples of the three basic types of observed features, photospheric, photospheric with additional absorption from the Be star’s disk, and infall are given in Figure 10. In order to eliminate phase-dependent effects, we have chosen spectra taken at approximately the same quadrature phase on the trailing hemisphere of the Be star but at different epochs. Note that the central core of the profile taken during a period of enhanced disk absorption shows the same velocity as the photospheric line, but that the feature formed in infalling material has a significant redshift. In the upper two-part panel of Figure 11 we plot the residual intensity666The observed flux divided by the flux in the local continuum outside of the spectral feature. of the deepest part of the Fe III line and its radial velocity versus observation date. All data are included in the intensity plot, but in the velocity plot we use a different symbol for observations that show no, or minimal shell absorption. Points that fall above the dashed horizontal line in the upper panel visually appeared to be mostly photospheric. The double horizontal dashed lines in the second panel delineate the domain of photospheric motion. Features that fall above the double line are clearly associated with infall phases. Seven or eight clear infall episodes are observed. The data suggest that the duration of the infall phases varies from days to a year, but significant data gaps from 1979-85 and 1990-94 render it impossible to determine a firm value or its degree of variability. An apparently extended infall phase of about 300 days was seen from HJD 2446919–2447215. In the lower two panels of Figure 11, the same data are plotted versus orbital phase. From the third panel it can be seen that on the average the shell-type absorption is enhanced in the phase interval 0.3–0.7. But from the display in the fourth panel it is apparent that features seen around phase 0.5 tend to display the systemic velocity, implying they are formed in the disk of the Be star. In the fourth panel core velocities from only the spectra showing enhanced shell absorption are compared with the radial velocity curve of the Be star. It is clear that infall features with velocities up to 50 relative to the photosphere are seen at most phases with a minimal occurrence around phase 0.5. The infall features tend to cluster around the quadrature points at which their velocities are highest relative to the Be star’s photosphere. Many of the phase dependent strength and velocity variations discussed above can also be seen in the gray-scale plot presented in Figure 12.
The episodic infall of material is fundamentally different from that observed in the Algol-type binaries (Peters, 2001), where mass motion toward a mass gainer is typically seen only between phases 0.75–0.95. In the case of FY CMa, the infall features predominantly cluster around the quadrature phases from 0.15–0.35 and 0.65–0.90. The velocities of the shell features around phase 0.5 tend to be either photospheric or negative relative to the Be star777Evidence for material outflow is often seen in interacting binaries of the Algol type (Peters, 2001) and similar hydrodynamics might be occuring in this Be + subdwarf system.. Peters (1988) discussed various scenarios to explain the observed simultaneous presence of infall and outflow features in this system including a sudden accretion event, the possible presence of magnetic loops, or flow from a polar jet. Cao (2001) reported that infall components in the N V doublet were contemporaneously observed with those in He I and also suggested that magnetic loops might be involved, but the phase-dependence of the infall features does not support this speculation. The infall is more likely a consequence of an interaction between the wind from the subdwarf and the periphery of the massive disk of the Be star or disk perturbations due to the tidal force produced by the subdwarf. The motion of a shock-interaction region would result from variations in the location of the interface where there is a balance between the dynamic pressure of the subdwarf’s wind and the gas pressure at the periphery of the Be star’s disk. It is not clear at this time whether it is the subdwarf or the Be star that might be driving the variability though. Epochs when no enhanced shell absorption is observed would correspond to minimal wind-disk interaction. Alternatively the episodic infall features could simply be a result of gas dynamics in the disk due to a tidal effect from the subdwarf. Hydrodynamical simulations888cf. http://harmas.arc.hokkai-s-u.ac.jp/%7Eokazaki/BeX/sim/index.html of the gas motion in a perturbed disk in a Be/X-Ray binary (Okazaki et al., 2002) reveal turbulence in the outer disk and even the formation of spiral structure. Similar disk variability could be operating in FY CMa. The details are probably complex but an interplay of such gravitationally related forces could create time variable and sometimes coherent gas flows. For example, the tidal deformation of the disk leads to an axial elongation that moves ahead of the motion binary. Disk gas returning from the extended regions would be observed to be moving inwards when viewed at the quadrature phases.
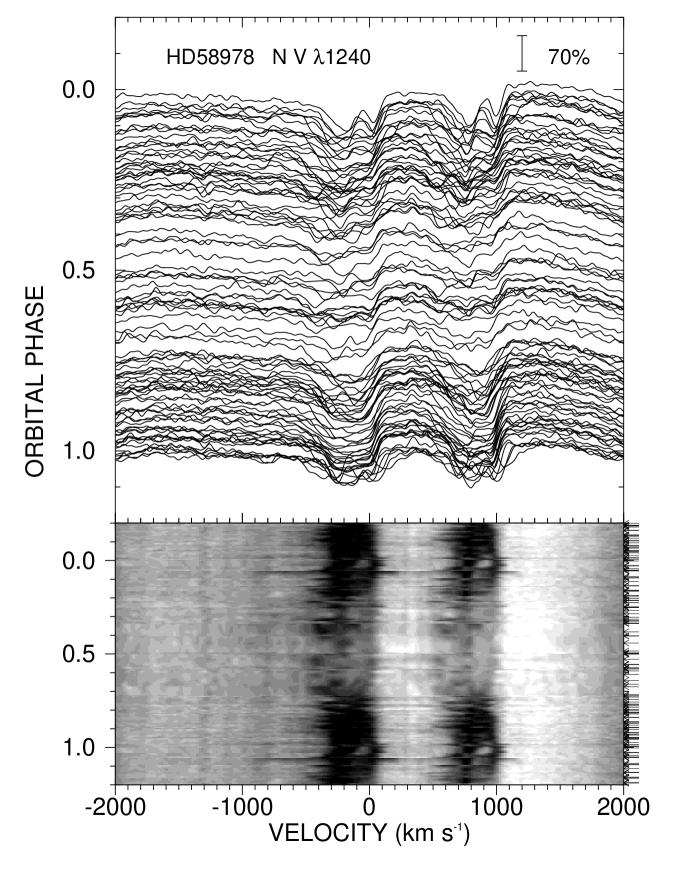
Finally, we return to the cyclic variation in the N V wind line that first led Rivinius et al. (2004) to find the orbital period of the binary. The plot of these variations in Figure 13 shows that the greatest extent of blueshifted absorption occurs around when the subdwarf is in the foreground. We note that such a strong N V wind feature is quite unusual for Be stars (Grady, Bjorkman, & Snow, 1987), and the orbital phasing suggests instead that the feature may form through absorption of the Be star’s flux by the wind of the hot subdwarf when it is in the foreground. The profile would mainly be affected by blueshifted wind absorption since any redshifted absorption component would probably by canceled by redshifted emission in the subdwarf’s wind. This kind of orbital wind variation is not seen in the other major wind line, the C IV doublet, and this may suggest that the subdwarf is N-enriched and C-depleted as expected for a star that has been stripped down to near the CNO-burning core. One problem with this explanation is that the largest wind speeds observed, km s-1, are much smaller than the wind terminal velocity of a few thousand km s-1 expected for a radiatively driven wind from the subdwarf (Lamers & Cassinelli, 1999). However, it may be that the wind optical depths are too small for absorption to occur at higher outflow velocities.
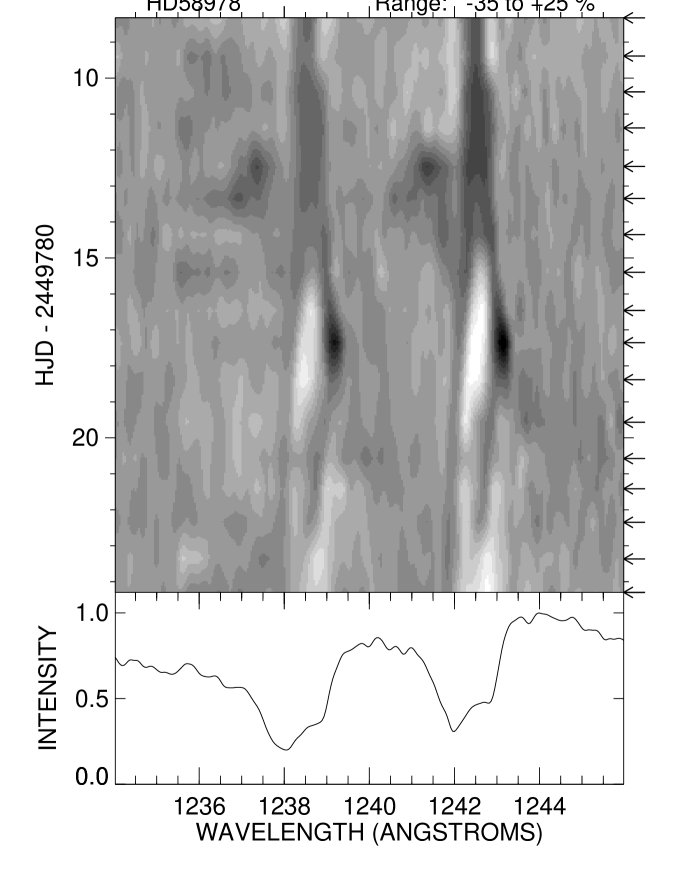
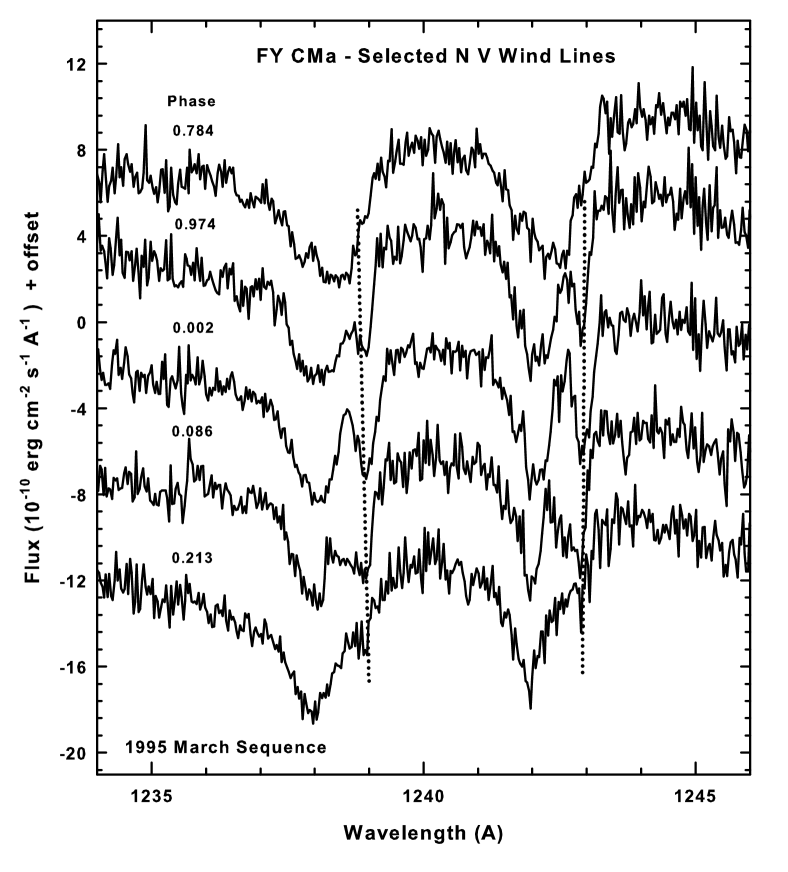
In 1995 March a sequence of daily IUE SWP HIRES spectra of FY CMa were obtained over the course of 16 days. Fortuitously these spectra were centered in time around orbital phase 0.0 and extended from phases 0.784 to 0.213. The temporal variations in the N V doublet are illustrated in a gray-scale diagram in Figure 14. More detail can be seen from the plot of selected observations shown in Figure 15. The N V features initially showed very little structure until a core with the velocity of the center-of-mass of the system appeared around phase 0.97. The core, still with no velocity shift, reached its greatest strength at conjunction. It broadened by phase 0.08, and had completely vanished by phase 0.21. The core is probably formed in a shock-heated region between the stars where the N-enhanced wind from the subdwarf collides with the disk of the Be star.
Our work demonstrates that FY CMa represents the third known case of a Be star with a hot subdwarf companion, the remains of an intense binary interaction that stripped down the mass donor to a tiny fraction of its original mass and left the mass gainer spinning rapidly. The subdwarf secondary in FY CMa has a mass that is close to the Chandrasekhar limit, and lacking a significant H-envelope, it may represent the progenitor of a supernova type SN Ibc. The system is now wide enough that it is unlikely that the Be star will be substantially spun down by tidal effects, so its rapid rotation will be important throughout its subsequent evolution. Such rapidly rotating massive stars may be related to the progenitors of collapsars and gamma-ray bursters (Cantiello et al., 2007).
References
- Abt et al. (2002) Abt, H. A., Levato, H., & Grosso, M. 2002, ApJ, 573, 359
- Bagnuolo et al. (1994) Bagnuolo, W. G., Jr., Gies, D. R., Hahula, M. E., Wiemker, R., & Wiggs, M. S. 1994, ApJ, 423, 446
- Cantiello et al. (2007) Cantiello, M., Yoon, S.-C., Langer, N., & Livio, M. 2007, A&A, 465, L29
- Cao (2001) Cao, H.-L. 2001, Chinese J. Astron. Astrophys., 1, 514
- Coe (2000) Coe, M. 2000, in The Be Phenomenon in Early-Type Stars, IAU Coll. 175 (ASP Conf. Proc. 214), ed. M. A. Smith, H. F. Henrichs, & J. Fabregat (San Francisco: ASP), 656
- Dray & Tout (2007) Dray, L. M., & Tout, C. A. 2007, MNRAS, 376, 61
- ESA (1997) ESA 1997, The Hipparcos Catalogue, ESA SP-1200 (Noordwijk: ESA)
- Frémat et al. (2005) Frémat, Y., Zorec, J., Hubert, A.-M., & Floquet, M. 2005, A&A, 440, 305
- Gies (2000) Gies, D. R. 2000, in The Be Phenomenon in Early-Type Stars, IAU Coll. 175 (ASP Conf. Proc. 214), ed. M. A. Smith, H. F. Henrichs, & J. Fabregat (San Francisco: ASP), 668
- Gies et al. (1998) Gies, D. R., Bagnuolo, W. G., Jr., Ferrara, E. C., Kaye, A. B., Thaller, M. L., Penny, L. R., & Peters, G. J. 1998, ApJ, 493, 440
- Grady et al. (1987) Grady, C. A., Bjorkman, K. S., & Snow, T. P. 1987, ApJ, 320, 376
- Grady et al. (1988) Grady, C. A., Peters, G. J., Bjorkman, K. S., & Henrichs, H. F. 1988, in A Decade of UV Astronomy with the IUE Satellite (ESA SP-281) (Paris: ESA), 1, 257
- Grundstrom & Gies (2006) Grundstrom, E. D., & Gies, D. R. 2006, ApJ, 651, L53
- Hanuschik (1996) Hanuschik, R. W. 1996, A&A, 308, 170
- Harmanec (1988) Harmanec, P. 1988, Bull. Astron. Inst. Cz., 39, no. 6, 329
- Hiltner et al. (1969) Hiltner, W. A., Garrison, R. F., & Schild, R. E. 1969, ApJ, 157, 313
- Hummel & Štefl (2001) Hummel, W., & Štefl, S. 2001, A&A, 368, 471
- Kaiser (1989) Kaiser, D. 1989, A&A, 222, 187
- Lamers & Cassinelli (1999) Lamers, H. J. G. L. M., & Cassinelli, J. P. 1999, Introduction to Stellar Winds (Cambridge: Cambridge Univ. Press)
- Lanz & Hubeny (2003) Lanz,T., & Hubeny, I. 2003, ApJS, 146, 417
- Maintz et al. (2005) Maintz, M., Rivinius, T., Stahl, O., Štefl, S., & Appenzeller, I. 2005, Publ. Astron. Inst. Cz., 93, 21
- Morbey & Brosterhus (1974) Morbey, C. L., & Brosterhus, E. B. 1974, PASP, 86, 455
- Okazaki et al. (2002) Okazaki, A. T., Bate, M. R., Ogilvie, G. I., & Pringle, J. E. 2002, MNRAS, 337, 967
- Okazaki & Negueruela (2001) Okazaki, A. T., & Negueruela, I. 2001, A&A, 377, 161
- Peters (1976) Peters, G. J. 1976, in Be and Shell Stars, IAU Symp. 70, ed. A. Slettebak (Dordrecht: Reidel), 69
- Peters (1982) Peters, G. J. 1982, in Be stars, IAU Symp. 98, ed. M. Jaschek & H.-G. Groth (Dordrecht: Reidel), 411
- Peters (1983) Peters, G. J. 1983, PASP, 95, 311
- Peters (1988) Peters, G. J. 1988, ApJ, 331, L33
- Peters (2001) Peters, G. J. 2001, in The Influence of Binaries on Stellar Population Studies, ed. D. Vanbeveren (Dordrecht: Kluwer), 79
- Petrovic et al. (2005) Petrovic, J., Langer, N., & van der Hucht, K. A. 2005, A&A, 435, 1013
- Pickering & Fleming (1905) Pickering, E. C., & Fleming, W. P. 1905, ApJ, 22, 87
- Pols et al. (1991) Pols, O. R., Coté, J., Waters, L. B. F. M., & Heise, J. 1991, A&A, 241, 419
- Porter & Rivinius (2003) Porter, J. M., & Rivinius, T. 2003, PASP, 115, 1153
- Rivinius et al. (2004) Rivinius, T., Štefl, S., Maintz, M., Stahl, O., & Baade, D. 2004, A&A, 427, 307
- Roberts et al. (1987) Roberts, D. H., Lehár, J., & Dreher, J. W. 1987, AJ, 93, 968
- Shafter et al. (1986) Shafter, A. W., Szkody, P., & Thorstensen, J. R. 1986, ApJ, 308, 765
- Slettebak (1982) Slettebak, A. 1982, ApJS, 50, 55
- Štefl et al. (2000) Štefl, S., Hummel, W., & Rivinius, T. 2000, A&A, 358, 208
- Sterken et al. (1996) Sterken, C., Vogt, N., & Mennickent, R. E. 1996, A&A, 311, 579
- Thaller et al. (1995) Thaller, M. L., Bagnuolo, W. G., Jr., Gies, D. R., & Penny, L. R. 1995, ApJ, 448, 878
- van Bever & Vanbeveren (1997) van Bever, J., & Vanbeveren, D. 1997, A&A, 322, 116
- Wade & Rucinski (1985) Wade, R. A., & Rucinski, S. M. 1985, A&AS, 60, 471
- Waters et al. (1991) Waters, L. B. F. M., Coté, J., & Pols, O. R. 1991, A&A, 250, 437
- Wellstein et al. (2001) Wellstein, S., Langer, N., & Braun, H. 2001, A&A, 369, 939
- Zucker (2003) Zucker, S. 2003, MNRAS, 342, 1291
| Dates | Besselian | Range | Resolving Power | Number of | Telescope/ |
|---|---|---|---|---|---|
| (HJD-2,400,000) | Year | (Å) | () | Spectra | Grating/Detector |
| 44170 – 49804 | 1979.8 – 1995.2 | 1200 – 1900 | 10000 | 97 | IUE/Echelle/SWP |
| 46123 | 1985.2 | 6477 – 6654 | 13000 | 1 | KPNO CF/B/TI3 |
| 46153 | 1985.2 | 6514 – 6691 | 13000 | 1 | KPNO CF/B/TI3 |
| 46735 | 1986.8 | 6511 – 6688 | 13000 | 1 | KPNO CF/B/TI3 |
| 46903 – 46906 | 1987.3 – 1987.3 | 6522 – 6698 | 13000 | 3 | KPNO CF/B/TI3 |
| 46918 – 46922 | 1987.3 – 1987.3 | 6520 – 6698 | 13000 | 6 | KPNO CF/B/TI3 |
| 47033 – 47034 | 1987.6 – 1987.7 | 6518 – 6695 | 13000 | 2 | KPNO CF/B/TI3 |
| 47303 – 47307 | 1988.4 – 1988.4 | 6517 – 6694 | 13000 | 9 | KPNO CF/B/TI3 |
| 47470 – 47473 | 1988.8 – 1988.9 | 6495 – 6717 | 11000 | 11 | KPNO CF/B/RCA2 |
| 47561 – 47562 | 1989.1 – 1989.1 | 6514 – 6690 | 14000 | 3 | KPNO CF/B/TI3 |
| 47637 – 47641 | 1989.3 – 1989.3 | 6520 – 6697 | 14000 | 4 | KPNO CF/B/TI3 |
| 47940 – 47941 | 1990.1 – 1990.1 | 6523 – 6699 | 14000 | 2 | KPNO CF/B/TI3 |
| 47982 – 47984 | 1990.2 – 1990.3 | 6520 – 6697 | 14000 | 2 | KPNO CF/B/TI3 |
| 48314 – 48315 | 1991.2 – 1991.2 | 6542 – 6690 | 18000 | 3 | KPNO CF/A/ST1K |
| 48319 – 48322 | 1991.2 – 1991.2 | 6520 – 6696 | 14000 | 4 | KPNO CF/B/TI3 |
| 48515 – 48517 | 1991.7 – 1991.7 | 6517 – 6693 | 14000 | 5 | KPNO CF/B/TI3 |
| 49058 – 49061 | 1993.2 – 1993.2 | 6384 – 6723 | 19000 | 3 | KPNO CF/A/T2KB |
| 49444 – 49448 | 1994.2 – 1994.3 | 6525 – 6693 | 18000 | 4 | KPNO CF/A/T1KA |
| 51123 – 51126 | 1998.8 – 1998.9 | 6359 – 6677 | 20000 | 4 | KPNO CF/A/F3KB |
| 51192 – 51197 | 1999.0 – 1999.0 | 6420 – 6737 | 20000 | 5 | KPNO CF/A/F3KB |
| 51502 – 51512 | 1999.9 – 1999.9 | 6415 – 6733 | 20000 | 16 | KPNO CF/A/F3KB |
| 51613 – 51614 | 2000.2 – 2000.2 | 6459 – 6776 | 20000 | 8 | KPNO CF/A/F3KB |
| 51615 – 51618 | 2000.2 – 2000.2 | 6413 – 6730 | 20000 | 9 | KPNO CF/A/F3KB |
| 51818 – 51831 | 2000.7 – 2000.8 | 6440 – 7105 | 9500 | 9 | KPNO CF/B/F3KB |
| 51850 – 51852 | 2000.8 – 2000.8 | 6413 – 6733 | 20000 | 7 | KPNO CF/A/F3KB |
| 51890 – 51902 | 2000.9 – 2001.0 | 6440 – 7105 | 9500 | 12 | KPNO CF/B/F3KB |
| 51914 – 51918 | 2001.0 – 2001.0 | 6432 – 6749 | 20000 | 18 | KPNO CF/A/F3KB |
| 53292 – 53295 | 2004.8 – 2004.8 | 6470 – 7140 | 9500 | 4 | KPNO CF/B/T2KB |
| 54021 – 54025 | 2006.8 – 2006.8 | 6473 – 7143 | 9500 | 2 | KPNO CF/B/T2KB |
| Date | UT | SWP | Orbital | ||||
|---|---|---|---|---|---|---|---|
| (HJD–2,400,000) | (yyyy-mm-dd) | Number | Phase | (km s-1) | (km s-1) | (km s-1) | (km s-1) |
| 44170.044 | 1979-10-23 | 6963 | 0.985 | ||||
| 44330.226 | 1980-03-31 | 8617 | 0.285 | ||||
| 44853.156 | 1981-09-05 | 14910 | 0.321 | ||||
| 44867.935 | 1981-09-20 | 15053 | 0.717 | ||||
| 44920.747 | 1981-11-12 | 15478 | 0.135 |
Note. — A machine readable version of the full Table 2 is available in the electronic edition of the Astrophysical Journal. A portion is shown here for guidance regarding its form and content.
| Element | H Wings | IUE ccfs |
|---|---|---|
| (days) | ||
| (HJD–2,448,000) | ||
| (km s-1) | ||
| (km s-1) | ||
| (km s-1) | ||
| (km s-1) | ||
| () | ||
| () | ||
| () | ||
| rms1 (km s-1) | 7.6 | 6.5 |
| rms2 (km s-1) | 14.5 |
| Parameter | Primary | Secondary |
|---|---|---|
| (kK) | ||
| (cgs) | ||
| (km s-1) | ||
| Date | Orbital | (H) | (H wings) | (He I peaks) | (He I peaks) |
|---|---|---|---|---|---|
| (HJD–2,400,000) | Phase | (Å) | (km s-1) | (km s-1) | (km s-1) |
| 46122.805 | 0.399 | ||||
| 46152.702 | 0.201 | ||||
| 46734.931 | 0.829 | ||||
| 46902.728 | 0.333 | ||||
| 46903.703 | 0.359 |
Note. — Table 5 is available in its entirely in the electronic edition of the Astrophysical Journal. A portion is shown here for guidance regarding its form and content.


ONLINE MATERIAL
Title: Detection of a Hot Subdwarf Companion to the Be Star FY CMa
Authors: G. J. Peters, D. R. Gies, E. D. Grundstrom, M. V. McSwain
Table: IUE Radial Velocity Measurements
================================================================================
Byte-by-byte Description of file: tab2.txt
--------------------------------------------------------------------------------
   Bytes Format Units Label  Explanations
--------------------------------------------------------------------------------
   1-  9 F9.3   d       Date   HJD-2400000
  11- 14 I4     --      Obs.y  Observation UT year
  16- 17 I2     --      Obs.m  Observation UT month
  19- 20 I2     --      Obs.d  Observation UT day
  21- 26 I6     --      SWP    IUE SWP number
  27- 32 F6.3   --      Phase  Orbital phase from Be star superior conjunction
  33- 38 F6.1   km/s    HRV1   Heliocentric radial velocity for Be star
  39- 44 F6.1   km/s    OMC1   Observed minus calculated velocity for Be star
  45- 51 A7     km/s    HRV2   Heliocentric radial velocity for subdwarf
  52- 57 A6     km/s    OMC2   Observed minus calculated velocity for subdwarf
--------------------------------------------------------------------------------
44170.044 1979-10-23  6963 0.985  51.5  16.6    1.6 -17.9
44330.226 1980-03-31  8617 0.285  23.9   4.4  159.8   3.4
44853.156 1981-09-05 14910 0.321  22.2   1.6  138.6  -8.4
44867.935 1981-09-20 15053 0.717  40.5  -7.3 -123.5 -29.2
44920.747 1981-11-12 15478 0.135  39.0  16.2    ?     ?
44972.649 1982-01-03 15933 0.528  36.8   0.7    ?     ?
44974.604 1982-01-05 15957 0.580  33.9  -6.7    ?     ?
44975.736 1982-01-06 15979 0.611  34.4  -8.5  -67.0 -16.0
45571.096 1983-08-24 20769 0.591  43.7   2.3  -48.6 -10.7
45573.015 1983-08-26 20805 0.642  52.5   7.6    ?     ?
45576.057 1983-08-29 20837 0.724  57.4   9.5 -105.8 -10.5
45578.924 1983-09-01 20874 0.801  50.7   3.4    ?     ?
46338.986 1985-09-30 26810 0.201  23.1   3.3  146.0  -7.5
46340.871 1985-10-02 26829 0.252   8.4 -10.8    ?     ?
46342.778 1985-10-04 26847 0.303  15.0  -5.0    ?     ?
46343.927 1985-10-05 26868 0.334  11.1 -10.0  142.2   0.2
46430.639 1985-12-31 27426 0.661  52.3   6.4  -74.0   3.7
46436.586 1986-01-06 27459 0.821  37.1  -9.5  -61.0  23.4
46440.366 1986-01-09 27479 0.923  40.8   0.4  -24.4   4.4
46440.609 1986-01-10 27484 0.929  34.0  -5.8  -16.1   8.0
46440.784 1986-01-10 27488 0.934  29.2 -10.3  -21.3  -0.7
46441.374 1986-01-10 27496 0.950  38.5   0.4    ?     ?
46441.513 1986-01-11 27499 0.953  35.5  -2.3    ?     ?
46441.720 1986-01-11 27504 0.959  36.6  -0.7   10.0  11.6
46590.362 1986-06-08 28457 0.949  41.6   3.4   -8.5   1.1
46691.971 1986-09-18 29238 0.676  49.1   2.6    ?     ?
46705.946 1986-10-02 29349 0.051  27.2  -1.9    ?     ?
46709.960 1986-10-06 29386 0.159  25.0   3.5    ?     ?
46744.776 1986-11-10 29646 0.093  29.0   3.4    ?     ?
46823.765 1987-01-28 30182 0.213  19.3  -0.2  145.4 -10.6
46823.786 1987-01-28 30183 0.214  20.7   1.2    ?     ?
46852.535 1987-02-26 30392 0.985  40.3   5.4   15.9  -3.6
46861.455 1987-03-06 30443 0.225  11.5  -7.8  163.1   5.3
46919.233 1987-05-03 30901 0.776  35.9 -12.0    ?     ?
47060.818 1987-09-22 31900 0.576  31.4  -8.8    ?     ?
47085.860 1987-10-17 32114 0.248  16.8  -2.4    ?     ?
47103.822 1987-11-04 32222 0.730  45.6  -2.3  -81.4  14.6
47106.832 1987-11-07 32265 0.811  47.1   0.1    ?     ?
47113.690 1987-11-14 32317 0.995  34.4   0.3   18.8  -8.4
47125.983 1987-11-26 32398 0.325  21.9   1.2    ?     ?
47141.568 1987-12-12 32505 0.743  48.7   0.7    ?     ?
47167.580 1988-01-07 32677 0.441  27.5  -0.9    ?     ?
47169.553 1988-01-09 32688 0.494  28.6  -4.5    ?     ?
47172.522 1988-01-12 32702 0.574  46.5   6.4  -25.6   0.7
47198.348 1988-02-06 32872 0.267  18.1  -1.1    ?     ?
47206.425 1988-02-14 32925 0.484  30.4  -1.8    ?     ?
47215.342 1988-02-23 32968 0.723  47.0  -0.9 -103.4  -8.2
47225.456 1988-03-04 33039 0.995  39.4   5.3   29.1   2.0
47240.674 1988-03-20 33119 0.403  27.7   2.3   92.9 -11.5
47258.449 1988-04-06 33221 0.880  42.9  -0.6  -69.2 -12.9
47262.396 1988-04-10 33245 0.986  29.1  -5.7   13.1  -7.2
47271.315 1988-04-19 33315 0.226  23.6   4.3  170.4  12.5
47293.289 1988-05-11 33508 0.816  47.9   1.0  -72.4  13.9
47305.145 1988-05-23 33616 0.134  17.1  -5.7    ?     ?
47307.279 1988-05-25 33640 0.191  10.7  -9.4  171.8  21.1
47426.980 1988-09-22 34288 0.404  29.6   4.2    ?     ?
47460.861 1988-10-26 34606 0.313  19.8  -0.5    ?     ?
47478.914 1988-11-13 34736 0.798  48.7   1.3    ?     ?
47514.647 1988-12-19 35074 0.757  38.1  -9.9 -110.3 -13.4
47515.683 1988-12-20 35082 0.785  55.1   7.4    ?     ?
47517.675 1988-12-22 35094 0.838  54.9   9.0    ?     ?
47518.576 1988-12-23 35101 0.862  36.4  -8.2    ?     ?
47519.662 1988-12-24 35112 0.892  38.4  -4.3    ?     ?
47537.921 1989-01-11 35320 0.382  18.1  -5.7  108.1  -9.9
47581.733 1989-02-24 35614 0.558  35.8  -2.9   27.8  42.0
47619.671 1989-04-03 35919 0.576  44.3   4.1  -17.7   9.9
47656.154 1989-05-09 36229 0.555  40.2   1.7    ?     ?
47908.837 1990-01-17 38034 0.337  18.9  -2.4    ?     ?
47928.730 1990-02-06 38148 0.871  44.4   0.3    ?     ?
47999.467 1990-04-17 38626 0.770  48.7   0.8 -103.3  -7.3
48004.512 1990-04-23 38655 0.905  43.1   1.4    ?     ?
48175.728 1990-10-11 39806 0.501  21.4 -12.3   42.8  12.3
48232.662 1990-12-07 40284 0.029  36.1   5.1   36.2 -18.3
48297.434 1991-02-09 40846 0.768  42.1  -5.9    ?     ?
48349.522 1991-04-03 41276 0.166  10.4 -10.7    ?     ?
49313.649 1993-11-22 49290 0.043  29.7  -0.0   67.6   1.8
49442.353 1994-03-30 50426 0.498  31.3  -2.1    ?     ?
49470.349 1994-04-27 50635 0.249  22.7   3.5    ?     ?
49686.641 1994-11-30 52938 0.055  29.0   0.3    ?     ?
49762.511 1995-02-14 53907 0.091  29.1   3.3   90.1 -10.7
49788.326 1995-03-11 54102 0.784  56.3   8.6 -100.7  -6.6
49789.386 1995-03-12 54111 0.813  54.9   7.9  -93.4  -6.2
49790.383 1995-03-13 54123 0.839  52.7   6.9  -92.8 -15.5
49791.385 1995-03-14 54134 0.866  45.9   1.5    ?     ?
49792.457 1995-03-15 54147 0.895  39.0  -3.5    ?     ?
49793.349 1995-03-16 54155 0.919  51.6  10.9    2.7  34.0
49794.351 1995-03-17 54163 0.946  46.0   7.6   26.9  38.4
49795.397 1995-03-18 54173 0.974  18.6 -17.4    ?     ?
49796.460 1995-03-19 54183 0.002  31.7  -1.7   32.8  -0.4
49797.356 1995-03-20 54187 0.027  20.9 -10.3   49.8  -2.7
49798.385 1995-03-21 54202 0.054  32.2   3.4   72.6  -1.4
49799.568 1995-03-23 54210 0.086  35.8   9.6   87.2  -9.9
49800.577 1995-03-24 54215 0.113  25.6   1.4    ?     ?
49801.415 1995-03-24 54220 0.135  35.6  12.9    ?     ?
49802.348 1995-03-25 54223 0.161  31.7  10.3  142.7   3.0
49803.365 1995-03-26 54230 0.188  20.1  -0.2    ?     ?
49804.296 1995-03-27 54238 0.213  23.5   3.9  154.1  -1.8
Title: Detection of a Hot Subdwarf Companion to the Be Star FY CMa
Authors: G. J. Peters, D. R. Gies, E. D. Grundstrom, M. V. McSwain
Table: Red Spectra Measurements
================================================================================
Byte-by-byte Description of file: tab5.txt
--------------------------------------------------------------------------------
   Bytes Format Units Label      Explanations
--------------------------------------------------------------------------------
   1-  9 F9.3   d       Date     HJD-2400000
  10- 15 F6.3   --      Phase    Orbital phase from Be star superior conjunction
  16- 22 F7.2   0.1nm   EQW      H-alpha equivalent width (Angstroms)
  23- 28 F6.1   km/s    HRV(HA)  Heliocentric radial velocity H-alpha wings
  29- 33 A5     km/s    HRV(HE)  Heliocentric radial velocity He I peaks
  34- 37 A4     km/s    DVR(HE)  He I peak velocity separation
--------------------------------------------------------------------------------
Note (1): HRV(HA) values omitted in Fig. 1 and in the orbital solution of
Table 3, column 2, for HJD-2400000 = 47639.671 and 47983.611.
--------------------------------------------------------------------------------
46122.805 0.399 -10.98  26.8   ?   ?
46152.702 0.201 -13.32  21.8  216  ?
46734.931 0.829 -11.22  71.1 -154  ?
46902.728 0.333 -11.76  30.2   ?   ?
46903.703 0.359 -12.39  25.2   ?   ?
46905.682 0.412 -13.46  34.7   ?   ?
46917.654 0.733 -13.94  56.7  -81  56
46918.676 0.761 -14.15  42.9  -88  81
46919.674 0.787 -13.37  56.3  -79  94
46920.675 0.814 -11.87  52.9  -75 102
46921.670 0.841 -11.76  46.4  -70 115
46921.684 0.841 -12.86  43.3  -70 120
47033.012 0.830  -8.52  62.2  -68 107
47034.004 0.856 -12.34  53.6  -63 113
47302.650 0.067 -15.87  33.1   ?   ?
47303.636 0.093 -15.65  32.5  143  ?
47303.642 0.093 -14.93  40.4  147  ?
47304.622 0.120 -13.67  35.4  160  ?
47304.631 0.120 -14.61  39.6  158  ?
47305.623 0.147 -11.51  45.5  171  ?
47305.633 0.147 -13.28  42.0  171  ?
47306.622 0.173 -10.57  44.4  173  ?
47306.632 0.174 -12.96  41.2  175  ?
47469.823 0.554 -13.56  49.0  -94  ?
47469.831 0.554 -13.43  47.0  -99  ?
47469.914 0.556 -13.15  52.8  -98  ?
47469.997 0.559 -13.47  54.1  -92  ?
47470.026 0.559 -13.63  54.6  -96  ?
47470.826 0.581 -11.53  57.0 -100  ?
47471.014 0.586 -11.66  54.7 -107  ?
47471.846 0.608 -11.87  57.9 -111  ?
47471.995 0.612 -12.00  62.8 -124  ?
47472.848 0.635 -11.39  66.6 -128  ?
47473.033 0.640 -11.66  66.3 -132  ?
47560.654 0.992 -11.66  49.9   ?   ?
47561.681 0.019 -15.26  46.5   ?   ?
47561.792 0.022 -14.90  46.4   ?   ?
47636.683 0.033 -10.94  36.0   ?   ?
47639.671 0.113 -10.92 -13.9  203  ?
47639.680 0.113 -11.53  33.1  207  ?
47640.635 0.139 -12.13  32.1  207  ?
47939.622 0.164 -10.96  18.8  226  ?
47940.860 0.197 -11.92  10.1  233  ?
47981.708 0.293  -5.32  10.3   ?   ?
47983.611 0.344 -10.74   4.4   ?   ?
48313.702 0.204 -13.26  28.5   ?   ?
48313.788 0.207 -13.20  29.4  175  ?
48314.619 0.229 -12.31  35.4  173  ?
48318.615 0.336 -12.59  20.8  138 113
48319.800 0.368 -15.66  26.3  122 124
48320.616 0.390 -12.22  26.3  113 132
48321.610 0.416 -12.08  43.9  113 137
48514.969 0.606 -12.09  50.5  -66  ?
48515.030 0.608 -10.42  53.9  -68  ?
48515.972 0.633 -11.30  58.2  -96  ?
48516.017 0.634 -11.93  53.9  -92  ?
48517.021 0.661 -12.21  58.6   ?   ?
49058.749 0.202 -14.58  34.4  179  ?
49061.769 0.283 -14.06  39.0  162  94
49061.773 0.283 -15.28  30.5  160  94
49443.771 0.536 -14.61  42.9  -52  ?
49444.729 0.562 -10.59  49.0  -68  ?
49445.749 0.589 -10.22  52.3  -77  ?
49447.755 0.643 -13.23  51.7  -96  ?
51123.027 0.608 -16.17  52.1   ?   ?
51123.034 0.609 -15.94  53.7   ?   ?
51124.020 0.635 -16.40  56.9   ?   ?
51126.033 0.689 -16.83  55.3   ?   ?
51191.897 0.457 -13.75  41.1   ?   ?
51192.937 0.485 -14.95  41.7   ?   ?
51193.927 0.512 -13.53  46.0   ?   ?
51196.937 0.592 -13.35  53.9  -68  ?
51197.933 0.619 -14.21  55.1  -73  ?
51502.936 0.806 -13.04  59.8 -141  ?
51503.977 0.833 -14.12  59.4 -137  ?
51504.994 0.861 -13.71  57.7 -112  ?
51506.025 0.888 -13.94  54.6 -132  ?
51507.019 0.915 -14.53  49.8 -130  ?
51508.023 0.942 -14.07  47.1  -53 124
51509.013 0.969 -13.77  46.8  -14 100
51510.006 0.995 -15.13  46.0   -6 120
51510.053 0.997 -15.52  44.6   -2 111
51510.798 0.017 -15.91  43.7   72  ?
51510.847 0.018 -15.76  42.2   73  ?
51510.918 0.020 -15.41  44.6   78  ?
51510.969 0.021 -15.33  43.5   83  ?
51511.946 0.047 -16.08  40.7   97  ?
51512.015 0.049 -15.34  41.3   98  ?
51512.037 0.050 -15.39  40.7  100  ?
51612.632 0.750 -12.91  69.1 -162  ?
51612.693 0.751 -13.83  69.8 -160  ?
51612.802 0.754 -12.84  69.0 -159  ?
51612.822 0.755 -11.87  66.8 -154  ?
51613.617 0.776 -12.95  66.5 -157  ?
51613.703 0.779 -12.81  67.5 -152  ?
51613.712 0.779 -13.04  67.3 -160  ?
51613.751 0.780 -13.07  69.2 -158  ?
51614.612 0.803 -13.18  69.5 -156  ?
51614.829 0.809 -13.68  69.7 -160  ?
51615.607 0.830 -13.24  68.1 -158  ?
51615.717 0.833 -13.08  67.0 -160  ?
51615.759 0.834 -14.07  67.1 -160  ?
51615.801 0.835 -14.01  65.8 -152  ?
51615.842 0.836 -14.39  65.8 -146  ?
51616.623 0.857 -14.39  60.0 -163  ?
51617.608 0.883 -13.96  58.7 -138  ?
51817.984 0.262 -13.96  35.3  193  ?
51818.977 0.288 -14.02  33.6  158  77
51819.980 0.315 -14.27  35.5  144  96
51820.996 0.342 -14.20  37.9  140 100
51821.996 0.369 -13.28  40.9  140 117
51822.982 0.396 -14.00  44.4  133 122
51823.971 0.422 -13.46  46.9  131 126
51824.981 0.449 -12.68  53.2  123 126
51830.997 0.611 -14.50  57.6  -96  ?
51849.861 0.117 -15.69  43.4  175  ?
51849.914 0.119 -15.47  40.1  179  ?
51849.961 0.120 -14.25  39.9  177  ?
51851.046 0.149 -17.06  39.3  181  ?
51851.055 0.149 -16.71  40.9  183  ?
51851.839 0.170 -16.05  38.9  184  ?
51851.854 0.171 -15.72  35.1  184  ?
51889.975 0.194 -15.07  29.4  187  ?
51890.901 0.219 -14.71  34.3  203  ?
51892.904 0.273 -14.60  31.6  195  ?
51893.902 0.299 -14.78  32.1  161  83
51894.901 0.326 -14.63  35.1  147  98
51895.969 0.355 -14.29  40.9  144 122
51896.942 0.381 -14.66  40.7  131 135
51897.937 0.408 -14.56  46.4  126 141
51898.948 0.435 -14.27  44.7  116 135
51899.942 0.461 -13.67  48.4  127 143
51900.935 0.488 -13.71  53.7  112 160
51901.944 0.515 -13.92  51.0   11  ?
51913.671 0.830 -13.54  72.2 -160  ?
51913.717 0.831 -13.25  72.8 -164  ?
51913.761 0.832 -13.98  72.2 -160  ?
51913.807 0.834 -14.11  72.6 -162  ?
51913.831 0.834 -14.14  71.6 -160  ?
51913.851 0.835 -14.19  71.5 -162  ?
51913.931 0.837 -13.91  72.0 -160  ?
51913.969 0.838 -13.81  69.8 -160  ?
51914.014 0.839 -12.79  69.0 -159  ?
51914.706 0.858 -14.23  66.8 -158  ?
51914.808 0.860 -14.34  68.7 -157  ?
51915.693 0.884 -13.88  66.5 -154  ?
51915.709 0.885 -13.94  66.8 -152  ?
51915.766 0.886 -13.82  67.5 -151  ?
51916.919 0.917 -14.32  64.7 -147  ?
51916.960 0.918 -14.32  60.8 -147  ?
51916.976 0.919 -14.22  60.9 -152  ?
51917.757 0.940 -13.90  57.3 -144  ?
53291.988 0.825 -15.21  52.0  -73  98
53293.014 0.853 -15.12  49.4  -64 107
53294.994 0.906 -15.09  41.1  -43 132
53294.996 0.906 -15.00  38.1  -45 132
54020.984 0.392 -13.53  31.7   ?   ?
54024.967 0.499 -13.95  39.9   ?   ?