11institutetext: Fundación Galileo Galilei – INAF, Rambla José Ana Fernández Perez 7, E–38712 Breña Baja (San Antonio), Canary Islands, Spain
22institutetext: Dipartimento di Astronomia, Università degli Studi di Trieste, via Tiepolo 11, I–34143 Trieste, Italy
33institutetext: Instituto de Astrofisica de Canarias, C/Via Lactea s/n, E–38205 La Laguna, Tenerife, Canary Islands, Spain
44institutetext: INAF – Osservatorio Astronomico di Trieste, via Tiepolo 11, I–34143 Trieste, Italy
55institutetext: Centre for Astrophysics & Supercomputing, Swinburne University, Hawthorn, VIC 3122, Australia

Optical analysis of the poor clusters
Abell 610, Abell 725, and Abell 796,
containing diffuse radio sources

W. Boschin 1122    R. Barrena 33    M. Girardi 2244    M. Spolaor 2255
(Received / accepted )
Abstract

Context.

Aims. We study the dynamical status of the poor, low X–ray luminous galaxy clusters Abell 610, Abell 725, and Abell 796 (at z=0.1𝑧0.1z=0.1, 0.09, and 0.16, respectively), containing diffuse radio sources (relic, relic, and possible halo, respectively).

Methods. Our analysis is based on new spectroscopic data obtained at the William Herschel Telescope for 158 galaxies, new photometry obtained at the Isaac Newton Telescope with the addition of data recovered from the Data Release 5 of the Sloan Digital Sky Survey. We use statistical tools to select 57, 36, and 26 cluster members and to analyze the kinematics of cluster galaxies, as well as to study the 2D cluster structure.

Results. The low values we compute for the global line–of–sight velocity dispersion of galaxies (σV=420700subscript𝜎V420700\sigma_{\rm V}=420-700 km s-1) confirm that these clusters are low–mass clusters. Abell 610 shows a lot of evidence of substructure. It seems to be formed by two structures separated by 700similar-toabsent700\sim 700 km s11{}^{-1}\;in the cluster rest–frame, having comparable σV200similar-tosubscript𝜎V200\sigma_{\rm V}\sim 200 km s11{}^{-1}\;and likely causing a velocity gradient. The velocity of the brightest cluster member (BCMI; a bright radio source) is very close to the mean velocity of the higher velocity structure. A third small, low–velocity group hosts the second brightest cluster member (BCMII). The analysis of the 2D galaxy distribution shows a bimodal distribution in the core elongated in the SE–NW direction and likely associated to BCMI and BCMII groups. Abell 725 and Abell 796, which are less sampled, show marginal evidence of substructure in the velocity space. They are elongated in the 2D galaxy distribution. For both Abell 610 and Abell 725 we shortly discuss the possible connection with the hosted diffuse radio relic.

Conclusions. Our results show that relic radio sources are likely connected with merger events, but are not limited to massive clusters. About the possible halo source in Abell 796, there is some evidence of a merger event in this non–massive cluster, but a pointed radio observation is necessary to confirm this halo.

Key Words.:
Galaxies: clusters: general – Galaxies: clusters: individual: Abell 610, Abell 725, Abell 796 – Galaxies: distances and redshifts – Cosmology: observations
offprints: W. Boschin; e.mail: boschin@tng.iac.es

1 Introduction

Clusters of galaxies are not recognized as simple relaxed structures, but rather as evolving via merging processes in a hierarchical fashion from poor groups to rich clusters. A recent aspect of these investigations is the possible connection of cluster mergers with the presence of extended, diffuse radio sources: halos and relics. These radio sources are large (up to 1similar-toabsent1\sim 1 h701superscriptsubscript701h_{70}^{-1} Mpc), amorphous cluster sources of uncertain origin and generally steep radio spectra (Hanisch han82 (1982); see also Giovannini & Feretti gio02 (2002) for a more recent review). They are rare sources that appear to be associated with very rich clusters that have undergone recent mergers. Therefore, it has been suggested by various authors that cluster halos/relics are related to recent merger activity (e.g., Tribble tri93 (1993); Burns et al. bur94 (1994); Feretti fer99 (1999)).

The synchrotron radio emission of halos and relics demonstrates the existence of large scale cluster magnetic fields, of the order of 0.1–1 μ𝜇\muG, and of widespread relativistic particles of energy density 10-14 – 10-13 erg cm-3. The difficulty in explaining radio halos/relics arises from the combination of their large size and the short synchrotron lifetime of relativistic electrons. The expected diffusion velocity of the electron population is of the order of the Alfven speed (similar-to\sim100 km s-1), making it difficult for the electrons to diffuse over a megaparsec–scale region within their radiative lifetime. Therefore, one needs a mechanism by which the relativistic electron population can be transported over large distances in a short time, or a mechanism by which the local electron population is reaccelerated and the local magnetic fields are amplified over an extended region. The cluster–cluster merger can potentially supply both mechanisms (e.g., Giovannini et al. gio93 (1993); Burns et al. bur94 (1994); Röttgering et al. rot94 (1994); see also Feretti et al. fer02a (2002); Sarazin sar02 (2002) for reviews). However, the question is still debated since the diffuse radio sources are quite uncommon and only recently have we been able to study these phenomena on the basis of sufficient statistics (few dozen clusters up to z0.3similar-to𝑧0.3z\sim 0.3, e.g., Giovannini et al. gio99 (1999); see also Giovannini & Feretti gio02 (2002); Feretti fer05 (2005)).

Growing evidence of the connection between diffuse radio emission and cluster merging is based on X–ray data (e.g., Böhringer & Schuecker boh02 (2002); Buote buo02 (2002)). Studies based on a large number of clusters have found a significant relation between the radio and the X–ray surface brightness (Govoni et al. 2001a , 2001b ) and between the presence of radio halos/relics and irregular and bimodal X–ray surface brightness distribution (Schuecker et al. sch01 (2001)).

Optical data are a powerful way to investigate the presence and the dynamics of cluster mergers, too (e.g., Girardi & Biviano gir02 (2002)). The spatial and kinematical analysis of member galaxies allow us to detect and measure the amount of substructure, to identify and analyze possible pre–merging clumps or merger remnants. This optical information is complementary to X–ray information since galaxies and intracluster medium react on different timescales during a merger (see, e.g., numerical simulations by Roettiger et al. roe97 (1997)). Unfortunately, to date optical data are lacking or are poorly exploited to investigate the phenomenon of diffuse radio sources. The sparse literature contains a few individual clusters (e.g., Barrena et al. bar02 (2002); Mercurio et al. mer03 (2003); Maurogordato et al. mau08 (2008)).

In this context, we are conducting an intensive observational and data analysis program to study the internal dynamics of radio clusters by using member galaxies. Clusters already analyzed are: Abell 2219 (Boschin et al. bos04 (2004)); Abell 2744 (Boschin et al. bos06 (2006)); Abell 697 (Girardi et al. gir06 (2006)); Abell 773 (Barrena et al. 2007a ); Abell 115 (Barrena et al. 2007b ). These are all massive clusters and, indeed, to date analyzed clusters containing a radio halo or a relic source have a large gravitational mass (larger than 0.70.70.7 ×1015h701Mabsentsuperscript1015superscriptsubscript701subscript𝑀direct-product\times 10^{15}\;h_{70}^{-1}\;M_{\odot}\;within 2h701superscriptsubscript701h_{70}^{-1} Mpc; see Giovannini & Feretti gio02 (2002)). From the theoretical point of view, a large mass is an expected property in radio clusters since the energy available to accelerate relativistic particles in a merger scales as M2similar-toabsentsuperscript𝑀2\sim M^{2}, as discussed by Buote (buo01 (2001)).

In this paper, we report our results about three poor Abell clusters: Abell 610, Abell 725, and Abell 796 (hereafter A610, A725, and A796) having Abell richness (i.e., the number of galaxies within 1 Abell radius and magnitude between m3subscript𝑚3m_{3} and m3+2subscript𝑚32m_{3}+2; see Abell et al. abe89 (1989)) of 46, 36, and 56 galaxies respectively. These clusters contain a radio relic or a (possible) radio halo. In particular, A610 exhibits a relic source confirmed by pointed observations (Giovannini & Feretti gio00 (2000)); A725 presents a relic source well visible in survey data (Kempner & Sarazin kem01 (2001)); and A796 possibly hosts a halo source visible in survey data (Kempner & Sarazin kem01 (2001)) which needs to be confirmed. To date, no measure of internal velocity dispersion and/or X–ray temperature have been reported in the literature. We have recently carried out spectroscopic observations with the William Herschel Telescope giving new redshift data for 158 galaxies in the field of these clusters, as well as photometric observations at the Isaac Newton Telescope for A725. We recover additional photometric and spectroscopic information from the Data Release 5 of the Sloan Digital Sky Survey (SDSS DR5).

The paper is organized as follows. We present the new optical data in Sect. 2. We present the relevant analyses and conclusions in Sects. 3, 4, and 5 for A610, A725, and A796, respectively. We summarize and discuss our results in Sect. 6.

Unless otherwise stated, we give errors at the 68% confidence level (hereafter c.l.). Throughout the paper, we assume a flat cosmology with Ωm=0.3subscriptΩm0.3\Omega_{\rm m}=0.3, ΩΛ=0.7subscriptΩΛ0.7\Omega_{\Lambda}=0.7 and H0=70subscript𝐻070H_{0}=70 h70subscript70h_{70} km s11{}^{-1}\;Mpc-1. For this cosmological model, 1\mathrm{{}^{\prime}}\;corresponds to 108, 102, and 163 h701superscriptsubscript701h_{70}^{-1} kpc at the A610, A725, and A796 redshift.

2 Data sample

2.1 Spectroscopy

We carried out multi–object spectroscopic observations of A610, A725, and A796 in November 2004 and January 2005. We used AF2/WYFFOS, the multi–object, wide–field, fiber spectrograph working at the prime focus of the 4.2 m William Herschel Telescope (WHT, Island of La Palma, Spain). This spectrograph is equipped with optical fibers each of 1.6 arcsec diameter. We used the grism R300B in combination with the 2–chip EEV 4K×\times4K pixel mosaic (pixel size 13.5 μ𝜇\mum) working in binning 2×\times2. In the case of A610 and A725, we acquired two exposures of 1800 s for two fiber configurations, in the case of A796 we acquired three exposures of 1800 s for two fiber configurations. We performed wavelength calibration with the helium lamp. Reduction of spectroscopic data was carried out with the IRAF package. 111IRAF is distributed by the National Optical Astronomy Observatories, which are operated by the Association of Universities for Research in Astronomy, Inc., under cooperative agreement with the National Science Foundation.

We determined radial velocities with the cross–correlation technique (Tonry & Davis ton79 (1979)) implemented in the RVSAO package (developed at the Smithsonian Astrophysical Observatory Telescope Data Center). Each spectrum was correlated against six templates for a variety of galaxy spectral types: E, S0, Sa, Sb, Sc and Ir (Kennicutt ken92 (1992)). The template producing the highest value of \cal R, i.e., the parameter given by RVSAO and related to the signal–to–noise of the correlation peak, was chosen. Moreover, all the spectra and their best correlation functions were examined visually to verify the redshift determination. In one case (galaxy ID 127 of A610, see Table 1), we took the EMSAO redshift as a reliable estimate of the redshift. We obtained redshifts for 62, 51, 45 galaxies for A610, A725, A796.

For ten galaxies we obtained two redshift determinations of similar quality. This allows us to obtain a more rigorous estimate for the redshift errors since the nominal errors as given by the cross–correlation are known to be smaller than the true errors (e.g., Malumuth et al. mal92 (1992); Bardelli et al. bar94 (1994); Ellingson & Yee ell94 (1994); Quintana et al. qui00 (2000)). For these ten galaxies we fit the first determination vs. the second one by using a straight line and considering errors in both coordinates (e.g., Press et al. pre92 (1992)). The fitted line agrees with the one–to–one relation, but, when using the nominal cross–correlation errors, the small value of the χ2superscript𝜒2\chi^{2} probability indicates a poor fit, suggesting the errors are underestimated. Only when nominal errors are multiplied by a factor of similar-to\sim1.3 can the observed scatter be justified. We therefore assume hereafter that true errors are larger than nominal cross–correlation errors by a factor 1.3. For the ten galaxies we used the weighted mean of the two redshift determinations and the corresponding error.

For A610 and A796 we add galaxies with spectroscopic and/or photometric data found in the SDSS DR5. For A610, we find 147 galaxies within a radius of 30\mathrm{{}^{\prime}}\;from the cluster center given by Abell et al. (abe89 (1989)). This radius is about the double of that sampled by our data and well larger than the virial radius of the cluster (see Sect. 3.1), and thus will be useful to study the cluster periphery, too. Out of 147 SDSS galaxies, 44 are in common with our WHT galaxies. We fit SDSS redshift determination vs. our determination finding that the fitted line well agrees with the one–to–one relation. Again, the small value of the χ2superscript𝜒2\chi^{2} probability indicates a poor fit, suggesting the errors are underestimated, but we prefer to not apply any correction since the measurements come from two different sources. We combine WHT and SDSS data using the weighted mean of the two redshift determinations and the corresponding error. Our final spectroscopic catalog consists of 165 galaxies. As for A796, we find 72 SDSS galaxies – out of which there are 18 in common with our WHT galaxies – and compile a final spectroscopic catalog of 99 galaxies.

2.2 Photometry

Our photometric observations were carried out with the Wide Field Camera (WFC), mounted at the prime focus of the 2.5 m Isaac Newton Telescope (INT, Island of La Palma, Spain). We observed A725 in December 2004 in photometric conditions with a seeing of about 1.8\mathrm{{}^{\prime}}\hskip-1.00006pt\mathrm{{}^{\prime}}\;in RHsubscript𝑅HR_{\rm H} (Harris) band and 2.5\mathrm{{}^{\prime}}\hskip-1.00006pt\mathrm{{}^{\prime}}\;in BHsubscript𝐵HB_{\rm H}.

The WFC consists of a four–CCD mosaic covering a 33×\times33\mathrm{{}^{\prime}}\;field of view, with only a 20% marginally vignetted area. We took 9 exposures of 720 s in BHsubscript𝐵HB_{\rm H} and another 13 exposures of 360 s in RHsubscript𝑅HR_{\rm H} filters (a total of 6480 s and 4680 s in the two bands, respectively). We developed a dithering pattern to build a “supersky” frame that was used to correct our images for fringing patterns (Gullixson gul92 (1992)). In addition, the dithering helped us to clean cosmic rays and avoid gaps between the CCDs in the final images. The complete reduction process (including flat fielding, bias subtraction, and bad–column elimination) yielded a final coadded image where the variation of the sky was lower than 1.0% within a region of 13\mathrm{{}^{\prime}}\;radius from the center of the cluster.

In order to match the photometry of several filters, a good astrometric solution is needed. The astrometry has to take into account the field distortions present in the WFC full frame. Using IRAF tasks and taking as a reference the USNO B1.0 catalog, we were able to find an accurate astrometric solution (rms similar-to\sim 0.5\mathrm{{}^{\prime}}\hskip-1.00006pt\mathrm{{}^{\prime}}) across the full frame.

We performed the photometric calibration with Landolt standard fields observed in December 2007 using the 80 cm telescope at Teide Observatory. We finally identified galaxies in our BHsubscript𝐵HB_{\rm H} and RHsubscript𝑅HR_{\rm H} images and measured their magnitudes with the SExtractor package (Bertin & Arnouts ber96 (1996)) and the AUTOMAG procedure. In a few cases (e.g., objects close to very bright and saturated stars) the standard SExtractor photometric procedure failed. In these cases, by performing an isophotal analysis (task bmodel in IRAF) we eliminate the bright objects. Then, we reran SExtractor to estimate the magnitudes of faint targets close to bright stars.

We transformed all Harris magnitudes into the Johnson–Cousins system (Johnson & Morgan joh53 (1953); Cousins cou76 (1976)). We used B=BH+0.13𝐵subscript𝐵H0.13B=B\rm_{H}+0.13 and R=RH𝑅subscript𝑅HR=R\rm_{H} as derived from the Harris filter characterization (http://www.ast.cam.ac.uk/similar-to\simwfcsur/technical/photom/colours/) and assuming a BV1.0similar-to𝐵𝑉1.0B-V\sim 1.0 for E–type galaxies (Poggianti pog97 (1997)). As a final step, we estimated and corrected the galactic extinction AB0.23similar-tosubscript𝐴𝐵0.23A_{B}\sim 0.23, AR0.14similar-tosubscript𝐴𝑅0.14A_{R}\sim 0.14 and E(BV)=0.05𝐸𝐵𝑉0.05E(B-V)=0.05 from Burstein & Heiles’s (bur82 (1982)) reddening maps.

The photometric sample of galaxies in the field of A725 is complete down to B=22.5𝐵22.5B=22.5 (24.4) and R=20.6𝑅20.6R=20.6 (22.1) for S/N=5𝑆𝑁5S/N=5 (3) within a square region of 33×\times33\mathrm{{}^{\prime}}\;centered on R.A.=09h00m50ssuperscript09hsuperscript00msuperscript50s09^{\mathrm{h}}00^{\mathrm{m}}50^{\mathrm{s}} and Dec.=+623900+62\mathrm{{}^{\circ}}39\mathrm{{}^{\prime}}00\mathrm{{}^{\prime}}\hskip-1.00006pt\mathrm{{}^{\prime}}\; (J2000), and with a void of 11×\times11\mathrm{{}^{\prime}}\;in the NW of the field. As for the spectroscopic sample, it is similar-to\sim25% complete down to R=17.5𝑅17.5R=17.5 in the whole field and similar-to\sim45% complete down to R=17.5𝑅17.5R=17.5 within 1 MpcMpc\mathrm{Mpc\;}from the cluster center.

For A610 and A796, we use public photometric data from the SDSS DR5. In particular, we use rsuperscript𝑟r^{\prime}, isuperscript𝑖i^{\prime}, zsuperscript𝑧z^{\prime} magnitudes, already corrected for the Galactic extinction and consider galaxies within a radius of 30\mathrm{{}^{\prime}}\;from the cluster center given by Abell et al. (abe89 (1989)). In the case of A610, our spectroscopic sample is similar-to\sim40% complete down to r=17.5superscript𝑟17.5r^{\prime}=17.5 within 1 MpcMpc\mathrm{Mpc\;}from the cluster center. As for A796, our spectroscopic sample is similar-to\sim20% complete down to r=19superscript𝑟19r^{\prime}=19 within 1 MpcMpc\mathrm{Mpc\;}from the cluster center.

3 Abell 610

Refer to caption
Figure 1: R𝑅R–band image of A610 (data taken with the WFC camera of the INT) with, superimposed, the contour levels of a VLA radio image at 20 cm (thin contours; Giovannini & Feretti gio00 (2000)). To avoid confusion, only one isodensity contour (thick contour) of the spatial distribution of the likely cluster members (see text) is shown. Two thick circles highlight the positions of the two brightest cluster members. The arrow shows the position of the radio relic. North is at the top and east to the left.
Refer to caption
Figure 2: DSS2 R𝑅R–band image of A610 (North at the top and East to the left). Galaxies with successful velocity measurements are labeled as in Table 1. Circles and boxes indicate cluster members and non–member galaxies, respectively.
Table 1: Velocity catalog of 165 spectroscopically measured galaxies in the field of A610. In Col. 1, IDs in italics indicate non–cluster galaxies. IDs 91 and 98 (in boldface) are, respectively, the first and the second brightest galaxies of the cluster. Asterisks in Col. 1 highlight QSOs in the SDSS catalog.
IDα,δ(J2000)rvΔvSource(kms1)17 57 04.15,+27 13 13.317.652905216S27 57 08.66,+27 09 46.417.511927428S37 57 09.21,+27 07 06.916.713465750S47 57 12.09,+27 03 23.816.322977646S57 57 18.01,+27 07 51.116.921929144S67 57 18.16,+27 04 57.815.721991345S77 57 22.92,+27 00 08.515.931963343S87 57 24.02,+26 58 46.918.94720155395S97 57 25.29,+27 23 21.918.373087040S107 57 26.27,+27 20 01.317.223707639S117 57 26.55,+27 05 00.316.582949241S127 57 32.19,+27 14 03.117.362063823S137 57 32.84,+27 17 51.316.403719044S147 57 38.68,+27 22 29.018.426953843S157 57 39.03,+26 50 42.616.38807616S167 57 40.71,+26 57 28.917.702927118S177 57 43.25,+27 08 04.317.523697546S187 57 43.57,+27 19 38.216.153701846S197 57 44.76,+26 55 06.319.0913571564S207 57 47.25,+27 18 42.717.384243046S217 57 49.87,+27 01 45.516.952166015S227 57 50.40,+26 55 14.718.69689658435S237 57 50.44,+27 07 22.917.602156236W+S247 57 51.13,+27 09 41.817.711392912W+S257 57 51.74,+27 29 33.517.236259849S267 57 52.54,+26 59 31.117.402976940W+S277 57 58.64,+27 10 17.017.052168119W+S287 57 58.93,+27 31 02.719.00431857470S297 57 59.88,+27 04 09.217.382963025S307 58 00.36,+27 08 41.916.932877837S317 58 00.96,+27 05 53.816.122889030W+S327 58 04.51,+27 07 18.219.12448615286S337 58 05.84,+27 16 56.916.582891930W+S347 58 06.68,+27 24 40.216.93776930S357 58 08.69,+27 08 15.517.592892433W+S\begin{array}[]{r c c r r c}\hline\cr\vskip 3.0pt plus 1.0pt minus 1.0pt\cr\hline\cr\vskip 3.0pt plus 1.0pt minus 1.0pt\cr\mathrm{ID}&\mathrm{\alpha},\mathrm{\delta}\,(\mathrm{J}2000)&r^{\prime}&\mathrm{v}&\mathrm{\Delta}\mathrm{v}&\mathrm{Source}\\ &&&\mathrm{(\,km}&\mathrm{s^{-1}\,)}&\\ \hline\cr\vskip 3.0pt plus 1.0pt minus 1.0pt\cr 1&7\ 57\ 04.15,+27\ 13\ 13.3&17.65&29052&16&\mathrm{S}\\ \textit{2}&7\ 57\ 08.66,+27\ 09\ 46.4&17.51&19274&28&\mathrm{S}\\ \textit{3}&7\ 57\ 09.21,+27\ 07\ 06.9&16.71&34657&50&\mathrm{S}\\ 4&7\ 57\ 12.09,+27\ 03\ 23.8&16.32&29776&46&\mathrm{S}\\ \textit{5}&7\ 57\ 18.01,+27\ 07\ 51.1&16.92&19291&44&\mathrm{S}\\ \textit{6}&7\ 57\ 18.16,+27\ 04\ 57.8&15.72&19913&45&\mathrm{S}\\ \textit{7}&7\ 57\ 22.92,+27\ 00\ 08.5&15.93&19633&43&\mathrm{S}\\ \textit{8}*&7\ 57\ 24.02,+26\ 58\ 46.9&18.94&720155&395&\mathrm{S}\\ \textit{9}&7\ 57\ 25.29,+27\ 23\ 21.9&18.37&30870&40&\mathrm{S}\\ \textit{10}&7\ 57\ 26.27,+27\ 20\ 01.3&17.22&37076&39&\mathrm{S}\\ 11&7\ 57\ 26.55,+27\ 05\ 00.3&16.58&29492&41&\mathrm{S}\\ \textit{12}&7\ 57\ 32.19,+27\ 14\ 03.1&17.36&20638&23&\mathrm{S}\\ \textit{13}&7\ 57\ 32.84,+27\ 17\ 51.3&16.40&37190&44&\mathrm{S}\\ \textit{14}&7\ 57\ 38.68,+27\ 22\ 29.0&18.42&69538&43&\mathrm{S}\\ \textit{15}&7\ 57\ 39.03,+26\ 50\ 42.6&16.38&8076&16&\mathrm{S}\\ 16&7\ 57\ 40.71,+26\ 57\ 28.9&17.70&29271&18&\mathrm{S}\\ \textit{17}&7\ 57\ 43.25,+27\ 08\ 04.3&17.52&36975&46&\mathrm{S}\\ \textit{18}&7\ 57\ 43.57,+27\ 19\ 38.2&16.15&37018&46&\mathrm{S}\\ \textit{19}&7\ 57\ 44.76,+26\ 55\ 06.3&19.09&135715&64&\mathrm{S}\\ \textit{20}&7\ 57\ 47.25,+27\ 18\ 42.7&17.38&42430&46&\mathrm{S}\\ \textit{21}&7\ 57\ 49.87,+27\ 01\ 45.5&16.95&21660&15&\mathrm{S}\\ \textit{22}*&7\ 57\ 50.40,+26\ 55\ 14.7&18.69&689658&435&\mathrm{S}\\ \textit{23}&7\ 57\ 50.44,+27\ 07\ 22.9&17.60&21562&36&\mathrm{W+S}\\ \textit{24}&7\ 57\ 51.13,+27\ 09\ 41.8&17.71&13929&12&\mathrm{W+S}\\ \textit{25}&7\ 57\ 51.74,+27\ 29\ 33.5&17.23&62598&49&\mathrm{S}\\ 26&7\ 57\ 52.54,+26\ 59\ 31.1&17.40&29769&40&\mathrm{W+S}\\ \textit{27}&7\ 57\ 58.64,+27\ 10\ 17.0&17.05&21681&19&\mathrm{W+S}\\ \textit{28}*&7\ 57\ 58.93,+27\ 31\ 02.7&19.00&431857&470&\mathrm{S}\\ 29&7\ 57\ 59.88,+27\ 04\ 09.2&17.38&29630&25&\mathrm{S}\\ 30&7\ 58\ 00.36,+27\ 08\ 41.9&16.93&28778&37&\mathrm{S}\\ 31&7\ 58\ 00.96,+27\ 05\ 53.8&16.12&28890&30&\mathrm{W+S}\\ \textit{32}*&7\ 58\ 04.51,+27\ 07\ 18.2&19.12&448615&286&\mathrm{S}\\ 33&7\ 58\ 05.84,+27\ 16\ 56.9&16.58&28919&30&\mathrm{W+S}\\ \textit{34}&7\ 58\ 06.68,+27\ 24\ 40.2&16.93&7769&30&\mathrm{S}\\ 35&7\ 58\ 08.69,+27\ 08\ 15.5&17.59&28924&33&\mathrm{W+S}\\ \vskip 3.0pt plus 1.0pt minus 1.0pt\cr\hline\cr\vskip 3.0pt plus 1.0pt minus 1.0pt\cr\hline\cr\end{array}
Table 1: Continued.
IDα,δ(J2000)rvΔvSource(kms1)367 58 10.17,+27 21 04.716.57684145S377 58 11.69,+27 11 28.617.462928731W+S387 58 13.82,+27 15 12.717.542309914S397 58 16.58,+27 03 43.918.4043608101W407 58 16.66,+27 10 29.614.511381839W+S417 58 17.86,+27 03 23.914.68638624W+S427 58 18.29,+27 05 16.519.89740173237S437 58 22.66,+26 41 20.617.486898938S447 58 26.22,+27 09 41.515.741411617W+S457 58 26.37,+27 00 37.516.633001239S467 58 28.45,+26 40 53.917.672489142S477 58 28.97,+26 39 49.616.777036752S487 58 29.80,+27 18 23.517.532919933W+S497 58 30.83,+27 13 33.517.442948633W+S507 58 33.27,+27 02 18.116.412973429W+S517 58 33.99,+27 11 51.418.8969649261S527 58 36.35,+27 18 42.017.75226576W+S537 58 36.45,+27 11 36.818.042915374W547 58 39.62,+26 51 47.717.773678029S557 58 40.38,+26 56 39.316.793689321W+S567 58 41.26,+26 58 14.617.122233826W+S577 58 42.45,+27 16 56.017.452875721W+S587 58 46.68,+27 34 51.915.902293651S597 58 46.99,+27 05 15.617.152962152S607 58 47.87,+26 47 35.816.962224017S617 58 47.96,+27 17 06.016.332870531W+S627 58 49.67,+27 27 55.917.422903935S637 58 52.31,+27 24 01.618.2320449120W647 58 52.99,+27 12 51.217.622927230W+S657 58 54.80,+27 11 28.517.632844439S667 58 56.31,+27 33 24.716.442293756S677 58 56.53,+27 03 17.217.391362612S687 58 58.20,+27 09 37.115.842262931W+S697 58 59.33,+27 12 56.816.682884639W+S707 59 00.21,+27 35 33.916.921410129S\begin{array}[]{r c c r r c}\hline\cr\vskip 3.0pt plus 1.0pt minus 1.0pt\cr\hline\cr\vskip 3.0pt plus 1.0pt minus 1.0pt\cr\mathrm{ID}&\mathrm{\alpha},\mathrm{\delta}\,(\mathrm{J}2000)&r^{\prime}&\mathrm{v}&\mathrm{\Delta}\mathrm{v}&\mathrm{Source}\\ &&&\mathrm{(\,km}&\mathrm{s^{-1}\,)}&\\ \hline\cr\vskip 3.0pt plus 1.0pt minus 1.0pt\cr\textit{36}&7\ 58\ 10.17,+27\ 21\ 04.7&16.57&6841&45&\mathrm{S}\\ 37&7\ 58\ 11.69,+27\ 11\ 28.6&17.46&29287&31&\mathrm{W+S}\\ \textit{38}&7\ 58\ 13.82,+27\ 15\ 12.7&17.54&23099&14&\mathrm{S}\\ \textit{39}&7\ 58\ 16.58,+27\ 03\ 43.9&18.40&43608&101&\mathrm{W}\\ \textit{40}&7\ 58\ 16.66,+27\ 10\ 29.6&14.51&13818&39&\mathrm{W+S}\\ \textit{41}&7\ 58\ 17.86,+27\ 03\ 23.9&14.68&6386&24&\mathrm{W+S}\\ \textit{42}*&7\ 58\ 18.29,+27\ 05\ 16.5&19.89&740173&237&\mathrm{S}\\ \textit{43}&7\ 58\ 22.66,+26\ 41\ 20.6&17.48&68989&38&\mathrm{S}\\ \textit{44}&7\ 58\ 26.22,+27\ 09\ 41.5&15.74&14116&17&\mathrm{W+S}\\ 45&7\ 58\ 26.37,+27\ 00\ 37.5&16.63&30012&39&\mathrm{S}\\ \textit{46}&7\ 58\ 28.45,+26\ 40\ 53.9&17.67&24891&42&\mathrm{S}\\ \textit{47}&7\ 58\ 28.97,+26\ 39\ 49.6&16.77&70367&52&\mathrm{S}\\ 48&7\ 58\ 29.80,+27\ 18\ 23.5&17.53&29199&33&\mathrm{W+S}\\ 49&7\ 58\ 30.83,+27\ 13\ 33.5&17.44&29486&33&\mathrm{W+S}\\ 50&7\ 58\ 33.27,+27\ 02\ 18.1&16.41&29734&29&\mathrm{W+S}\\ \textit{51}*&7\ 58\ 33.99,+27\ 11\ 51.4&18.89&69649&261&\mathrm{S}\\ \textit{52}&7\ 58\ 36.35,+27\ 18\ 42.0&17.75&22657&6&\mathrm{W+S}\\ 53&7\ 58\ 36.45,+27\ 11\ 36.8&18.04&29153&74&\mathrm{W}\\ \textit{54}&7\ 58\ 39.62,+26\ 51\ 47.7&17.77&36780&29&\mathrm{S}\\ \textit{55}&7\ 58\ 40.38,+26\ 56\ 39.3&16.79&36893&21&\mathrm{W+S}\\ \textit{56}&7\ 58\ 41.26,+26\ 58\ 14.6&17.12&22338&26&\mathrm{W+S}\\ 57&7\ 58\ 42.45,+27\ 16\ 56.0&17.45&28757&21&\mathrm{W+S}\\ \textit{58}&7\ 58\ 46.68,+27\ 34\ 51.9&15.90&22936&51&\mathrm{S}\\ 59&7\ 58\ 46.99,+27\ 05\ 15.6&17.15&29621&52&\mathrm{S}\\ \textit{60}&7\ 58\ 47.87,+26\ 47\ 35.8&16.96&22240&17&\mathrm{S}\\ 61&7\ 58\ 47.96,+27\ 17\ 06.0&16.33&28705&31&\mathrm{W+S}\\ 62&7\ 58\ 49.67,+27\ 27\ 55.9&17.42&29039&35&\mathrm{S}\\ \textit{63}&7\ 58\ 52.31,+27\ 24\ 01.6&18.23&20449&120&\mathrm{W}\\ 64&7\ 58\ 52.99,+27\ 12\ 51.2&17.62&29272&30&\mathrm{W+S}\\ 65&7\ 58\ 54.80,+27\ 11\ 28.5&17.63&28444&39&\mathrm{S}\\ \textit{66}&7\ 58\ 56.31,+27\ 33\ 24.7&16.44&22937&56&\mathrm{S}\\ \textit{67}&7\ 58\ 56.53,+27\ 03\ 17.2&17.39&13626&12&\mathrm{S}\\ \textit{68}&7\ 58\ 58.20,+27\ 09\ 37.1&15.84&22629&31&\mathrm{W+S}\\ 69&7\ 58\ 59.33,+27\ 12\ 56.8&16.68&28846&39&\mathrm{W+S}\\ \textit{70}&7\ 59\ 00.21,+27\ 35\ 33.9&16.92&14101&29&\mathrm{S}\\ \vskip 3.0pt plus 1.0pt minus 1.0pt\cr\hline\cr\vskip 3.0pt plus 1.0pt minus 1.0pt\cr\hline\cr\end{array}
Table 1: Continued.
IDα,δ(J2000)rvΔvSource(kms1)717 59 00.70,+27 33 52.817.013740350S727 59 01.04,+27 07 12.117.302900729W+S737 59 01.10,+27 09 43.316.522583626W747 59 01.28,+27 06 11.817.362919035S757 59 03.63,+26 53 09.717.052237228W+S767 59 04.34,+27 08 55.416.862883340S777 59 04.34,+27 13 25.616.832917838W+S787 59 05.16,+27 27 34.315.32674154S797 59 05.81,+27 06 29.816.772927735W+S807 59 06.22,+27 15 39.416.542230078W817 59 06.80,+26 50 54.418.379963746S827 59 07.49,+27 18 12.017.412471015W+S837 59 08.52,+27 11 27.117.412912315W+S847 59 09.00,+27 33 15.617.442318413S857 59 10.27,+26 49 07.116.082046944S867 59 11.37,+27 10 50.717.313023343W877 59 12.89,+27 06 16.016.963017253W887 59 13.65,+27 05 41.016.142901640W897 59 13.80,+26 38 22.817.56647328S907 59 16.02,+27 08 57.717.602924223S917 59 17.10,+27 09 16.115.1929808103W927 59 17.87,+27 04 40.313.72680850S937 59 18.74,+27 07 10.217.422759839S947 59 20.05,+27 09 50.416.382969336W+S957 59 24.05,+27 08 49.516.242990138W967 59 24.24,+26 57 32.417.95629956W977 59 24.36,+27 17 55.417.522280914W+S987 59 25.00,+27 07 48.915.722790142W+S997 59 27.79,+27 07 03.717.072870926W+S1007 59 27.83,+27 05 45.415.972044430W+S1017 59 28.52,+26 53 22.614.24792423S1027 59 29.71,+27 01 35.212.60665459S1037 59 32.18,+26 38 18.015.872244241S1047 59 32.83,+26 55 08.617.984516379W1057 59 33.50,+26 43 50.316.231406216S\begin{array}[]{r c c r r c}\hline\cr\vskip 3.0pt plus 1.0pt minus 1.0pt\cr\hline\cr\vskip 3.0pt plus 1.0pt minus 1.0pt\cr\mathrm{ID}&\mathrm{\alpha},\mathrm{\delta}\,(\mathrm{J}2000)&r^{\prime}&\mathrm{v}&\mathrm{\Delta}\mathrm{v}&\mathrm{Source}\\ &&&\mathrm{(\,km}&\mathrm{s^{-1}\,)}&\\ \hline\cr\vskip 3.0pt plus 1.0pt minus 1.0pt\cr\textit{71}&7\ 59\ 00.70,+27\ 33\ 52.8&17.01&37403&50&\mathrm{S}\\ 72&7\ 59\ 01.04,+27\ 07\ 12.1&17.30&29007&29&\mathrm{W+S}\\ \textit{73}&7\ 59\ 01.10,+27\ 09\ 43.3&16.52&25836&26&\mathrm{W}\\ 74&7\ 59\ 01.28,+27\ 06\ 11.8&17.36&29190&35&\mathrm{S}\\ \textit{75}&7\ 59\ 03.63,+26\ 53\ 09.7&17.05&22372&28&\mathrm{W+S}\\ 76&7\ 59\ 04.34,+27\ 08\ 55.4&16.86&28833&40&\mathrm{S}\\ 77&7\ 59\ 04.34,+27\ 13\ 25.6&16.83&29178&38&\mathrm{W+S}\\ \textit{78}&7\ 59\ 05.16,+27\ 27\ 34.3&15.32&6741&54&\mathrm{S}\\ 79&7\ 59\ 05.81,+27\ 06\ 29.8&16.77&29277&35&\mathrm{W+S}\\ \textit{80}&7\ 59\ 06.22,+27\ 15\ 39.4&16.54&22300&78&\mathrm{W}\\ \textit{81}&7\ 59\ 06.80,+26\ 50\ 54.4&18.37&99637&46&\mathrm{S}\\ \textit{82}&7\ 59\ 07.49,+27\ 18\ 12.0&17.41&24710&15&\mathrm{W+S}\\ 83&7\ 59\ 08.52,+27\ 11\ 27.1&17.41&29123&15&\mathrm{W+S}\\ \textit{84}&7\ 59\ 09.00,+27\ 33\ 15.6&17.44&23184&13&\mathrm{S}\\ \textit{85}&7\ 59\ 10.27,+26\ 49\ 07.1&16.08&20469&44&\mathrm{S}\\ 86&7\ 59\ 11.37,+27\ 10\ 50.7&17.31&30233&43&\mathrm{W}\\ 87&7\ 59\ 12.89,+27\ 06\ 16.0&16.96&30172&53&\mathrm{W}\\ 88&7\ 59\ 13.65,+27\ 05\ 41.0&16.14&29016&40&\mathrm{W}\\ \textit{89}&7\ 59\ 13.80,+26\ 38\ 22.8&17.56&6473&28&\mathrm{S}\\ 90&7\ 59\ 16.02,+27\ 08\ 57.7&17.60&29242&23&\mathrm{S}\\ \textbf{91}&7\ 59\ 17.10,+27\ 09\ 16.1&15.19&29808&103&\mathrm{W}\\ \textit{92}&7\ 59\ 17.87,+27\ 04\ 40.3&13.72&6808&50&\mathrm{S}\\ 93&7\ 59\ 18.74,+27\ 07\ 10.2&17.42&27598&39&\mathrm{S}\\ 94&7\ 59\ 20.05,+27\ 09\ 50.4&16.38&29693&36&\mathrm{W+S}\\ 95&7\ 59\ 24.05,+27\ 08\ 49.5&16.24&29901&38&\mathrm{W}\\ \textit{96}&7\ 59\ 24.24,+26\ 57\ 32.4&17.95&6299&56&\mathrm{W}\\ \textit{97}&7\ 59\ 24.36,+27\ 17\ 55.4&17.52&22809&14&\mathrm{W+S}\\ \textbf{98}&7\ 59\ 25.00,+27\ 07\ 48.9&15.72&27901&42&\mathrm{W+S}\\ 99&7\ 59\ 27.79,+27\ 07\ 03.7&17.07&28709&26&\mathrm{W+S}\\ \textit{100}&7\ 59\ 27.83,+27\ 05\ 45.4&15.97&20444&30&\mathrm{W+S}\\ \textit{101}&7\ 59\ 28.52,+26\ 53\ 22.6&14.24&7924&23&\mathrm{S}\\ \textit{102}&7\ 59\ 29.71,+27\ 01\ 35.2&12.60&6654&59&\mathrm{S}\\ \textit{103}&7\ 59\ 32.18,+26\ 38\ 18.0&15.87&22442&41&\mathrm{S}\\ \textit{104}&7\ 59\ 32.83,+26\ 55\ 08.6&17.98&45163&79&\mathrm{W}\\ \textit{105}&7\ 59\ 33.50,+26\ 43\ 50.3&16.23&14062&16&\mathrm{S}\\ \vskip 3.0pt plus 1.0pt minus 1.0pt\cr\hline\cr\vskip 3.0pt plus 1.0pt minus 1.0pt\cr\hline\cr\end{array}\\
Table 1: Continued.
IDα,δ(J2000)rvΔvSource(kms1)1067 59 37.79,+26 57 29.617.432970926W+S1077 59 38.39,+27 33 25.717.172459615S1087 59 40.16,+27 05 14.117.221423420W+S1097 59 40.18,+27 30 30.916.502316041S1107 59 40.90,+27 35 45.216.542286143S1117 59 41.72,+27 00 12.615.43664227W+S1127 59 42.16,+27 19 17.018.3627799134W1137 59 43.49,+27 10 10.917.132963143S1147 59 44.15,+27 23 13.416.944720940S1157 59 46.49,+26 38 19.217.79812117S1167 59 47.17,+27 31 24.317.583121335S1177 59 48.38,+27 11 37.118.308732334S1187 59 49.80,+27 09 37.117.9020839105W1197 59 51.25,+26 50 42.317.124916015W+S1207 59 53.83,+26 47 20.515.121422319S1217 59 54.14,+27 01 23.517.772872534S1227 59 54.42,+27 08 54.717.593017634S1237 59 55.14,+26 50 35.217.454928160W1247 59 55.22,+27 07 47.817.311397813S1257 59 57.75,+26 53 14.717.572948038S1267 59 59.13,+27 09 02.517.522072284W1277 59 59.84,+26 57 39.018.532988260W1288 00 00.02,+27 33 27.016.353106745S1298 00 00.14,+27 09 00.117.802057212S1308 00 01.06,+26 39 57.114.11812946S1318 00 01.92,+27 06 52.415.951279315W+S1328 00 02.92,+27 17 27.419.96567201830S1338 00 06.60,+26 50 54.718.95700666404S1348 00 06.98,+27 09 38.717.372952133W+S1358 00 07.36,+27 08 19.816.602910840W+S1368 00 07.96,+26 42 24.415.951416243S1378 00 11.64,+27 14 22.616.992901229W+S1388 00 11.79,+27 32 30.016.283094436S1398 00 14.08,+27 18 35.417.571480215S1408 00 14.30,+26 41 52.814.87840716S\begin{array}[]{r c c r r c}\hline\cr\vskip 3.0pt plus 1.0pt minus 1.0pt\cr\hline\cr\vskip 3.0pt plus 1.0pt minus 1.0pt\cr\mathrm{ID}&\mathrm{\alpha},\mathrm{\delta}\,(\mathrm{J}2000)&r^{\prime}&\mathrm{v}&\mathrm{\Delta}\mathrm{v}&\mathrm{Source}\\ &&&\mathrm{(\,km}&\mathrm{s^{-1}\,)}&\\ \hline\cr\vskip 3.0pt plus 1.0pt minus 1.0pt\cr 106&7\ 59\ 37.79,+26\ 57\ 29.6&17.43&29709&26&\mathrm{W+S}\\ \textit{107}&7\ 59\ 38.39,+27\ 33\ 25.7&17.17&24596&15&\mathrm{S}\\ \textit{108}&7\ 59\ 40.16,+27\ 05\ 14.1&17.22&14234&20&\mathrm{W+S}\\ \textit{109}&7\ 59\ 40.18,+27\ 30\ 30.9&16.50&23160&41&\mathrm{S}\\ \textit{110}&7\ 59\ 40.90,+27\ 35\ 45.2&16.54&22861&43&\mathrm{S}\\ \textit{111}&7\ 59\ 41.72,+27\ 00\ 12.6&15.43&6642&27&\mathrm{W+S}\\ 112&7\ 59\ 42.16,+27\ 19\ 17.0&18.36&27799&134&\mathrm{W}\\ 113&7\ 59\ 43.49,+27\ 10\ 10.9&17.13&29631&43&\mathrm{S}\\ \textit{114}&7\ 59\ 44.15,+27\ 23\ 13.4&16.94&47209&40&\mathrm{S}\\ \textit{115}&7\ 59\ 46.49,+26\ 38\ 19.2&17.79&8121&17&\mathrm{S}\\ \textit{116}&7\ 59\ 47.17,+27\ 31\ 24.3&17.58&31213&35&\mathrm{S}\\ \textit{117}&7\ 59\ 48.38,+27\ 11\ 37.1&18.30&87323&34&\mathrm{S}\\ \textit{118}&7\ 59\ 49.80,+27\ 09\ 37.1&17.90&20839&105&\mathrm{W}\\ \textit{119}&7\ 59\ 51.25,+26\ 50\ 42.3&17.12&49160&15&\mathrm{W+S}\\ \textit{120}&7\ 59\ 53.83,+26\ 47\ 20.5&15.12&14223&19&\mathrm{S}\\ 121&7\ 59\ 54.14,+27\ 01\ 23.5&17.77&28725&34&\mathrm{S}\\ 122&7\ 59\ 54.42,+27\ 08\ 54.7&17.59&30176&34&\mathrm{S}\\ \textit{123}&7\ 59\ 55.14,+26\ 50\ 35.2&17.45&49281&60&\mathrm{W}\\ \textit{124}&7\ 59\ 55.22,+27\ 07\ 47.8&17.31&13978&13&\mathrm{S}\\ 125&7\ 59\ 57.75,+26\ 53\ 14.7&17.57&29480&38&\mathrm{S}\\ \textit{126}&7\ 59\ 59.13,+27\ 09\ 02.5&17.52&20722&84&\mathrm{W}\\ 127&7\ 59\ 59.84,+26\ 57\ 39.0&18.53&29882&60&\mathrm{W}\\ \textit{128}&8\ 00\ 00.02,+27\ 33\ 27.0&16.35&31067&45&\mathrm{S}\\ \textit{129}&8\ 00\ 00.14,+27\ 09\ 00.1&17.80&20572&12&\mathrm{S}\\ \textit{130}&8\ 00\ 01.06,+26\ 39\ 57.1&14.11&8129&46&\mathrm{S}\\ \textit{131}&8\ 00\ 01.92,+27\ 06\ 52.4&15.95&12793&15&\mathrm{W+S}\\ \textit{132}*&8\ 00\ 02.92,+27\ 17\ 27.4&19.96&567201&830&\mathrm{S}\\ \textit{133}*&8\ 00\ 06.60,+26\ 50\ 54.7&18.95&700666&404&\mathrm{S}\\ 134&8\ 00\ 06.98,+27\ 09\ 38.7&17.37&29521&33&\mathrm{W+S}\\ 135&8\ 00\ 07.36,+27\ 08\ 19.8&16.60&29108&40&\mathrm{W+S}\\ \textit{136}&8\ 00\ 07.96,+26\ 42\ 24.4&15.95&14162&43&\mathrm{S}\\ 137&8\ 00\ 11.64,+27\ 14\ 22.6&16.99&29012&29&\mathrm{W+S}\\ \textit{138}&8\ 00\ 11.79,+27\ 32\ 30.0&16.28&30944&36&\mathrm{S}\\ \textit{139}&8\ 00\ 14.08,+27\ 18\ 35.4&17.57&14802&15&\mathrm{S}\\ \textit{140}&8\ 00\ 14.30,+26\ 41\ 52.8&14.87&8407&16&\mathrm{S}\\ \vskip 3.0pt plus 1.0pt minus 1.0pt\cr\hline\cr\vskip 3.0pt plus 1.0pt minus 1.0pt\cr\hline\cr\end{array}\\
Table 1: Continued.
IDα,δ(J2000)rvΔvSource(kms1)1418 00 14.90,+27 20 36.219.311135030131S1428 00 15.38,+27 12 50.117.782946265W1438 00 19.77,+26 42 05.213.91833526S1448 00 20.77,+27 26 24.917.635849754S1458 00 21.25,+27 09 09.817.462927928W+S1468 00 22.22,+27 07 52.516.272912531W+S1478 00 22.54,+27 03 08.118.222840291W1488 00 25.93,+27 06 59.117.062886234S1498 00 30.46,+27 02 13.716.582313819S1508 00 31.67,+26 45 11.716.061424016S1518 00 39.10,+27 27 06.517.761119017S1528 00 40.35,+26 59 15.717.212880036S1538 00 41.73,+27 28 22.316.111413540S1548 00 42.93,+27 13 47.716.902923520S1558 00 47.14,+27 09 01.017.112313438S1568 00 48.75,+26 59 10.416.06684940S1578 00 53.09,+27 13 37.616.581391744S1588 00 55.32,+27 16 52.718.84532494447S1598 00 57.27,+27 12 28.017.084935037S1608 00 57.36,+26 57 24.118.95567456306S1618 01 00.32,+27 10 46.817.001428746S1628 01 14.34,+27 11 12.417.141422613S1638 01 18.51,+27 12 45.514.471410147S1648 01 22.04,+27 12 05.616.211451145S1658 01 28.93,+27 04 32.316.053015741S\begin{array}[]{r c c r r c}\hline\cr\vskip 3.0pt plus 1.0pt minus 1.0pt\cr\hline\cr\vskip 3.0pt plus 1.0pt minus 1.0pt\cr\mathrm{ID}&\mathrm{\alpha},\mathrm{\delta}\,(\mathrm{J}2000)&r^{\prime}&\mathrm{v}&\mathrm{\Delta}\mathrm{v}&\mathrm{Source}\\ &&&\mathrm{(\,km}&\mathrm{s^{-1}\,)}&\\ \hline\cr\vskip 3.0pt plus 1.0pt minus 1.0pt\cr\textit{141}*&8\ 00\ 14.90,+27\ 20\ 36.2&19.31&1135030&131&\mathrm{S}\\ 142&8\ 00\ 15.38,+27\ 12\ 50.1&17.78&29462&65&\mathrm{W}\\ \textit{143}&8\ 00\ 19.77,+26\ 42\ 05.2&13.91&8335&26&\mathrm{S}\\ \textit{144}&8\ 00\ 20.77,+27\ 26\ 24.9&17.63&58497&54&\mathrm{S}\\ 145&8\ 00\ 21.25,+27\ 09\ 09.8&17.46&29279&28&\mathrm{W+S}\\ 146&8\ 00\ 22.22,+27\ 07\ 52.5&16.27&29125&31&\mathrm{W+S}\\ 147&8\ 00\ 22.54,+27\ 03\ 08.1&18.22&28402&91&\mathrm{W}\\ 148&8\ 00\ 25.93,+27\ 06\ 59.1&17.06&28862&34&\mathrm{S}\\ \textit{149}&8\ 00\ 30.46,+27\ 02\ 13.7&16.58&23138&19&\mathrm{S}\\ \textit{150}&8\ 00\ 31.67,+26\ 45\ 11.7&16.06&14240&16&\mathrm{S}\\ \textit{151}&8\ 00\ 39.10,+27\ 27\ 06.5&17.76&11190&17&\mathrm{S}\\ 152&8\ 00\ 40.35,+26\ 59\ 15.7&17.21&28800&36&\mathrm{S}\\ \textit{153}&8\ 00\ 41.73,+27\ 28\ 22.3&16.11&14135&40&\mathrm{S}\\ 154&8\ 00\ 42.93,+27\ 13\ 47.7&16.90&29235&20&\mathrm{S}\\ \textit{155}&8\ 00\ 47.14,+27\ 09\ 01.0&17.11&23134&38&\mathrm{S}\\ \textit{156}&8\ 00\ 48.75,+26\ 59\ 10.4&16.06&6849&40&\mathrm{S}\\ \textit{157}&8\ 00\ 53.09,+27\ 13\ 37.6&16.58&13917&44&\mathrm{S}\\ \textit{158}*&8\ 00\ 55.32,+27\ 16\ 52.7&18.84&532494&447&\mathrm{S}\\ \textit{159}&8\ 00\ 57.27,+27\ 12\ 28.0&17.08&49350&37&\mathrm{S}\\ \textit{160}*&8\ 00\ 57.36,+26\ 57\ 24.1&18.95&567456&306&\mathrm{S}\\ \textit{161}&8\ 01\ 00.32,+27\ 10\ 46.8&17.00&14287&46&\mathrm{S}\\ \textit{162}&8\ 01\ 14.34,+27\ 11\ 12.4&17.14&14226&13&\mathrm{S}\\ \textit{163}&8\ 01\ 18.51,+27\ 12\ 45.5&14.47&14101&47&\mathrm{S}\\ \textit{164}&8\ 01\ 22.04,+27\ 12\ 05.6&16.21&14511&45&\mathrm{S}\\ 165&8\ 01\ 28.93,+27\ 04\ 32.3&16.05&30157&41&\mathrm{S}\\ \vskip 3.0pt plus 1.0pt minus 1.0pt\cr\hline\cr\vskip 3.0pt plus 1.0pt minus 1.0pt\cr\hline\cr\end{array}\\

A610 is a poor Abell cluster (Abell richness class=0; Abell et al. abe89 (1989)) located in the background of the rich nearby cluster ZwCl 0752.9+2833 (at z=0.015–0.027 according to NED). Kowalski et al. (kow84 (1992)) reported a 2σ2𝜎2\sigma upper limit for the X–ray luminosity LXsubscript𝐿XL_{\mathrm{X}}(2–6 keV)=0.58×1044h752absent0.58superscript1044superscriptsubscript752=0.58\times 10^{44}\ h_{75}^{-2} erg s-1 (in their cosmology).

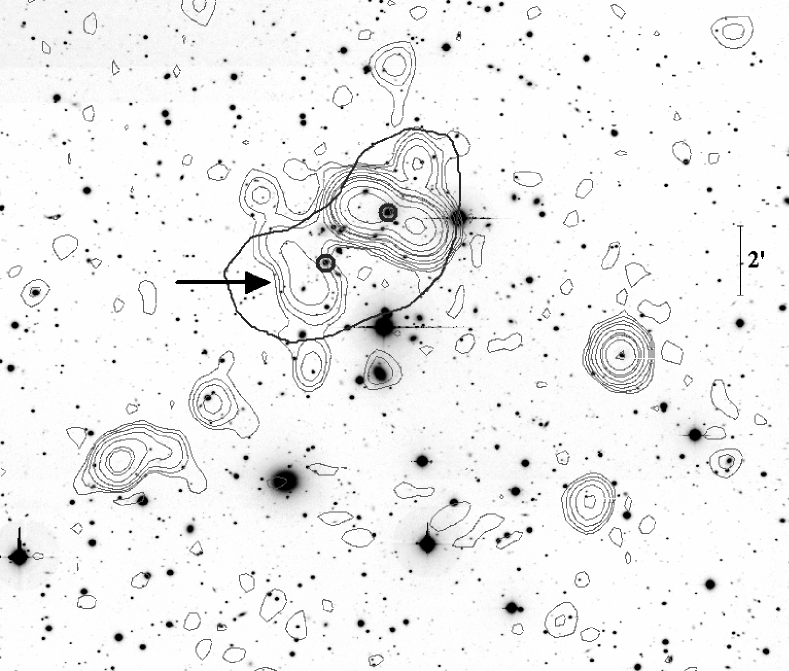
We identified the well known bright radio source B2 0756+27 (ID 91 in our catalog, see below) as a double radio galaxy associated with the optically brightest, giant elliptical of the cluster (Valentijn val79 (1979), see also Owen et al. owe92 (1992)). For this galaxy Owen et al. (owe95 (1995)) measured a redshift of z=0.0991±0.0002𝑧plus-or-minus0.09910.0002z=0.0991\pm 0.0002 and detected Hα𝛼\alpha+NII emission lines. This WAT radio galaxy has been recently studied by Jetha et al. (jet06 (2006)), too. The presence of a diffuse radio source at Southeast from the radio galaxy (see Fig. 1) was suggested by Valentijn (val79 (1979)) and then confirmed and classified as a relic by Giovannini & Feretti (gio00 (2000)).

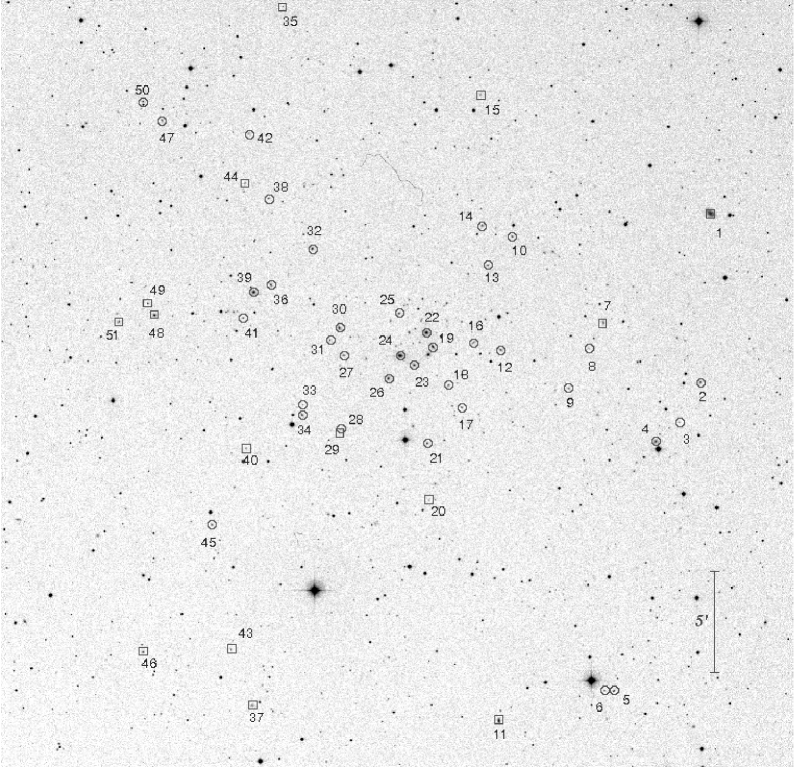
Table 1 lists our velocity catalog and Fig. 2 shows the finding chart for the 165 galaxies in the field of A610. In Table 1, for each galaxy we provide: identification number ID (Col. 1), right ascension and declination, α𝛼\alpha and δ𝛿\delta (J2000, Col. 2); rsuperscript𝑟r^{\prime} SDSS magnitudes (Col. 3); heliocentric radial velocities, v=czv𝑐subscript𝑧{\rm v}=cz_{\sun} (Col. 4) with errors, ΔvΔv\Delta{\rm v} (Col. 5); source of velocity data (W: WHT, S: SDSS, W+S: combined WHT and SDSS) in Col. 6. The typical error on radial velocity as given by the median value is 38 km s-1.

3.1 Member selection and global properties

To select cluster members from the 165 galaxies having redshifts, we use the adaptive–kernel method (hereafter DEDICA, Pisani pis93 (1993) and pis96 (1996); see also Fadda et al. fad96 (1996); Girardi et al. gir96 (1996); Girardi & Mezzetti gir01 (2001)). We find significant peaks in the velocity distribution at >>99% c.l.. This procedure detects A610 as a one–peaked structure, populated by 61 galaxies with 27598v3121327598𝑣3121327598\leq v\leq 31213 km s-1(see Fig. 3). Out of the non–member galaxies, 70 and 34 are foreground and background galaxies, respectively.

All the galaxies assigned to the A610 peak are analyzed in the second step, which uses the combination of position and velocity information. We apply the procedure of the “shifting gapper” by Fadda et al. (fad96 (1996)). This procedure rejects galaxies that are too far in velocity from the main body of galaxies and within a fixed bin that shifts along the distance from the cluster center. The procedure is iterated until the number of cluster members converges to a stable value. Following Fadda et al. (fad96 (1996)) we use a gap of 100010001000 km s11{}^{-1}\;in the cluster rest–frame and a bin of 0.6 h701superscriptsubscript701h_{70}^{-1} Mpc, or large enough to include 15 galaxies. As for the cluster center, we consider the position of the dominant galaxy [R.A.=07h59m17s. 10superscript07hsuperscript59m17s.1007^{\mathrm{h}}59^{\mathrm{m}}17\,\hbox to0.0pt{\hbox{$\mathrm{{}^{s}}$}\hss}{\hbox{$.$}}\,10, Dec.=+270916. 1+27\mathrm{{}^{\circ}}09\mathrm{{}^{\prime}}16\,\hbox to0.0pt{\hbox{$\mathrm{{}^{\prime}\hskip-1.00006pt{}^{\prime}}$}\hss}{\hbox{$.$}}\,1 (J2000)] which was identified with the radio galaxy producing the source B2 0756+27 (see above). The shifting–gapper procedure rejects another four galaxies as non–members (cross symbols in Fig. 4). Thus, the member selection procedure leads to a sample of 57 cluster members (see Table 1 and Fig. 4).

Refer to caption
Figure 3: A610: redshift galaxy distribution. The solid line histogram refers to galaxies assigned to the cluster according to the DEDICA reconstruction method.
Refer to caption
Figure 4: A610. Bottom panel: rest–frame velocity vs. projected clustercentric distance for the 61 galaxies in the main peak (Fig. 3) showing galaxies detected as interlopers by our “shifting gapper” procedure (crosses). Squares indicate galaxies forming the sample of the 57 member galaxies. The three galaxies with the lowest velocities are rejected to build Sample2 (see text). Top panel: velocity distribution of the 57 cluster members and 4 rejected galaxies (solid and dashed histograms). Arrows correspond to the two brightest cluster members. The three Gaussians correspond to the three KMM groups (see Table 2).
Refer to caption
Figure 5: A610: integral profiles of mean velocity and LOS velocity–dispersion are shown in top and bottom panels, respectively. The mean and dispersion at a given (projected) radius from the cluster center is estimated by considering all galaxies within that radius – the first value computed on the five galaxies closest to the center. The error bands at the 68%percent6868\% c.l. are also shown. The faint vertical lines give the radius of the virialized region.
Refer to caption
Figure 6: A610: stripe density plot where the arrows indicate the positions of the significant gaps. The two most important gaps are indicated by the two big arrows.
Refer to caption
Figure 7: A610: spatial distribution on the sky of the 57 cluster members. KMM1, KMM2 and KMM3 galaxies are denoted by crosses, triangles and circles, respectively. The position of the two brightest galaxies (BCMI and BCMII) are indicated by the faint large squares. The circle indicates the likely virialized region. Bigger and smaller arrows indicate the velocity gradients within the whole and the virialized regions, respectively. The plot is centered on the cluster center defined as the position of BCMI.

By applying the biweight estimator to the cluster members (Beers et al. bee90 (1990)), we compute a mean cluster redshift of z=0.0976±delimited-⟨⟩𝑧limit-from0.0976plus-or-minus\left<z\right>=0.0976\pm 0.0002, i.e., v=29255±delimited-⟨⟩vlimit-from29255plus-or-minus\left<\rm{\rm v}\right>=29255\pm66 km s-1. We estimate the LOS velocity dispersion, σVsubscript𝜎V\sigma_{\rm V}, by using the biweight estimator and applying the cosmological correction and the standard correction for velocity errors (Danese et al. dan80 (1980)). We obtain σV=49648+73subscript𝜎Vsuperscriptsubscript4964873\sigma_{\rm V}=496_{-48}^{+73} km s-1, where errors are estimated through a bootstrap technique.

Here we compute the mass of A610 assuming that the system is in dynamical equilibrium. Following the prescriptions of Girardi & Mezzetti (gir01 (2001)) – in particular see their Eq. 1 after introducing the scaling with H(z)𝐻𝑧H(z) – we assume for the radius of the quasi–virialized region R=vir0.17×σV/H(z)=1.15{}_{\rm vir}=0.17\times\sigma_{\rm V}/H(z)=1.15 h701superscriptsubscript701h_{70}^{-1} Mpc (see also Eq.  8 of Carlberg et al. car97 (1997) for R200). Therefore, our spectroscopic catalog samples the whole virialized region of the cluster.

One can compute the mass using the virial theorem (Limber & Mathews lim60 (1960); see also Girardi et al. gir98 (1998)) under the assumption that mass follows galaxy distribution: M=3π/2σV2RPV/G𝑀3𝜋2superscriptsubscript𝜎V2subscriptRPV𝐺M=3\pi/2\cdot\sigma_{\rm V}^{2}{\rm R}_{\rm PV}/G is the standard virial mass, RPV a projected radius (equal to two times the harmonic radius). Figure 5 shows that the estimate of σVsubscript𝜎V\sigma_{\rm V} is robust when computed within a large cluster region, thus we consider the global value (see Fig. 5 of Girardi et al. gir06 (2006) and Fadda et al. fad96 (1996) for other examples). The value of RPV depends on the size of the region considered so that the computed mass increases (but not linearly) with the increasing region considered. Considering the 24 galaxies within Rvir we obtain R=PV0.87±0.11{}_{\rm PV}=0.87\pm 0.11 h701superscriptsubscript701h_{70}^{-1} Mpc .

We obtain a virial mass M(<Rvir=1.15h701Mpc)=2.30.6+0.8M(<{\rm R}_{\rm vir}=1.15\,\;h_{70}^{-1}\mathrm{Mpc})=2.3_{-0.6}^{+0.8} ×1014h701Mabsentsuperscript1014superscriptsubscript701subscript𝑀direct-product\times 10^{14}\;h_{70}^{-1}\;M_{\odot}\;. Notice that in this case we do not apply the 20%percent2020\% surface pressure term correction (e.g., The & White the86 (1986); Carlberg et al. car97 (1997); Girardi et al. gir98 (1998)) since we use the value of the velocity dispersion as computed within a very large radius.

We also consider an alternative sample of 54 galaxies – Sample2 – rejecting the three galaxies with lowest velocity, which are separated by a gap of 450similar-toabsent450\sim 450 km s11{}^{-1}\;in the reference frame from the whole velocity distribution of the cluster (see Fig. 4). Since this is a poor cluster such a value for a gap is quite anomalous (see also below Sect. 3.2). The properties of Sample2 are listed in Table 2.

We also present the analysis of the 22 galaxies which are the subsample of Sample2 contained within Rvir (hereafter the “virialized subsample”), to consider galaxies likely belonging to the true internal, virialized structure.

3.2 Analysis of the spectroscopic sample

We analyze the velocity distribution to look for possible deviations from Gaussianity that could provide important signatures of complex dynamics. For the following tests the null hypothesis is that the velocity distribution is a single Gaussian.

We estimate three shape estimators, i.e., the kurtosis, the skewness, and the scaled tail index (see, e.g., Beers et al. bee91 (1991)). The value of the skewness (-0.530) shows a marginal evidence that the velocity distribution differs from a Gaussian at the 9095%90percent9590-95\% c.l. (see Table 2 of Bird & Beers bir93 (1993)). Moreover, the W–test (Shapiro & Wilk sha65 (1965)) marginally rejects the null hypothesis of a Gaussian parent distribution at the 90%percent9090\% c.l.. The analysis of Sample2 also shows a marginal sign of non–Gaussianity having the kurtosis a value of 3.693 (at 9095%90percent9590-95\% c.l.).

Then we investigate the presence of gaps in the velocity distribution. A weighted gap in the space of the ordered velocities is defined as the difference between two contiguous velocities, weighted by the location of these velocities with respect to the middle of the data. We obtain values for these gaps relative to their average size, precisely the midmean of the weighted–gap distribution. We look for normalized gaps larger than 2.25 since in random draws of a Gaussian distribution they arise at most in about 3%percent33\% of the cases, independently of the sample size (Wainer and Schacht wai78 (1978); see also Beers et al. bee91 (1991)). We find five significant gaps (see Fig. 6), the main one lying in the body of the distribution at v29500similar-toabsent29500\sim 29500 km s11{}^{-1}\;and the secondary one separates the three galaxies with the lowest velocity from the body of the velocity distribution. In Table 3 we list the number of galaxies and the velocity of the object preceding the gap, the normalized size (i.e., the ”importance”) of the gap itself, and the probability of finding a normalized gap of this size with the same position in a normal distribution (as computed with ROSTAT package, Beers et al. bee90 (1990)). The importance of the main gap is confirmed by the analysis of Sample2.

We use the results of the gap analysis to determine the first guess when using the Kaye’s mixture model (KMM) to find a possible group partition of the velocity distribution (as implemented by Ashman et al. ash94 (1994)). The KMM algorithm fits an user–specified number of Gaussian distributions to a dataset and assesses the improvement of that fit over a single Gaussian. In addition, it provides the maximum–likelihood estimate of the unknown n–mode Gaussians and an assignment of objects into groups. KMM is most appropriate in situations where theoretical and/or empirical arguments indicate that a Gaussian model is reasonable. The Gaussian is valid in the case of cluster velocity distributions, where gravitational interactions drive the system toward a relaxed configuration with a Gaussian velocity distribution. However, one of the major uncertainties of this method is the optimal choice of the number of groups for the partition. Using the results of the gap analysis we try to fit two and three velocity groups on the basis of the two most important gaps.

We find that a two–groups partition is a significantly better descriptor of the velocity distribution with respect to a single Gaussian at the 9092%90percent9290-92\% c.l. (homoscedastic and heteroscedastic cases) where the first group is given by the three lowest velocity galaxies. Moreover, we find a significant three–groups partition of 3–34–20 galaxies (at the 96.8%percent96.896.8\% c.l. in the homoscedastic case). The KMM analysis of Sample2 confirms the presence of the two groups with 34 and 20 galaxies (at the 90%similar-toabsentpercent90\sim 90\% c.l.). Table 2 lists the results for the kinematical analysis of the groups with 3, 34, and 20 galaxies and Fig. 4 shows the corresponding Gaussians. We also list the virial radii and masses of the groups KMM2 and KMM3. They are computed assuming the dynamical equilibrium and adopting an alternative estimate for RPVsubscriptRPV{\rm R}_{\rm PV} useful when the centers of the systems are not well defined (see Barrena et al. 2007b , their Sect. 4). However, we point out that the uncertainty in KMM membership assignments leads to an artificial truncation of the tails of the velocity distributions, thus the velocity dispersions of the two groups are underestimated (see Bird bir94 (1994)). As a consequence, the masses of KMM2 and KMM3 should be considered only approximated lower limits.

Table 2: A610: Results of the kinematical analysis
SampleNg<v>σvaRvirMass(<Rvir)kms1kms1Mpc1014MWholesystem5729255±6649648+731.152.30.5+0.8WholesystemSample25429283±5842639+380.991.80.4+0.4Virializedsubsample2229312±10648059+711.111.80.5+0.6KMM1327766±89(118)KMM23429017±4022721+380.530.220.07+0.09KMM32029767±5423529+320.540.250.07+0.09missing-subexpressionmissing-subexpressionmissing-subexpressionmissing-subexpressionmissing-subexpressionmissing-subexpressionmissing-subexpressionmissing-subexpressionmissing-subexpressionmissing-subexpressionmissing-subexpressionmissing-subexpressionmissing-subexpressionmissing-subexpressionSamplesubscriptNgexpectationvsuperscriptsubscript𝜎vasubscriptRvirannotatedMassabsentsubscriptRvirmissing-subexpressionmissing-subexpressionkmsuperscripts1kmsuperscripts1Mpcsuperscript1014subscriptMdirect-productmissing-subexpressionmissing-subexpressionmissing-subexpressionmissing-subexpressionmissing-subexpressionmissing-subexpressionmissing-subexpressionWholesystem57plus-or-minus2925566superscriptsubscript49648731.15subscriptsuperscript2.30.80.5WholesystemSample254plus-or-minus2928358superscriptsubscript42639380.99subscriptsuperscript1.80.40.4Virializedsubsample22plus-or-minus29312106superscriptsubscript48059711.11subscriptsuperscript1.80.60.5KMM13plus-or-minus2776689118KMM234plus-or-minus2901740superscriptsubscript22721380.53superscriptsubscript0.220.070.09KMM320plus-or-minus2976754superscriptsubscript23529320.54superscriptsubscript0.250.070.09missing-subexpressionmissing-subexpressionmissing-subexpressionmissing-subexpressionmissing-subexpressionmissing-subexpressionmissing-subexpressionmissing-subexpression\begin{array}[]{l r l l c c}\hline\cr\vskip 3.0pt plus 1.0pt minus 1.0pt\cr\hline\cr\vskip 3.0pt plus 1.0pt minus 1.0pt\cr\mathrm{Sample}&\mathrm{N_{g}}&\phantom{249}\mathrm{<v>}\phantom{249}&\phantom{24}\sigma_{\rm v}^{\mathrm{a}}\phantom{24}&\mathrm{R_{vir}}&\mathrm{Mass(<R_{vir})}\\ &&\phantom{249}\mathrm{km\ s^{-1}}\phantom{249}&\phantom{2}\mathrm{km\ s^{-1}}\phantom{24}&\mathrm{Mpc}&10^{14}\mathrm{M}_{\odot}\\ \hline\cr\vskip 3.0pt plus 1.0pt minus 1.0pt\cr\mathrm{Whole\ system}&57&29255\pm 66&496_{-48}^{+73}&1.15&2.3^{+0.8}_{-0.5}\\ \mathrm{Whole\ system\ Sample2}&54&29283\pm 58&426_{-39}^{+38}&0.99&1.8^{+0.4}_{-0.4}\\ \mathrm{Virialized\ subsample}&22&29312\pm 106&480_{-59}^{+71}&1.11&1.8^{+0.6}_{-0.5}\\ \mathrm{KMM1}&3&27766\pm 89&(118)&-&-\\ \mathrm{KMM2}&34&29017\pm 40&227_{-21}^{+38}&0.53&0.22_{-0.07}^{+0.09}\\ \mathrm{KMM3}&20&29767\pm 54&235_{-29}^{+32}&0.54&0.25_{-0.07}^{+0.09}\\ \vskip 3.0pt plus 1.0pt minus 1.0pt\cr\hline\cr\vskip 3.0pt plus 1.0pt minus 1.0pt\cr\hline\cr\end{array}
  • a

    We use the biweigth estimator by Beers et al. (1990). For the sample with 3 galaxies we indicate the standard dispersion estimate.

Notice that the first and the second brightest galaxies of the cluster (galaxy IDs 91 and 99; hereafter we refer to them as BCMI and BCMII) are assigned to KMM3 and KMM1 groups. In particular, BCMI has a velocity very close to the mean velocity of its host KMM3 system, while it shows evidence of peculiarity according to the Indicator test by Gebhardt & Beers (geb91 (1991), at the >95%absentpercent95>95\% c.l.) with respect to the whole system. As for KMM2, it does not host very luminous galaxies. Indeed, not all galaxy systems are characterized by particularly bright galaxies. In particular, dominant galaxies are often absent in poorly evolved structures (see, for instance, the “irregular” and “flat” clusters according to the definition of Struble & Rood (str82 (1982)) and (str84 (1984))). The existence of a correlation between positions and velocities of cluster galaxies is a footprint of real substructures. To investigate the velocity field of the A610 complex we divide galaxies in a low and a high velocity samples by using the median cluster velocity and check the difference between the two distributions of galaxy positions. The two distributions are different at the 92.3%percent92.392.3\% c.l. according to the 2DKS–test. The same analysis on Sample2 leads to a difference at the 98.4%percent98.498.4\% c.l.. In order to estimate the direction of the velocity gradient we perform a multiple linear regression fit to the observed velocities with respect to the galaxy positions in the plane of the sky (see also den Hartog & Katgert den96 (1996); Girardi et al. gir96 (1996)). We find a position angle on the celestial sphere of PA=18419+25𝑃𝐴superscriptsubscript1841925PA=184_{-19}^{+25} degree (measured counter–clockwise from north, i.e., higher–velocity galaxies lie in the southern region), but marginally significant (at the 90%percent9090\% c.l.).

Looking for a correlation between positions and velocities, we also compare the KMM groups two–by–two by applying the 2DKS–test to the galaxy position of member galaxies. When comparing KMM2 with KMM3 we obtain a difference at the 99.88%percent99.8899.88\% c.l. and a marginal difference when comparing KMM1 with KMM2 (at the 90%percent9090\% c.l.). Figure 7 shows as the higher velocity KMM3 group lies SW with respect KMM2 group.

Table 3: A610: Results of the weighted–gap analysis
SampleNgals,precvprecSizeProb.of.detect.kms1Wholesample3279012.796.0E3Wholesample5284442.551.4E2Wholesample1728924a2.323.0E2Wholesample3629287a3.565.0E4Wholesample529521a2.731.4E2Virializedsample1429277b3.192.0E3missing-subexpressionmissing-subexpressionmissing-subexpressionmissing-subexpressionmissing-subexpressionmissing-subexpressionmissing-subexpressionmissing-subexpressionmissing-subexpressionmissing-subexpressionmissing-subexpressionmissing-subexpressionSamplesubscriptNgalsprecsubscriptvprecSizeformulae-sequenceProbofdetectmissing-subexpressionmissing-subexpressionkmsuperscripts1missing-subexpressionmissing-subexpressionmissing-subexpressionmissing-subexpressionmissing-subexpressionmissing-subexpressionmissing-subexpressionmissing-subexpressionWholesample3279012.796.0𝐸3Wholesample5284442.551.4𝐸2Wholesample17superscript28924a2.323.0𝐸2Wholesample36superscript29287a3.565.0𝐸4Wholesample5superscript29521a2.731.4𝐸2Virializedsample14superscript29277b3.192.0𝐸3missing-subexpressionmissing-subexpressionmissing-subexpressionmissing-subexpressionmissing-subexpressionmissing-subexpressionmissing-subexpression\begin{array}[]{l c l c c}\hline\cr\vskip 3.0pt plus 1.0pt minus 1.0pt\cr\hline\cr\vskip 3.0pt plus 1.0pt minus 1.0pt\cr\mathrm{Sample}&\mathrm{N_{gals,prec}}&\mathrm{v_{prec}}&\mathrm{Size}&\mathrm{Prob.of.detect.}\\ &&\mathrm{km\ s^{-1}}&&\\ \hline\cr\vskip 3.0pt plus 1.0pt minus 1.0pt\cr\mathrm{Whole\ sample}&3&27901&2.79&6.0E-3\\ \mathrm{Whole\ sample}&5&28444&2.55&1.4E-2\\ \mathrm{Whole\ sample}&17&28924^{\mathrm{a}}&2.32&3.0E-2\\ \mathrm{Whole\ sample}&36&29287^{\mathrm{a}}&3.56&5.0E-4\\ \mathrm{Whole\ sample}&5&29521^{\mathrm{a}}&2.73&1.4E-2\\ \mathrm{Virialized\ sample}&14&29277^{\mathrm{b}}&3.19&2.0E-3\\ \vskip 3.0pt plus 1.0pt minus 1.0pt\cr\hline\cr\vskip 3.0pt plus 1.0pt minus 1.0pt\cr\hline\cr\end{array}
  • a

    Gaps also found in Sample2.

  • b

    This gap corresponds to the most significant in the whole sample.

When limiting our analysis to the “virialized subsample” we find again: a marginal evidence of non–Gaussianity (at the 90-95%percent\% c.l. from the kurtosis of -0.849); the gap at 29500similar-toabsent29500\sim 29500 km s-1; a different spatial distribution between low and high velocity populations (at the >95%>absentpercent95\mathrel{\hbox{\hbox to0.0pt{\hbox{\lower 4.0pt\hbox{$\sim$}}\hss}\hbox{$>$}}}95\% c.l.). The presence of a velocity gradient is now significant at the 94%percent9494\% c.l. with a value of PA=6442+59𝑃𝐴superscriptsubscript644259PA=64_{-42}^{+59} and, in fact, the high velocity KMM3 galaxies lie NE in the central cluster region (see Fig. 7).

3.3 2D galaxy distribution

When applying the DEDICA method to the 2D distribution of the 57 cluster members we find two very significant peaks (at the >99.9absent99.9>99.9 c.l., see Fig. 8). The position of the highest peak is close to the location of the brightest cluster member. The secondary peak lies at 15similar-toabsent15\sim 15\mathrm{{}^{\prime}}\;East (1.6similar-toabsent1.6\sim 1.6 h701superscriptsubscript701h_{70}^{-1} Mpc) with respect to the BCMI. We compare the mean velocity of galaxies belonging to the main peak of our 2D analysis with that of galaxies belonging to the eastern secondary peak. We find no difference. This explains why the eastern structure is not detected in the analyses of Sect. 3.2.

Refer to caption
Figure 8: A610: spatial distribution on the sky of spectroscopically confirmed cluster members and the relative isodensity contour map. The brightest cluster member BCMI is indicated by a cross. The circle indicates the likely virialized region. The Eastern peak is indicated, too. The plot is centered on the cluster center defined as the position of BCMI.
Refer to caption
Figure 9: A610: isuperscript𝑖i^{\prime}zsuperscript𝑧z^{\prime} vs. risuperscript𝑟superscript𝑖r^{\prime}-i^{\prime} diagram for galaxies with available spectroscopy is shown by small crosses. The faint square is centered on the median value for colors of member galaxies (circles) and encloses galaxies having colors in the range of 0.08 mag from median values.
Refer to caption
Figure 10: A610: spatial distribution on the sky and relative isodensity contour map of the 357 likely cluster members (according to the color–color diagram) with r20superscript𝑟20r^{\prime}\leq 20, obtained with the DEDICA method. BCMI and BCMII are indicated by crosses. The circle indicates the likely virialized region. The Eastern peak and the Zw Cl0755.2+2649 are indicated, too.
Refer to caption
Figure 11: R𝑅R–band image of A725 (data taken with the WFC camera of the INT) with, superimposed, the contour levels of a radio image from the Westerbork Northern Sky Survey (WENSS; see Kempner & Sarazin kem01 (2001)). The arrow shows the position of the radio relic. North is at the top and East to the left.

Our spectroscopic data suffer from magnitude incompleteness. To overcome this limit we recover the photometric catalog extracted from the SDSS DR5.

The color–magnitude relation (hereafter CMR), which indicates the early–type galaxy locus, is usually applied to select likely cluster members (see, e.g., A725 in this paper and references therein). When more than two colors are available, it is more effective to select galaxies in color-color space. Here we consider the isuperscript𝑖i^{\prime}-zsuperscript𝑧z^{\prime} vs. rsuperscript𝑟r^{\prime}-isuperscript𝑖i^{\prime} plane where a rectangular box seems suitable for galaxy selection (e.g., Fig. 12 by Goto et al. goto02 (2002)). In particular, we consider likely members galaxies having rsuperscript𝑟r^{\prime} within 0.08 mags from rsuperscript𝑟r^{\prime}isuperscript𝑖i^{\prime}=0.41 and isuperscript𝑖i^{\prime}zsuperscript𝑧z^{\prime}=0.32, i.e., the median values recovered from the spectroscopically cluster members (see Fig. 9). The value of 0.08 mag is about two times the typical scatter reported by Goto et al. (goto02 (2002)) for the two CMRs rsuperscript𝑟r^{\prime}isuperscript𝑖i^{\prime} vs. rsuperscript𝑟r^{\prime} and isuperscript𝑖i^{\prime}zsuperscript𝑧z^{\prime} vs. rsuperscript𝑟r^{\prime}. To avoid contamination by field galaxies we do not show results for galaxies fainter than 20 mag (in rsuperscript𝑟r^{\prime}–band).

The contour map for the 357 likely cluster members having r20superscript𝑟20r^{\prime}\leq 20 is shown in Fig. 10. We also analyze galaxies likely members having r19superscript𝑟19r^{\prime}\leq 19 and 19<r2019superscript𝑟2019<r^{\prime}\leq 20 in a separate way. Our general results are the following. We confirm the presence of the eastern peak, which is generated by bright galaxies. The main structure, contained in the virialized region, shows a much more complex structure having two peaks centered around BCMII and BCMI.

Finally, we notice that the southern peak detected at the southern border of the field is Zwicky Cluster 0755.2+2649 (recognized by NED as the RXCJ 0758.3 at z=0.2315, Böhringer et al. boh00 (2000)).

4 Abell 725

Table 4: Velocity catalog of 51 spectroscopically measured galaxies in the field of A725. In Col. 1, IDs in italics indicate non–cluster galaxies. ID 24 (in boldface) is BCMI (see text).
IDα,δ(J2000)RBvΔv(kms1)108 58 55.32,+62 44 53.4807968208 58 58.09,+62 36 23.516.1818.352685039308 59 06.88,+62 34 20.717.7319.822769263408 59 17.09,+62 33 21.316.4318.072733952508 59 32.75,+62 20 45.916.8818.172738968608 59 36.97,+62 20 46.32747382708 59 41.35,+62 39 16.416.5318.504966395808 59 47.36,+62 37 58.617.6819.142826170908 59 55.76,+62 35 55.617.4519.2728561901009 00 22.25,+62 43 29.216.6118.6126269471109 00 22.42,+62 19 07.513495491209 00 25.98,+62 37 45.816.5218.6927461491309 00 32.55,+62 42 00.816.8118.9027293601409 00 35.62,+62 43 59.416.8318.5127457791509 00 37.96,+62 50 33.717.3719.1850005371609 00 38.09,+62 38 05.716.6718.66276201051709 00 42.36,+62 34 49.216.8619.04274141171809 00 48.50,+62 35 55.016.7918.2928471531909 00 55.68,+62 37 49.515.5717.6429360482009 00 55.72,+62 30 06.618.2519.8453737522109 00 57.04,+62 32 57.815.9118.1227235242209 00 58.85,+62 38 31.916.0916.8727739492309 01 03.65,+62 36 52.915.6217.6728023452409 01 09.99,+62 37 20.015.1216.4127104482509 01 11.08,+62 39 27.916.6118.7028324422609 01 14.79,+62 36 10.615.4417.5927449222709 01 34.70,+62 37 16.116.9919.14276161032809 01 34.95,+62 33 32.717.5618.6325973232909 01 35.40,+62 33 21.117.7519.12306261473009 01 36.99,+62 38 38.315.7917.8027716433109 01 40.93,+62 37 59.917.0119.0527942833209 01 49.97,+62 42 33.616.3718.3727018603309 01 52.04,+62 34 42.918.1519.20275371553409 01 52.15,+62 34 12.316.0818.2526873753509 02 06.50,+62 54 40.7909431013609 02 07.78,+62 40 40.716.2718.2426846843709 02 09.60,+62 19 30.4111341223809 02 09.98,+62 45 01.117.7019.6527530753909 02 15.21,+62 40 16.414.8817.1627108484009 02 16.28,+62 32 25.717.6619.6553311574109 02 19.33,+62 38 58.117.4019.1827659684209 02 19.51,+62 48 14.117.6619.1628592954309 02 19.58,+62 22 16.317.4619.7448789914409 02 20.67,+62 45 44.817.7219.5852418684509 02 29.76,+62 28 31.316.7718.75268781304609 02 57.75,+62 22 00.162471714709 02 58.11,+62 48 45.027632794809 02 58.30,+62 38 56.722394474909 03 01.38,+62 39 31.4222401035009 03 06.77,+62 49 39.627267735109 03 13.73,+62 38 32.55019783\begin{array}[]{r c c c r r}\hline\cr\vskip 3.0pt plus 1.0pt minus 1.0pt\cr\hline\cr\vskip 3.0pt plus 1.0pt minus 1.0pt\cr\mathrm{ID}&\mathrm{\alpha},\mathrm{\delta}\,(\mathrm{J}2000)&R&B&\mathrm{v}&\mathrm{\Delta}\mathrm{v}\\ &&&&\,\,\,\,\,\,\,\mathrm{(\,km}&\mathrm{s^{-1}\,)}\\ \hline\cr\vskip 3.0pt plus 1.0pt minus 1.0pt\cr\textit{1}&08\ 58\ 55.32,+62\ 44\ 53.4&-&-&8079&68\\ 2&08\ 58\ 58.09,+62\ 36\ 23.5&16.18&18.35&26850&39\\ 3&08\ 59\ 06.88,+62\ 34\ 20.7&17.73&19.82&27692&63\\ 4&08\ 59\ 17.09,+62\ 33\ 21.3&16.43&18.07&27339&52\\ 5&08\ 59\ 32.75,+62\ 20\ 45.9&16.88&18.17&27389&68\\ 6&08\ 59\ 36.97,+62\ 20\ 46.3&-&-&27473&82\\ \textit{7}&08\ 59\ 41.35,+62\ 39\ 16.4&16.53&18.50&49663&95\\ 8&08\ 59\ 47.36,+62\ 37\ 58.6&17.68&19.14&28261&70\\ 9&08\ 59\ 55.76,+62\ 35\ 55.6&17.45&19.27&28561&90\\ 10&09\ 00\ 22.25,+62\ 43\ 29.2&16.61&18.61&26269&47\\ \textit{11}&09\ 00\ 22.42,+62\ 19\ 07.5&-&-&13495&49\\ 12&09\ 00\ 25.98,+62\ 37\ 45.8&16.52&18.69&27461&49\\ 13&09\ 00\ 32.55,+62\ 42\ 00.8&16.81&18.90&27293&60\\ 14&09\ 00\ 35.62,+62\ 43\ 59.4&16.83&18.51&27457&79\\ \textit{15}&09\ 00\ 37.96,+62\ 50\ 33.7&17.37&19.18&50005&37\\ 16&09\ 00\ 38.09,+62\ 38\ 05.7&16.67&18.66&27620&105\\ 17&09\ 00\ 42.36,+62\ 34\ 49.2&16.86&19.04&27414&117\\ 18&09\ 00\ 48.50,+62\ 35\ 55.0&16.79&18.29&28471&53\\ 19&09\ 00\ 55.68,+62\ 37\ 49.5&15.57&17.64&29360&48\\ \textit{20}&09\ 00\ 55.72,+62\ 30\ 06.6&18.25&19.84&53737&52\\ 21&09\ 00\ 57.04,+62\ 32\ 57.8&15.91&18.12&27235&24\\ 22&09\ 00\ 58.85,+62\ 38\ 31.9&16.09&16.87&27739&49\\ 23&09\ 01\ 03.65,+62\ 36\ 52.9&15.62&17.67&28023&45\\ \textbf{24}&09\ 01\ 09.99,+62\ 37\ 20.0&15.12&16.41&27104&48\\ 25&09\ 01\ 11.08,+62\ 39\ 27.9&16.61&18.70&28324&42\\ 26&09\ 01\ 14.79,+62\ 36\ 10.6&15.44&17.59&27449&22\\ 27&09\ 01\ 34.70,+62\ 37\ 16.1&16.99&19.14&27616&103\\ 28&09\ 01\ 34.95,+62\ 33\ 32.7&17.56&18.63&25973&23\\ \textit{29}&09\ 01\ 35.40,+62\ 33\ 21.1&17.75&19.12&30626&147\\ 30&09\ 01\ 36.99,+62\ 38\ 38.3&15.79&17.80&27716&43\\ 31&09\ 01\ 40.93,+62\ 37\ 59.9&17.01&19.05&27942&83\\ 32&09\ 01\ 49.97,+62\ 42\ 33.6&16.37&18.37&27018&60\\ 33&09\ 01\ 52.04,+62\ 34\ 42.9&18.15&19.20&27537&155\\ 34&09\ 01\ 52.15,+62\ 34\ 12.3&16.08&18.25&26873&75\\ \textit{35}&09\ 02\ 06.50,+62\ 54\ 40.7&-&-&90943&101\\ 36&09\ 02\ 07.78,+62\ 40\ 40.7&16.27&18.24&26846&84\\ \textit{37}&09\ 02\ 09.60,+62\ 19\ 30.4&-&-&11134&122\\ 38&09\ 02\ 09.98,+62\ 45\ 01.1&17.70&19.65&27530&75\\ 39&09\ 02\ 15.21,+62\ 40\ 16.4&14.88&17.16&27108&48\\ \textit{40}&09\ 02\ 16.28,+62\ 32\ 25.7&17.66&19.65&53311&57\\ 41&09\ 02\ 19.33,+62\ 38\ 58.1&17.40&19.18&27659&68\\ 42&09\ 02\ 19.51,+62\ 48\ 14.1&17.66&19.16&28592&95\\ \textit{43}&09\ 02\ 19.58,+62\ 22\ 16.3&17.46&19.74&48789&91\\ \textit{44}&09\ 02\ 20.67,+62\ 45\ 44.8&17.72&19.58&52418&68\\ 45&09\ 02\ 29.76,+62\ 28\ 31.3&16.77&18.75&26878&130\\ \textit{46}&09\ 02\ 57.75,+62\ 22\ 00.1&-&-&62471&71\\ 47&09\ 02\ 58.11,+62\ 48\ 45.0&-&-&27632&79\\ \textit{48}&09\ 02\ 58.30,+62\ 38\ 56.7&-&-&22394&47\\ \textit{49}&09\ 03\ 01.38,+62\ 39\ 31.4&-&-&22240&103\\ 50&09\ 03\ 06.77,+62\ 49\ 39.6&-&-&27267&73\\ \textit{51}&09\ 03\ 13.73,+62\ 38\ 32.5&-&-&50197&83\\ \vskip 3.0pt plus 1.0pt minus 1.0pt\cr\hline\cr\vskip 3.0pt plus 1.0pt minus 1.0pt\cr\hline\cr\end{array}

A725 is a poor Abell cluster (Abell richness class=0). It is characterized by an irregular/clumpy galaxy distribution and a low X–ray luminosity LXsubscript𝐿XL_{\mathrm{X}}(0.1–2.4 keV)=0.80×1044h502absent0.80superscript1044superscriptsubscript502=0.80\times 10^{44}\ h_{50}^{-2} erg s-1 (Böhringer et al. boh00 (2000) in their cosmology).

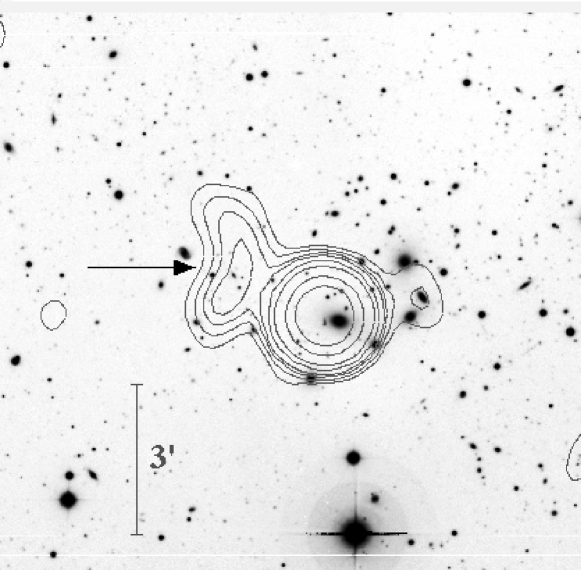
The brightest radio source in the cluster (see Fig. 11) is associated with the bright elliptical in the cluster center at z=0.0900±0.0002𝑧plus-or-minus0.09000.0002z=0.0900\pm 0.0002 (Owen et al. owe93 (1993); owe95 (1995)). The relic is seen as an arc of diffuse emission to the northeast of this source (Kempner & Sarazin kem01 (2001)). Kempner & Sarazin also noticed that the X–ray gas as seen in the ROSAT All–Sky Survey is slightly elongated along the axis connecting the relic and the cluster center.

Table 4 lists our velocity catalog and Fig. 12 shows the finding chart for the 51 galaxies in the field of A725. In Table 4, for each galaxy, we provide: identification number ID (Col. 1), right ascension and declination, α𝛼\alpha and δ𝛿\delta (J2000, Col. 2); R𝑅R and B𝐵B Johnson magnitudes (Cols. 3 and 4); heliocentric radial velocities, v=czv𝑐subscript𝑧{\rm v}=cz_{\sun} (Col. 5) with errors, ΔvΔv\Delta{\rm v} (Col. 6). The typical error on the radial velocity as given by the median value is 68 km s-1.

Refer to caption
Figure 12: DSS2 R𝑅R–band image of A725 (North at the top and East to the left). Galaxies with successful velocity measurements are labeled as in Table 4. Circles and boxes indicate cluster members and non–member galaxies, respectively.

4.1 Member selection and analysis

Out of 51 galaxies in the sample, the DEDICA method detects A725 as a one–peaked structure, populated by 36 galaxies with 25973v2936025973𝑣2936025973\leq v\leq 29360 km s-1(see Fig. 13). Out of the 15 non–member galaxies, 5 and 10 are foreground and background galaxies, respectively.

As for the cluster center, we consider the position of the brightest cluster member (BCMI; ID 24 in the velocity catalog), which was identified with the radio galaxy producing the brightest radio source (see above). No galaxy is rejected by the “shifting gapper” leading to a sample of 36 cluster members (see Table 4 and Fig. 14).

By applying the biweight estimators to cluster members (Beers et al. bee90 (1990)), we compute a mean cluster redshift of z=0.0917±delimited-⟨⟩𝑧limit-from0.0917plus-or-minus\left<z\right>=0.0917\pm 0.0003, i.e., v=27478±delimited-⟨⟩vlimit-from27478plus-or-minus\left<\rm{\rm v}\right>=27478\pm90 km s11{}^{-1}\;and σV=53497+132subscript𝜎Vsuperscriptsubscript53497132\sigma_{\rm V}=534_{-97}^{+132} km s-1. Assuming that the system is in dynamical equilibrium we compute for the radius of the virialized region R=vir1.24{}_{\rm vir}=1.24 h701superscriptsubscript701h_{70}^{-1} Mpc and M(<Rvir=1.24h701Mpc)=3.21.2+1.6M(<{\rm R}_{\rm vir}=1.24\,\;h_{70}^{-1}\mathrm{Mpc})=3.2_{-1.2}^{+1.6} ×1014h701Mabsentsuperscript1014superscriptsubscript701subscript𝑀direct-product\times 10^{14}\;h_{70}^{-1}\;M_{\odot}\;.

The values of the kurtosis (3.998) and the scaled tail index (1.504) indicate that the velocity distribution is lighter–tailed than a Gaussian at the 9095%90percent9590-95\% and the 9599%95percent9995-99\% c.l.s (see Table 2 of Bird & Beers bir93 (1993)), respectively. The BCMI shows evidence of peculiarity, according to the Indicator test by Gebhardt & Beers (geb91 (1991), at the >95%absentpercent95>95\% c.l.), with respect to the whole system. We do not find any other trace of substructure.

In this cluster, we find evidence of luminosity segregation. For the 33 galaxies having available magnitude, the magnitude R𝑅R correlates with the clustercentric distance at the 99.5%percent99.599.5\% c.l., according to the Spearman correlation coefficient.

4.2 2D galaxy distribution

By applying the DEDICA method to the 2D distribution of A725 cluster members we find that the cluster is elongated along the EW direction.

We recover our photometric catalog selecting likely members on the basis of the B𝐵BR𝑅R vs. R𝑅R relation (see, e.g., Barrena et al. 2007b ). To determine the relation we fix the slope according to López–Cruz et al. (lop04 (2004), see their Fig. 3) and apply the two–sigma–clipping fitting procedure to the cluster members obtaining B𝐵BR=2.9710.054×R𝑅2.9710.054𝑅R=2.971-0.054\times R. In our photometric catalog we consider galaxies (objects with SExtractor stellar index 0.9absent0.9\leq 0.9) lying within 0.25 mag of the relation. To avoid contamination by field galaxies we do not show results for galaxies fainter than 20 (in the R𝑅R–band).

The contour map for the 360 likely cluster members having R20𝑅20R\leq 20 is elongated along the E–W direction in the central region and the position of the density peak lies about 2\mathrm{{}^{\prime}}\;from the BCMI, assumed as cluster center (see Fig. 15). Moreover, the cluster shows an important secondary peak towards NE and the cluster itself appear elongated along the NE–SW direction (see the isodensity contours at the virial radius distance). Similar features are obtained analyzing other magnitudes cuts (R19𝑅19R\leq 19 or R18𝑅18R\leq 18).

Refer to caption
Figure 13: A725: redshift galaxy distribution. The solid line histogram refers to galaxies assigned to the cluster according to the DEDICA reconstruction method.
Refer to caption
Figure 14: A725: Bottom panel: rest–frame velocity vs. projected clustercentric distance for the 36 member galaxies. Top panel: velocity distribution of 36 cluster members. The arrow corresponds to the brightest cluster member.
Refer to caption
Figure 15: A725: spatial distribution on the sky and relative isodensity contour map of the 360 likely cluster members (according to the two colors selection) with R20𝑅20R\leq 20, obtained with the DEDICA method. The cross indicates the BCMI. The circle indicates the likely virialized region.

5 Abell 796

A796 is an Abell cluster of Abell richness class=1. It is characterized by a clumpy galaxy distribution and a low X–ray luminosity LXsubscript𝐿XL_{\mathrm{X}}(0.1–2.4 keV)=1.38×1044h502absent1.38superscript1044superscriptsubscript502=1.38\times 10^{44}\ h_{50}^{-2} erg s-1 (Kempner & Sarazin kem01 (2001) in their cosmology).

Table 5: Velocity catalog of 99 spectroscopically measured galaxies in the field of A796. In Col. 1, IDs in italics indicate non–cluster galaxies. IDs 54 and 56 (in boldface) are the brightest cluster members. Asterisks in Col. 1 highlight QSOs in the SDSS catalog.
IDα,δ(J2000)rvΔvSource09h,+60o(kms1)124 03.66,22 43.118.39289995375S224 24.87,14 59.218.61644626405S324 44.13,13 53.317.666839554S424 45.38,15 55.217.525986954S525 07.51,04 52.119.2713481784S625 13.33,10 39.217.68254929498S725 26.14,31 41.417.497774557S825 36.67,22 35.717.387952948S925 39.80,07 29.917.234724151S1025 50.79,17 13.219.384718778W1125 59.93,26 48.518.17191738492S1226 03.83,36 02.617.194665445S1326 12.49,21 02.719.27553642525S1426 14.75,25 58.419.39670723462S1526 19.73,30 15.718.127778445S1626 20.66,33 01.516.913378038W+S1726 23.36,42 20.117.323061518S1826 25.94,05 09.617.634621630S1926 30.12,48 30.317.004321842S2026 30.33,28 52.917.969011545S2126 34.66,23 39.817.933994657W2226 37.08,23 39.417.733970145S2326 39.52,37 01.016.972147870W+S2426 44.25,06 50.717.697595542S2526 46.11,03 39.717.214741848S2626 46.15,31 28.818.419082542S2726 49.47,27 24.218.224526256W2826 49.88,02 17.217.704749945S2926 50.12,24 36.717.603964842S3026 51.06,12 04.319.0010952139W3126 53.67,22 17.420.17455885468S3226 53.98,19 27.017.914706669W3326 55.38,06 49.318.915362164W3426 56.95,25 04.319.1488614813317S3526 59.88,48 05.415.393068145S3627 01.69,03 37.317.675336045S\begin{array}[]{r c c r r c}\hline\cr\vskip 3.0pt plus 1.0pt minus 1.0pt\cr\hline\cr\vskip 3.0pt plus 1.0pt minus 1.0pt\cr\mathrm{ID}&\mathrm{\alpha},\mathrm{\delta}\,(\mathrm{J}2000)&r^{\prime}&\mathrm{v}&\mathrm{\Delta}\mathrm{v}&\mathrm{Source}\\ &09^{\mathrm{h}},+60^{\mathrm{o}}&&\,\,\,\,\,\,\,\mathrm{(\,km}&\mathrm{s^{-1}\,)}&\\ \hline\cr\vskip 3.0pt plus 1.0pt minus 1.0pt\cr\textit{1}*&24\ 03.66,22\ 43.1&18.39&289995&375&\mathrm{S}\\ \textit{2}*&24\ 24.87,14\ 59.2&18.61&644626&405&\mathrm{S}\\ \textit{3}&24\ 44.13,13\ 53.3&17.66&68395&54&\mathrm{S}\\ \textit{4}&24\ 45.38,15\ 55.2&17.52&59869&54&\mathrm{S}\\ \textit{5}&25\ 07.51,04\ 52.1&19.27&134817&84&\mathrm{S}\\ \textit{6}*&25\ 13.33,10\ 39.2&17.68&254929&498&\mathrm{S}\\ \textit{7}&25\ 26.14,31\ 41.4&17.49&77745&57&\mathrm{S}\\ \textit{8}&25\ 36.67,22\ 35.7&17.38&79529&48&\mathrm{S}\\ 9&25\ 39.80,07\ 29.9&17.23&47241&51&\mathrm{S}\\ 10&25\ 50.79,17\ 13.2&19.38&47187&78&\mathrm{W}\\ \textit{11}*&25\ 59.93,26\ 48.5&18.17&191738&492&\mathrm{S}\\ 12&26\ 03.83,36\ 02.6&17.19&46654&45&\mathrm{S}\\ \textit{13}*&26\ 12.49,21\ 02.7&19.27&553642&525&\mathrm{S}\\ \textit{14}*&26\ 14.75,25\ 58.4&19.39&670723&462&\mathrm{S}\\ \textit{15}&26\ 19.73,30\ 15.7&18.12&77784&45&\mathrm{S}\\ \textit{16}&26\ 20.66,33\ 01.5&16.91&33780&38&\mathrm{W+S}\\ \textit{17}&26\ 23.36,42\ 20.1&17.32&30615&18&\mathrm{S}\\ 18&26\ 25.94,05\ 09.6&17.63&46216&30&\mathrm{S}\\ \textit{19}&26\ 30.12,48\ 30.3&17.00&43218&42&\mathrm{S}\\ \textit{20}&26\ 30.33,28\ 52.9&17.96&90115&45&\mathrm{S}\\ \textit{21}&26\ 34.66,23\ 39.8&17.93&39946&57&\mathrm{W}\\ \textit{22}&26\ 37.08,23\ 39.4&17.73&39701&45&\mathrm{S}\\ \textit{23}&26\ 39.52,37\ 01.0&16.97&21478&70&\mathrm{W+S}\\ \textit{24}&26\ 44.25,06\ 50.7&17.69&75955&42&\mathrm{S}\\ 25&26\ 46.11,03\ 39.7&17.21&47418&48&\mathrm{S}\\ \textit{26}&26\ 46.15,31\ 28.8&18.41&90825&42&\mathrm{S}\\ 27&26\ 49.47,27\ 24.2&18.22&45262&56&\mathrm{W}\\ 28&26\ 49.88,02\ 17.2&17.70&47499&45&\mathrm{S}\\ \textit{29}&26\ 50.12,24\ 36.7&17.60&39648&42&\mathrm{S}\\ \textit{30}&26\ 51.06,12\ 04.3&19.00&10952&139&\mathrm{W}\\ \textit{31}*&26\ 53.67,22\ 17.4&20.17&455885&468&\mathrm{S}\\ 32&26\ 53.98,19\ 27.0&17.91&47066&69&\mathrm{W}\\ \textit{33}&26\ 55.38,06\ 49.3&18.91&53621&64&\mathrm{W}\\ \textit{34}*&26\ 56.95,25\ 04.3&19.14&886148&13317&\mathrm{S}\\ \textit{35}&26\ 59.88,48\ 05.4&15.39&30681&45&\mathrm{S}\\ \textit{36}&27\ 01.69,03\ 37.3&17.67&53360&45&\mathrm{S}\\ \vskip 3.0pt plus 1.0pt minus 1.0pt\cr\hline\cr\vskip 3.0pt plus 1.0pt minus 1.0pt\cr\hline\cr\end{array}
Table 5: Continued.
IDα,δ(J2000)rvΔvSource09h,+60o(kms1)3727 07.68,31 50.717.614687275W3827 07.80,32 27.317.264319837W+S3927 14.41,38 43.919.025424158W4027 14.95,22 49.618.483074348W4127 16.64,35 02.617.574334133W+S4227 25.60,22 16.216.463052229W+S4327 29.10,19 51.017.806918231W4427 29.38,27 07.817.724671734W4527 34.31,11 07.517.052248040W+S4627 40.19,27 47.217.584676731W+S4727 40.83,26 50.418.1645407110W4827 42.87,40 24.918.6533263109W4927 44.28,08 39.318.292131598W5027 47.09,31 00.917.874692143W5127 52.10,34 01.717.733992283W5227 53.74,24 20.316.52128639S5327 58.61,26 17.717.2946961122W5428 00.65,26 26.816.964603829W+S5528 03.20,24 15.718.724722943W5628 10.75,28 15.016.944693439W+S5728 11.89,45 19.816.943960042S5828 12.80,22 16.717.624753437W+S5928 14.76,02 07.517.593004839S6028 19.76,49 47.316.262698748S6128 24.54,14 19.416.972279720W+S6228 24.54,23 34.817.844729040W6328 27.29,27 24.118.774655458W6428 33.51,18 45.618.793596466W6528 37.98,25 21.016.8688574477S6628 41.44,05 16.618.404877064W6728 44.90,25 45.817.404620439S6828 50.43,48 40.918.308807648S6928 55.52,51 33.617.567327245S7028 57.65,52 49.417.093586445S\begin{array}[]{r c c r r c}\hline\cr\vskip 3.0pt plus 1.0pt minus 1.0pt\cr\hline\cr\vskip 3.0pt plus 1.0pt minus 1.0pt\cr\mathrm{ID}&\mathrm{\alpha},\mathrm{\delta}\,(\mathrm{J}2000)&r^{\prime}&\mathrm{v}&\mathrm{\Delta}\mathrm{v}&\mathrm{Source}\\ &09^{\mathrm{h}},+60^{\mathrm{o}}&&\,\,\,\,\,\,\,\mathrm{(\,km}&\mathrm{s^{-1}\,)}&\\ \hline\cr\vskip 3.0pt plus 1.0pt minus 1.0pt\cr 37&27\ 07.68,31\ 50.7&17.61&46872&75&\mathrm{W}\\ \textit{38}&27\ 07.80,32\ 27.3&17.26&43198&37&\mathrm{W+S}\\ \textit{39}&27\ 14.41,38\ 43.9&19.02&54241&58&\mathrm{W}\\ \textit{40}&27\ 14.95,22\ 49.6&18.48&30743&48&\mathrm{W}\\ \textit{41}&27\ 16.64,35\ 02.6&17.57&43341&33&\mathrm{W+S}\\ \textit{42}&27\ 25.60,22\ 16.2&16.46&30522&29&\mathrm{W+S}\\ \textit{43}&27\ 29.10,19\ 51.0&17.80&69182&31&\mathrm{W}\\ 44&27\ 29.38,27\ 07.8&17.72&46717&34&\mathrm{W}\\ \textit{45}&27\ 34.31,11\ 07.5&17.05&22480&40&\mathrm{W+S}\\ 46&27\ 40.19,27\ 47.2&17.58&46767&31&\mathrm{W+S}\\ 47&27\ 40.83,26\ 50.4&18.16&45407&110&\mathrm{W}\\ \textit{48}&27\ 42.87,40\ 24.9&18.65&33263&109&\mathrm{W}\\ \textit{49}&27\ 44.28,08\ 39.3&18.29&21315&98&\mathrm{W}\\ 50&27\ 47.09,31\ 00.9&17.87&46921&43&\mathrm{W}\\ \textit{51}&27\ 52.10,34\ 01.7&17.73&39922&83&\mathrm{W}\\ \textit{52}&27\ 53.74,24\ 20.3&16.52&1286&39&\mathrm{S}\\ 53&27\ 58.61,26\ 17.7&17.29&46961&122&\mathrm{W}\\ \textbf{54}&28\ 00.65,26\ 26.8&16.96&46038&29&\mathrm{W+S}\\ 55&28\ 03.20,24\ 15.7&18.72&47229&43&\mathrm{W}\\ \textbf{56}&28\ 10.75,28\ 15.0&16.94&46934&39&\mathrm{W+S}\\ \textit{57}&28\ 11.89,45\ 19.8&16.94&39600&42&\mathrm{S}\\ 58&28\ 12.80,22\ 16.7&17.62&47534&37&\mathrm{W+S}\\ \textit{59}&28\ 14.76,02\ 07.5&17.59&30048&39&\mathrm{S}\\ \textit{60}&28\ 19.76,49\ 47.3&16.26&26987&48&\mathrm{S}\\ \textit{61}&28\ 24.54,14\ 19.4&16.97&22797&20&\mathrm{W+S}\\ 62&28\ 24.54,23\ 34.8&17.84&47290&40&\mathrm{W}\\ 63&28\ 27.29,27\ 24.1&18.77&46554&58&\mathrm{W}\\ \textit{64}&28\ 33.51,18\ 45.6&18.79&35964&66&\mathrm{W}\\ \textit{65}*&28\ 37.98,25\ 21.0&16.86&88574&477&\mathrm{S}\\ 66&28\ 41.44,05\ 16.6&18.40&48770&64&\mathrm{W}\\ 67&28\ 44.90,25\ 45.8&17.40&46204&39&\mathrm{S}\\ \textit{68}&28\ 50.43,48\ 40.9&18.30&88076&48&\mathrm{S}\\ \textit{69}&28\ 55.52,51\ 33.6&17.56&73272&45&\mathrm{S}\\ \textit{70}&28\ 57.65,52\ 49.4&17.09&35864&45&\mathrm{S}\\ \vskip 3.0pt plus 1.0pt minus 1.0pt\cr\hline\cr\vskip 3.0pt plus 1.0pt minus 1.0pt\cr\hline\cr\end{array}
Table 5: Continued.
IDα,δ(J2000)rvΔvSource09h,+60o(kms1)7128 59.48,20 50.416.962273437W+S7229 15.19,14 56.919.364781962W7329 18.14,17 06.319.03665093435S7429 27.43,18 03.417.163594135W+S7529 29.47,02 51.217.384888442S7629 32.16,37 09.117.133596338W+S7729 35.13,33 06.217.304403941W+S7829 50.93,14 54.616.924771545S7929 55.21,23 17.216.253607923W+S8029 58.50,12 04.618.398052262W8129 59.36,14 46.117.625417039W+S8230 04.28,39 30.018.43233694345S8330 06.44,26 53.416.9340863S8430 09.12,28 05.616.29407221W+S8530 14.03,21 04.617.664297832W+S8630 26.63,26 48.818.7211766100W8730 30.62,22 05.018.345002335W8830 33.74,12 17.617.564615942S8930 45.28,14 23.017.516562251S9030 51.94,23 01.119.491111330240S9130 55.40,04 36.719.3016360069S9231 05.10,16 19.517.144290042S9331 05.32,14 01.117.305386745S9431 09.48,14 59.915.69776527S9531 11.54,37 44.517.533383533S9631 13.88,06 29.119.12187991417S9731 17.95,36 03.216.464421945S9831 25.83,16 50.417.504306242S9931 30.71,11 06.319.00436147687S\begin{array}[]{r c c r r c}\hline\cr\vskip 3.0pt plus 1.0pt minus 1.0pt\cr\hline\cr\vskip 3.0pt plus 1.0pt minus 1.0pt\cr\mathrm{ID}&\mathrm{\alpha},\mathrm{\delta}\,(\mathrm{J}2000)&r^{\prime}&\mathrm{v}&\mathrm{\Delta}\mathrm{v}&\mathrm{Source}\\ &09^{\mathrm{h}},+60^{\mathrm{o}}&&\,\,\,\,\,\,\,\mathrm{(\,km}&\mathrm{s^{-1}\,)}&\\ \hline\cr\vskip 3.0pt plus 1.0pt minus 1.0pt\cr\textit{71}&28\ 59.48,20\ 50.4&16.96&22734&37&\mathrm{W+S}\\ 72&29\ 15.19,14\ 56.9&19.36&47819&62&\mathrm{W}\\ \textit{73}*&29\ 18.14,17\ 06.3&19.03&665093&435&\mathrm{S}\\ \textit{74}&29\ 27.43,18\ 03.4&17.16&35941&35&\mathrm{W+S}\\ 75&29\ 29.47,02\ 51.2&17.38&48884&42&\mathrm{S}\\ \textit{76}&29\ 32.16,37\ 09.1&17.13&35963&38&\mathrm{W+S}\\ \textit{77}&29\ 35.13,33\ 06.2&17.30&44039&41&\mathrm{W+S}\\ 78&29\ 50.93,14\ 54.6&16.92&47715&45&\mathrm{S}\\ \textit{79}&29\ 55.21,23\ 17.2&16.25&36079&23&\mathrm{W+S}\\ \textit{80}&29\ 58.50,12\ 04.6&18.39&80522&62&\mathrm{W}\\ \textit{81}&29\ 59.36,14\ 46.1&17.62&54170&39&\mathrm{W+S}\\ \textit{82}*&30\ 04.28,39\ 30.0&18.43&233694&345&\mathrm{S}\\ \textit{83}&30\ 06.44,26\ 53.4&16.93&4086&3&\mathrm{S}\\ \textit{84}&30\ 09.12,28\ 05.6&16.29&4072&21&\mathrm{W+S}\\ \textit{85}&30\ 14.03,21\ 04.6&17.66&42978&32&\mathrm{W+S}\\ \textit{86}&30\ 26.63,26\ 48.8&18.72&11766&100&\mathrm{W}\\ \textit{87}&30\ 30.62,22\ 05.0&18.34&50023&35&\mathrm{W}\\ 88&30\ 33.74,12\ 17.6&17.56&46159&42&\mathrm{S}\\ \textit{89}&30\ 45.28,14\ 23.0&17.51&65622&51&\mathrm{S}\\ \textit{90}*&30\ 51.94,23\ 01.1&19.49&1111330&240&\mathrm{S}\\ \textit{91}&30\ 55.40,04\ 36.7&19.30&163600&69&\mathrm{S}\\ \textit{92}&31\ 05.10,16\ 19.5&17.14&42900&42&\mathrm{S}\\ \textit{93}&31\ 05.32,14\ 01.1&17.30&53867&45&\mathrm{S}\\ \textit{94}&31\ 09.48,14\ 59.9&15.69&7765&27&\mathrm{S}\\ \textit{95}&31\ 11.54,37\ 44.5&17.53&33835&33&\mathrm{S}\\ \textit{96}&31\ 13.88,06\ 29.1&19.12&187991&417&\mathrm{S}\\ \textit{97}&31\ 17.95,36\ 03.2&16.46&44219&45&\mathrm{S}\\ \textit{98}&31\ 25.83,16\ 50.4&17.50&43062&42&\mathrm{S}\\ \textit{99}*&31\ 30.71,11\ 06.3&19.00&436147&687&\mathrm{S}\\ \vskip 3.0pt plus 1.0pt minus 1.0pt\cr\hline\cr\vskip 3.0pt plus 1.0pt minus 1.0pt\cr\hline\cr\end{array}\\

Kempner & Sarazin (kem01 (2001)) found a centrally–located diffuse radio emission which is quite large and has a very low surface brightness. When converting in our cosmology the X–ray luminosity and the radio halo power by Kempner & Sarazin (kem01 (2001)), we find LXsubscript𝐿XL_{\mathrm{X}}(0.1–2.4 keV)=0.93×1044h702absentsuperscript1044superscriptsubscript702\times 10^{44}\,h_{70}^{-2} erg s-1 and P1.4GHz=(5.6±2.1)×1023subscript𝑃1.4GHzplus-or-minus5.62.1superscript1023P_{\rm 1.4\,GHz}=(5.6\pm 2.1)\times 10^{23} W Hz-1, respectively. These nominal values stay far from the correlation between radio power and X–ray luminosity as given by Cassano et al. (cas06 (2006); see their Fig. 1). However, the halo is uncertain and the error on the radio power is so large that deeper imaging is needed to confirm the presence of the radio halo and to measure its flux with greater precision. Owen et al. (owe93 (1993)) found two close radio galaxies in the field of this cluster. The radio source A is here identified with a background AGN (ID 65 at z0.295similar-to𝑧0.295z\sim 0.295 in our catalog, see below), while we have no z𝑧z for the radio source B.

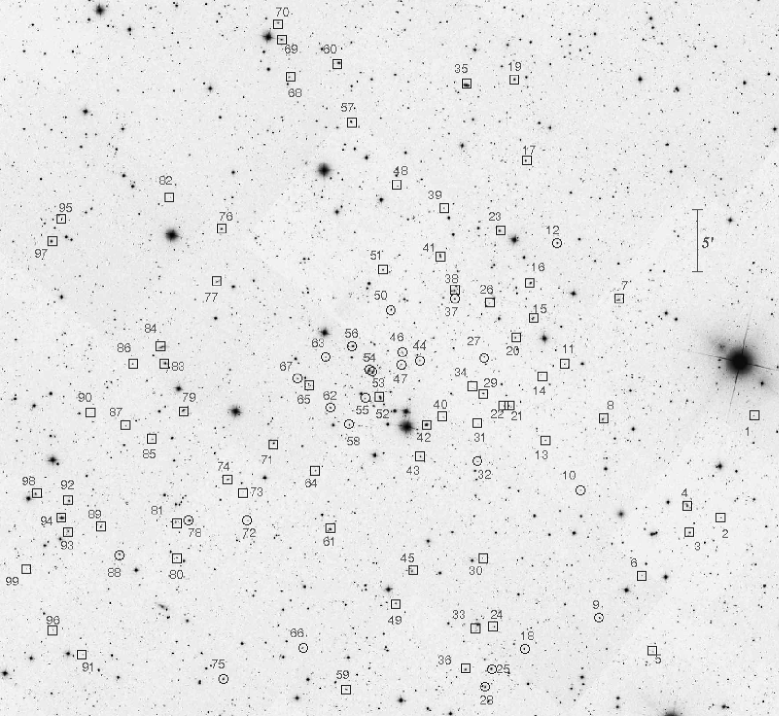
Table 5 lists our velocity catalog, and Fig. 16 shows the finding chart for the 99 galaxies in the field of A796. In Table 5, for each galaxy we provide: identification number ID (Col. 1), right ascension and declination, α𝛼\alpha and δ𝛿\delta (J2000, Col. 2); rsuperscript𝑟r^{\prime} SDSS magnitudes (Col. 3); heliocentric radial velocities, v=czv𝑐subscript𝑧{\rm v}=cz_{\sun} (Col. 4) with errors, ΔvΔv\Delta{\rm v} (Col. 5); source of velocity data (W: WHT, S: SDSS, W+S: combined WHT and SDSS) in Col. 6. The typical error on radial velocity as given by the median value is 45 km s-1.

5.1 Member selection and analysis

Refer to caption
Figure 16: SDSS image of A796 (North at the top and East to the left). Galaxies with successful velocity measurements are labeled as in Table 5. Circles and boxes indicate cluster members and non–member galaxies, respectively.

Out of 99 galaxies in the sample, the DEDICA method detects A796 as a one–peaked structure, populated by 27 galaxies with 45242v5002345242𝑣5002345242\leq v\leq 50023 km s-1(see Fig. 17). Out of the non–member galaxies, 38 and 34 are foreground and background galaxies, respectively.

As for the cluster center, we consider the position of the peak in the 2D galaxy distribution as determined by the 2D DEDICA method [R.A.=09h27m57s. 55superscript09hsuperscript27m57s.5509^{\mathrm{h}}27^{\mathrm{m}}57\,\hbox to0.0pt{\hbox{$\mathrm{{}^{s}}$}\hss}{\hbox{$.$}}\,55, Dec.=+602633. 7+60\mathrm{{}^{\circ}}26\mathrm{{}^{\prime}}33\,\hbox to0.0pt{\hbox{$\mathrm{{}^{\prime}\hskip-1.00006pt{}^{\prime}}$}\hss}{\hbox{$.$}}\,7 (J2000)]. Only one galaxy is then rejected by the “shifting gapper” leading to a sample of 26 cluster members (see Table 5 and Fig. 18).

Figure 18 also shows the velocity (with respect to the cluster mean) of the two luminous cluster galaxies, IDs 56 and 54. They have a comparable rsuperscript𝑟r^{\prime} magnitude, but while ID 54 lies somewhat closer to the cluster center, ID 56 lies <<\mathrel{\hbox{\hbox to0.0pt{\hbox{\lower 4.0pt\hbox{$\sim$}}\hss}\hbox{$<$}}} 0.4 h701superscriptsubscript701h_{70}^{-1} Mpc from the cluster center. Hereafter, we refer to IDs 56 and 54 as BCMInc and BCMI, respectively.

By applying the biweight estimators to 26 cluster members (Beers et al. bee90 (1990)), we compute a mean cluster redshift of z=0.1566±delimited-⟨⟩𝑧limit-from0.1566plus-or-minus\left<z\right>=0.1566\pm 0.0005, i.e., v=46942±delimited-⟨⟩vlimit-from46942plus-or-minus\left<\rm{\rm v}\right>=46942\pm140 km s11{}^{-1}\;and σV=698159+216subscript𝜎Vsuperscriptsubscript698159216\sigma_{\rm V}=698_{-159}^{+216} km s-1. Assuming that the system is in dynamical equilibrium we compute for the radius of the virialized region R=vir1.57{}_{\rm vir}=1.57 h701superscriptsubscript701h_{70}^{-1} Mpc and the virial mass M(<Rvir=1.57h701Mpc)=6.93.0+4.0M(<{\rm R}_{\rm vir}=1.57\,\;h_{70}^{-1}\mathrm{Mpc})=6.9_{-3.0}^{+4.0} ×1014h701Mabsentsuperscript1014superscriptsubscript701subscript𝑀direct-product\times 10^{14}\;h_{70}^{-1}\;M_{\odot}\;.

We also consider an alternative sample of 24 galaxies – Sample2 – rejecting the two galaxies with the highest velocity that are separated by a gap of 820similar-toabsent820\sim 820 km s11{}^{-1}\;in the reference frame from the whole velocity distribution of the cluster (see Fig. 18). This gap is detected with a significance level of (1–3.0E–2) in the velocity distribution (see Fig. 19). The properties of Sample2 are listed in Table 6.

We also present the analysis of the 14 galaxies which are the subsample of Sample2 contained within Rvir (hereafter the “virialized subsample”) to consider galaxies likely belonging to the true internal, virialized structure.

Considering the whole sample of 26 galaxies we find the presence of a velocity gradient at the 98.9%percent98.998.9\% c.l., with high velocity galaxies SSE located (PA=15626+21𝑃𝐴superscriptsubscript1562621PA=156_{-26}^{+21}). Accordingly, the two subsamples of galaxies having lower or higher velocity than the median velocity show different distributions in the sky (at the 99.5%percent99.599.5\% according to the 2DKS test). Moreover, the Dressler–Schectman test finds substructure at the 96% c.l.. However, these pieces of evidence of correlation between velocities and positions are no longer detected when we analyze Sample2 and the “virialized sample”. Thus, we suspect that the correlations found are not really due to cluster structure, but rather to the large–scale structure environment. On the other hand the direction of the velocity gradient coincides with that shown by the cluster elongation in the 2D analysis (see in the following). In all our three samples, the BCMI shows evidence of peculiarity according to the Indicator test by Gebhardt & Beers (geb91 (1991), at the >95%absentpercent95>95\% c.l.) with respect to the whole system.

Considering Sample2, we find a weighted gap which separates the velocity distribution in a low and a high velocity set (see Fig. 19). Very interestingly, the two most luminous galaxies BCMI and BCMInc lie in the low and high velocity sets, respectively. This is suggestive of a situation similar to that of A610, i.e., a possible merger between two subclusters.

5.2 2D galaxy distribution

When applying the DEDICA method to the 2D distribution of A796 galaxy members we find that the cluster is elongated along the SE–NW direction. To check this finding we recover the photometric catalog extracted from the SDSS DR5. Figure 20 shows the result of the DEDICA method applied to the r20superscript𝑟20r^{\prime}\leq 20 likely members selected on the basis of their colors – i.e., only galaxies lying within 0.08 mags from rsuperscript𝑟r^{\prime}isuperscript𝑖i^{\prime}=0.46 and isuperscript𝑖i^{\prime}zsuperscript𝑧z^{\prime}=0.33 colors. We confirm the cluster elongation finding two minor peaks in the SE and NW directions. Similar results are found for different magnitude cuts r19superscript𝑟19r^{\prime}\leq 19 and r21superscript𝑟21r^{\prime}\leq 21.

6 Summary & conclusions

Refer to caption
Figure 17: A796: redshift galaxy distribution of only galaxies with z<0.6𝑧0.6z<0.6. Top panel. Whole catalog: the solid line histogram refers to galaxies assigned to the cluster according to the DEDICA reconstruction method. Bottom panel. The same for galaxies within 15\mathrm{{}^{\prime}}\;from the cluster center.
Refer to caption
Figure 18: A796: Bottom panel: rest–frame velocity vs. projected clustercentric distance for the 27 galaxies in the main peak (Fig. 3) showing galaxies detected as interloper by our “shifting gapper” procedure (crosses). Squares indicate galaxies forming the sample of member galaxies. The two galaxies with the highest velocities are rejected to build Sample2 (see text). Top panel: velocity distribution of the 26 cluster members and the rejected galaxy (solid and dashed histograms). Arrows correspond to the two luminous member galaxies.

We present the results of a dynamical analysis of the three poor, low X–ray luminous clusters A610, A725, and A796 containining diffuse radio sources (relic, relic, and a possible halo, respectively). Our analysis is based on new redshift data for 158 galaxies obtained at the WHT and additional SDSS DR5 data for A610 and A796. We also use new photometric data obtained at the INT for A725.

We select 57, 36 and 26 cluster members for A610, A725 and A796, respectively. Out of these galaxies 35, 36 and 17 were measured by the WHT.

Refer to caption
Figure 19: A796: stripe density plot where the big (small) arrow indicates the position of the significant gap in the velocity distribution of the whole system (Sample2).
Refer to caption
Figure 20: A796: spatial distribution on the sky and relative isodensity contour map of the 349 likely cluster members (according to the two colors selection) with r20superscript𝑟20r^{\prime}\leq 20, obtained with the DEDICA method. The circle indicates the likely virialized region. The crosses indicate the two most luminous galaxies BCMI and BCMInc.

The low values we compute for the global LOS velocity dispersion of galaxies (σV=420700subscript𝜎V420700\sigma_{\rm V}=420-700 km s-1) confirm that these clusters are low–mass clusters. Table 7 summarizes the main cluster properties as recovered in this study. Using the σVTXsubscript𝜎Vsubscript𝑇X\sigma_{\rm V}-T_{\rm X} relation by Girardi et al. (gir98 (1998)) the range of expected X–ray temperature of the intracluster gas is TX=23subscript𝑇X23T_{\rm X}=2-3 keV. The study of these three clusters indicates that the phenomenon of diffuse radio sources is not limited to massive clusters only.

We also discuss the dynamical status and the possible connection with the diffuse sources of each individual cluster. Regarding the two clusters hosting a radio relic, A610 and A725, the former is better sampled and can be analyzed in greater detail. A610 shows a lot of evidence of substructure: the non–Gaussianity of the velocity distribution, the correlation between galaxy velocities and positions and the peculiarity of the BCMI in the velocity space. A610 seems formed by two structures separated by 700similar-toabsent700\sim 700 km s11{}^{-1}\;in the cluster rest-frame, having comparable σV200similar-tosubscript𝜎V200\sigma_{\rm V}\sim 200 km s11{}^{-1}\;and likely causing a velocity gradient. Moreover, the BCMI velocity is very close to the mean velocity of the higher velocity structure. A third small, low velocity group hosts the BCMII. The analysis of the 2D galaxy distribution shows a bimodal distribution in the core – elongated in the SE-NW direction and likely associated to BCMI and BCMII groups – as well as the presence of an eastern group just outside the virialized region. In this chaotic scenario, it is not easy to unveil the event responsible for the relic. One possibility is that the relic be associated to the likely merger between the two structures corresponding to BCMI and BCMII. In this case it would be somewhat perpendicular to the axis connecting the two merging structures (see Fig. 1) in agreement with being originated by shock waves connected to the ongoing merger (e.g., Ensslin & Brüggen ens02 (2002)). Another possibility is that the relic be related to the merger between the two main velocity structures forming the cluster (see Fig. 4). This would be more likely from the energetic point of view since this merger involves structures of 1:1 mass ratio. In conclusion, A610 represents another case of a radio cluster formed by two merging subclusters, like, e.g., A115 (Barrena et al. 2007b ); A2744 (Boschin et al. bos06 (2006)); and A773 (Barrena et al. 2007a ), but at much smaller scales (global σV500similar-tosubscript𝜎V500\sigma_{\rm V}\sim 500 km s11{}^{-1}\;vs. σV>1000subscript𝜎V1000\sigma_{\rm V}>1000 km s-1). As a further support to the merging scenario, we notice that the BCMI of A610 is also a bright radio source with a WAT structure. This is very interesting because WATs are only found in galaxy clusters and are excellent probes of the gas–dynamical processes occuring during a cluster merger (e.g., Gómez et al. gom97 (1997)).

Table 6: A796: Results of the kinematical analysis
SampleNg<v>σvRvirMass(<Rvir)kms1kms1Mpc1014MWholesystem2646942±140698159+2161.576.93.0+4.0WholesystemSample22446921±12057173+1341.293.92.2+2.4Virializedsubsample1446796±165586148+1711.324.61.6+2.4missing-subexpressionmissing-subexpressionmissing-subexpressionmissing-subexpressionmissing-subexpressionmissing-subexpressionmissing-subexpressionmissing-subexpressionmissing-subexpressionmissing-subexpressionmissing-subexpressionmissing-subexpressionmissing-subexpressionmissing-subexpressionSamplesubscriptNgexpectationvsubscript𝜎vsubscriptRvirannotatedMassabsentsubscriptRvirmissing-subexpressionmissing-subexpressionkmsuperscripts1kmsuperscripts1Mpcsuperscript1014subscriptMdirect-productmissing-subexpressionmissing-subexpressionmissing-subexpressionmissing-subexpressionmissing-subexpressionmissing-subexpressionmissing-subexpressionWholesystem26plus-or-minus46942140superscriptsubscript6981592161.57subscriptsuperscript6.94.03.0WholesystemSample224plus-or-minus46921120superscriptsubscript571731341.29subscriptsuperscript3.92.42.2Virializedsubsample14plus-or-minus46796165superscriptsubscript5861481711.32subscriptsuperscript4.62.41.6missing-subexpressionmissing-subexpressionmissing-subexpressionmissing-subexpressionmissing-subexpressionmissing-subexpressionmissing-subexpressionmissing-subexpression\begin{array}[]{l r l l c c}\hline\cr\vskip 3.0pt plus 1.0pt minus 1.0pt\cr\hline\cr\vskip 3.0pt plus 1.0pt minus 1.0pt\cr\mathrm{Sample}&\mathrm{N_{g}}&\phantom{249}\mathrm{<v>}\phantom{249}&\phantom{24}\sigma_{\rm v}\phantom{24}&\mathrm{R_{vir}}&\mathrm{Mass(<R_{vir})}\\ &&\phantom{249}\mathrm{km\ s^{-1}}\phantom{249}&\phantom{2}\mathrm{km\ s^{-1}}\phantom{24}&\mathrm{Mpc}&10^{14}\mathrm{M}_{\odot}\\ \hline\cr\vskip 3.0pt plus 1.0pt minus 1.0pt\cr\mathrm{Whole\ system}&26&46942\pm 140&698_{-159}^{+216}&1.57&6.9^{+4.0}_{-3.0}\\ \mathrm{Whole\ system\ Sample2}&24&46921\pm 120&571_{-73}^{+134}&1.29&3.9^{+2.4}_{-2.2}\\ \mathrm{Virialized\ subsample}&14&46796\pm 165&586_{-148}^{+171}&1.32&4.6^{+2.4}_{-1.6}\\ \vskip 3.0pt plus 1.0pt minus 1.0pt\cr\hline\cr\vskip 3.0pt plus 1.0pt minus 1.0pt\cr\hline\cr\end{array}
Table 7: Properties of galaxy clusters
ClusterNNmNm,virαδzσvMass(<Rvir)J2000kms11014MA6101655722075917.10+270916.10.0984264961.82.3A725513627090109.99+623720.00.0925343.2A796992614092757.55+602633.70.1575716983.96.9missing-subexpressionmissing-subexpressionmissing-subexpressionmissing-subexpressionmissing-subexpressionmissing-subexpressionmissing-subexpressionmissing-subexpressionmissing-subexpressionmissing-subexpressionmissing-subexpressionmissing-subexpressionmissing-subexpressionmissing-subexpressionmissing-subexpressionmissing-subexpressionmissing-subexpressionmissing-subexpressionClusterNsubscriptNmsubscriptNmvir𝛼𝛿𝑧subscript𝜎vannotatedMassabsentsubscriptRvirmissing-subexpressionmissing-subexpressionmissing-subexpressionmissing-subexpressionJ2000missing-subexpressionkmsuperscripts1superscript1014subscriptMdirect-productmissing-subexpressionmissing-subexpressionmissing-subexpressionmissing-subexpressionmissing-subexpressionmissing-subexpressionmissing-subexpressionmissing-subexpressionmissing-subexpressionA6101655722075917.10270916.10.0984264961.82.3A725513627090109.99623720.00.092similar-toabsent534similar-toabsent3.2A796992614092757.55602633.70.1575716983.96.9missing-subexpressionmissing-subexpressionmissing-subexpressionmissing-subexpressionmissing-subexpressionmissing-subexpressionmissing-subexpressionmissing-subexpressionmissing-subexpressionmissing-subexpression\begin{array}[]{l r r r c c c c}\hline\cr\vskip 3.0pt plus 1.0pt minus 1.0pt\cr\hline\cr\vskip 3.0pt plus 1.0pt minus 1.0pt\cr\mathrm{Cluster}&\mathrm{N}&\mathrm{N_{m}}&\mathrm{N_{m,vir}}&\alpha\,\,\,\,\,\,\,\,\,\,\,\,\,\mathrm{\delta}&z&\sigma_{\rm v}\phantom{24}&\mathrm{Mass(<R_{vir})}\\ &&&&\mathrm{J2000}&&\mathrm{km\ s^{-1}}&10^{14}\mathrm{M}_{\odot}\\ \hline\cr\vskip 3.0pt plus 1.0pt minus 1.0pt\cr\mathrm{A610}&165&57&22&075917.10+270916.1&0.098&426\mathrm{-}496&1.8-2.3\\ \mathrm{A725}&51&36&27&090109.99+623720.0&0.092&\sim 534&\sim 3.2\\ \mathrm{A796}&99&26&14&092757.55+602633.7&0.157&571\mathrm{-}698&3.9-6.9\\ \vskip 3.0pt plus 1.0pt minus 1.0pt\cr\hline\cr\vskip 3.0pt plus 1.0pt minus 1.0pt\cr\hline\cr\end{array}

As for A725, it shows some evidence of non–Gaussianity in the velocity distribution, the peculiarity of the BCMI in the velocity space, and an elongated cluster shape in the NE-SW direction. This direction is the same one indicated by the radio relic since it is an arc of diffuse emission to the NE of the radio galaxy associated with the BCMI (Kempner & Sarazin kem01 (2001), see Fig. 11).

A796 possibly hosts a radio halo (to be confirmed) according to WENSS data (Kempner & Sarazin kem01 (2001)). It shows the peculiarity of the BCMI in the velocity space, possible spatial/velocity substructure and the presence of two minor clumps along the SE–NW direction.

For A725 and A796 the number of cluster members (30similar-toabsent30\sim 30) is enough for the estimate of σVsubscript𝜎V\sigma_{\rm V}, but too small for the analysis of substructure. Thus, a definitive conclusion will require more data.

Acknowledgements.
We would like to thank Luigina Feretti for many enlightening discussions and for the VLA radio image of A610 she kindly provided us. We thank the anonymous referee for useful comments and suggestions. This publication is based on observations made on the island of La Palma with the William Herschel Telescope (WHT) and with the Isaac Newton Telescope (INT), operated by the Isaac Newton Group (ING), in the Spanish Observatory of the Roque de Los Muchachos of the Instituto de Astrofisica de Canarias. This research has made use of the NASA/IPAC Extragalactic Database (NED), which is operated by the Jet Propulsion Laboratory, California Institute of Technology, under contract with the National Aeronautics and Space Administration. This research has made use of the galaxy catalog of the Sloan Digital Sky Survey (SDSS). Funding for the SDSS has been provided by the Alfred P. Sloan Foundation, the Participating Institutions, the National Aeronautics and Space Administration, the National Science Foundation, the U.S. Department of Energy, the Japanese Monbukagakusho, and the Max Planck Society. The SDSS Web site is http://www.sdss.org/. The SDSS is managed by the Astrophysical Research Consortium for the Participating Institutions. The Participating Institutions are the American Museum of Natural History, Astrophysical Institute Potsdam, University of Basel, University of Cambridge, Case Western Reserve University, University of Chicago, Drexel University, Fermilab, the Institute for Advanced Study, the Japan Participation Group, Johns Hopkins University, the Joint Institute for Nuclear Astrophysics, the Kavli Institute for Particle Astrophysics and Cosmology, the Korean Scientist Group, the Chinese Academy of Sciences (LAMOST), Los Alamos National Laboratory, the Max-Planck-Institute for Astronomy (MPIA), the Max-Planck-Institute for Astrophysics (MPA), New Mexico State University, Ohio State University, University of Pittsburgh, University of Portsmouth, Princeton University, the United States Naval Observatory, and the University of Washington. This work was partially supported by a grant from the Istituto Nazionale di Astrofisica (INAF, grant PRIN-INAF2006 CRA ref number 1.06.09.06).

References

  • (1) Abell, G. O., Corwin, H. G. Jr., & Olowin, R. P. 1989, ApJS, 70, 1
  • (2) Ashman, K. M., Bird, C. M., & Zepf, S. E. 1994, AJ, 108, 2348
  • (3) Bardelli, S., Zucca, E., Vettolani, G., et al. 1994, MNRAS, 267, 665
  • (4) Barrena, R., Biviano, A., Ramella, M., Falco, E. E., & Seitz, S. 2002, A&A, 386, 816
  • (5) Barrena, R., Boschin, W., Girardi, M., & Spolaor, M. 2007a, A&A, 467, 37
  • (6) Barrena, R., Boschin, W., Girardi, M., & Spolaor, M. 2007b, A&A, 469, 861
  • (7) Beers, T. C., Flynn, K., & Gebhardt, K. 1990, AJ, 100, 32
  • (8) Beers, T. C., Forman, W., Huchra, J. P., Jones, C., & Gebhardt, K. 1991, AJ, 102, 1581
  • (9) Bertin, E., & Arnouts, S. 1996, A&AS, 117, 393
  • (10) Bird, C. M. 1994, ApJ, 422, 480
  • (11) Bird, C. M., & Beers, T. C. 1993, AJ, 105, 1596
  • (12) Böhringer, H., & Schuecker, P. 2002, in “Merging Processes in Galaxy Clusters”, eds. L. Feretti, I. M. Gioia, & G. Giovannini (The Netherlands: Kluwer Ac. Pub.), Observational signatures and statistics of galaxy cluster mergers
  • (13) Böhringer, H., Voges, W., Huchra, J. P., et al. 2002, ApJS, 129, 435
  • (14) Boschin, W., Girardi, M., Barrena, R., et al. 2004, A&A, 416, 839
  • (15) Boschin, W., Girardi, M., Spolaor, M., & Barrena, R. 2006, A&A, 449, 461
  • (16) Buote, D. A. 2001, ApJ, 553, L15
  • (17) Buote, D. A. 2002, in “Merging Processes in Galaxy Clusters”, eds. L. Feretti, I. M. Gioia, & G. Giovannini (The Netherlands: Kluwer Ac. Pub.), Optical Analysis of Cluster Mergers
  • (18) Burns, J. O., Roettiger, K., Ledlow, M., & Klypin, A. 1994, ApJ, 427, L87
  • (19) Burstein, D., & Heiles, C. 1982, AJ, 87, 1165
  • (20) Carlberg, R. G., Yee, H. K. C., & Ellingson, E. 1997, ApJ, 478, 462
  • (21) Cassano, R., Brunetti G., & Setti, G. 2006, MNRAS, 369, 1577
  • (22) Cousins, A. W. J. 1976, MemRAS, 81, 25
  • (23) Danese, L., De Zotti, C., & di Tullio, G. 1980, A&A, 82, 322
  • (24) den Hartog, R., & Katgert, P. 1996, MNRAS, 279, 349
  • (25) Ellingson, E., & Yee, H. K. C. 1994, ApJS, 92, 33
  • (26) Ensslin, T. A., & Brüggen, M. 2002, MNRAS, 331, 1011
  • (27) Fadda, D., Girardi, M., Giuricin, G., Mardirossian, F., & Mezzetti, M. 1996, ApJ, 473, 670
  • (28) Feretti, L. 1999, MPE Report No. 271
  • (29) Feretti, L. 2002, The Universe at Low Radio Frequencies, Proceedings of IAU Symposium 199, held 30 Nov - 4 Dec 1999, Pune, India. Edited by A. Pramesh Rao, G. Swarup, and Gopal-Krishna, 2002., p.133
  • (30) Feretti, L. 2005, X-Ray and Radio Connections (eds. L. O. Sjouwerman and K. K. Dyer) Published electronically by NRAO, http://www.aoc.nrao.edu/events/xraydio Held 3-6 February 2004 in Santa Fe, New Mexico, USA
  • (31) Gebhardt, K., & Beers, T. C. 1991, ApJ, 383, 72
  • (32) Giovannini, G., & Feretti, L. 2000, New Astronomy, 5, 335
  • (33) Giovannini, G., & Feretti, L. 2002, in “Merging Processes in Galaxy Clusters”, eds. L. Feretti, I. M. Gioia, & G. Giovannini, (The Netherlands: Kluwer Ac. Pub.), Diffuse Radio Sources and Cluster Mergers
  • (34) Giovannini, G., Feretti, L., Venturi T., Kim, K.-T., & Kronberg, P. P. 1993, ApJ, 406, 399
  • (35) Giovannini, G., Tordi, M., & Feretti, L. 1999, New Astronomy, 4, 141
  • (36) Girardi, M., & Biviano, A. 2002, in “Merging Processes in Galaxy Clusters”, eds. L. Feretti, I. M. Gioia, & G. Giovannini, (The Netherlands: Kluwer Ac. Pub.), Analysis of Cluster Mergers
  • (37) Girardi, M., Boschin, W., & Barrena, R. 2006, A&A, 455, 45
  • (38) Girardi, M., Fadda, D., Giuricin, G. et al. 1996, ApJ, 457, 61
  • (39) Girardi, M., Giuricin, G., Mardirossian, F., Mezzetti, M., & Boschin, W. 1998, ApJ, 505, 74
  • (40) Girardi, M., & Mezzetti, M. 2001, ApJ, 548, 79
  • (41) Gómez, P. L., Pinkney, J., Burns, J. O., et al. 1997, ApJ, 474, 580
  • (42) Govoni, F., Ensslin, T. A., Feretti, L., & Giovannini, G. 2001a, A&A, 369, 441
  • (43) Govoni, F., Feretti, L., Giovannini, G., et al. 2001b, A&A, 376, 803
  • (44) Goto, T., Sekiguchi, M., Nichol, R. C., et al. 2002, AJ, 123, 1807
  • (45) Gullixson, C. A. 1992, in “Astronomical CCD Observing and Reduction Techniques” (ed. S. B. Howell), ASP Conf. Ser., 23, 130
  • (46) Hanisch, R. J. 1982, A&A, 116, 137
  • (47) Jetha, N. N., Hardcastle, M. J., & Sakelliou, I. 2006, MNRAS, 368, 609
  • (48) Johnson, H. L., & Morgan, W. W. 1953, ApJ, 117, 313
  • (49) Kempner, J. C., & Sarazin, C. L. 2001, ApJ, 548, 639
  • (50) Kennicutt, R. C. 1992, ApJS, 79, 225
  • (51) Kowalski, M. P., Ulmer, M. P., Cruddace, R. G., & Wood, K. S. 1984, ApJS, 56, 403
  • (52) Limber, D. N., & Mathews, W. G. 1960, ApJ, 132, 286
  • (53) López-Cruz, O., Barkhouse, W. A., & Yee, H. K. C. 2004, ApJ, 614, 679
  • (54) Malumuth, E. M., Kriss, G. A., Dixon, W. Van Dyke, Ferguson, H. C., & Ritchie, C. 1992, AJ, 104, 495
  • (55) Maurogordato, S., Cappi, A., Ferrari, C., et al. 2008, A&A, in press
  • (56) Mercurio, A., Girardi, M., Boschin, W., Merluzzi, P., & Busarello, G. 2003, A&A, 397, 431
  • (57) Owen, F. N., Ledlow, M. J., & Keel, W. C. 1995, AJ, 109, 14
  • (58) Owen, F. N., White, R. A., & Burns, J. O. 1992, ApJS, 80, 501
  • (59) Owen, F. N., White, R. A., & Jingping, G. 1993, ApJS, 87, 135
  • (60) Pisani, A. 1993, MNRAS, 265, 706
  • (61) Pisani, A. 1996, MNRAS, 278, 697
  • (62) Poggianti, B. M. 1997, A&AS, 122, 399
  • (63) Press, W. H., Teukolsky, S. A., Vetterling, W. T., & Flannery, B. P. 1992, in Numerical Recipes (Second Edition), (Cambridge University Press)
  • (64) Quintana, H., Carrasco, E. R., & Reisenegger, A. 2000 AJ, 120, 511
  • (65) Roettiger, K., Loken, C., & Burns, J. O. 1997, ApJS, 109, 307
  • (66) Röttgering, H., Snellen, I., Miley, G., et al. 1994, ApJ, 436, 654
  • (67) Sarazin, C. L. 2002, in “Merging Processes in Galaxy Clusters”, eds. L. Feretti, I. M. Gioia, & G. Giovannini (The Netherlands: Kluwer Ac. Pub.), The Physics of Cluster Mergers
  • (68) Schuecker, P., Böhringer, H., Reiprich, T. H., & Feretti, L. 2001, A&A, 378, 408
  • (69) Shapiro, S. S., & Wilk, M. B. 1965, Biometrika, 52, 591
  • (70) Struble, M. F. & Rood, H. J. 1982, AJ, 87, 7
  • (71) Struble, M. F. & Rood, H. J. 1984, AJ, 89, 1487
  • (72) The, L. S., & White, S. D. M. 1986, AJ, 92, 1248
  • (73) Tonry, J., & Davis, M. 1979, AJ, 84, 1511
  • (74) Tribble, P. 1993, MNRAS, 263, 31
  • (75) Valentijn, E. A. 1979, ApJS, 38, 319
  • (76) Wainer, H., & Schacht, S. 1978, Psychometrika, 43, 203