The Formation and Evolution of Massive Stellar Clusters in IC 4662
Abstract
We present a multiwavelength study of the formation of massive stellar clusters, their emergence from cocoons of gas and dust, and their feedback on surrounding matter. Using data that span from radio to optical wavelengths, including Spitzer and Hubble ACS observations, we examine the population of young star clusters in the central starburst region of the irregular Wolf-Rayet galaxy IC 4662. We model the radio-to-IR spectral energy distributions of embedded clusters to determine the properties of their HII regions and dust cocoons (sizes, masses, densities, temperatures), and use near-IR and optical data with mid-IR spectroscopy to constrain the properties of the embedded clusters themselves (mass, age, extinction, excitation, abundance). The two massive star-formation regions in IC 4662 are excited by stellar populations with ages of Ma and masses of M⊙ (assuming a Kroupa IMF). They have high excitation and sub-solar abundances, and they may actually be comprised of several massive clusters rather than the single monolithic massive compact objects known as Super Star Clusters (SSCs). Mid-IR spectra reveal that these clusters have very high extinctions, A mag, and that the dust in IC 4662 is well-mixed with the emitting gas, not in a foreground screen.
1 Introduction
Massive stars in starbursts are thought to form predominantly in Super Star Clusters (SSCs), which are massive, compact, young stellar clusters that are candidates for present-day analogues of young globular clusters because of their similar sizes and inferred masses (e.g. Whitmore et al., 1993; Schweizer et al., 1996). Although the great majority of SSCs could be short-lived, destined to dissolve within megayears (Ma) and merge into the field star population (Fall et al., 2005; Mengel et al., 2005), it is clear that their massive stars dominate feedback in starbursts. They return enriched matter and energy to the interstellar medium (ISM) via stellar winds and supernovae, and their hard radiation fields heat and excite gas and destroy molecules and dust grains. A high surface density of star formation produces galactic-scale superwinds that can expel the ISM from a galaxy (e.g. Heckman et al., 2000).
SSCs are probably formed within giant molecular cloud complexes, so observations that can probe embedded dusty regions are required to detect the youngest SSCs. By the time SSCs have blown away enough of their natal material to be detected at visible wavelengths, they are usually at least several million years old, so their most massive individual stars are expected to have already evolved off of the main sequence. At this stage it is difficult to infer much about SSC formation environments, because the massive stars have significantly altered them. Infrared and radio wavelengths are best suited to studying the youngest SSCs, and radio interferometry has revealed a population of heavily obscured, compact thermal radio sources with inferred nebular densities n cm-3 and radii of a few parsecs that appear to be powered by 100s-1000s of massive stars. These sources were dubbed ultra-dense HIIRs (UDHIIs, Kobulnicky and Johnson, 1999) in analogy with Galactic ultra-compact HIIRs (UCHIIs, e.g. Wood and Churchwell, 1989), which are excited by one or a few massive stars on subparsec scales, with n cm-3.
UDHIIs are thought to be young, embedded SSCs that have not yet disrupted and expelled the majority of their natal and surrounding material. Their hard intrinsic emission is absorbed and reprocessed by surrounding dense gas and dust to emerge as a thermal blackbody component in the mid-IR, where it peaks at m depending on the temperature and distribution of the dust (e.g. Vacca et al., 2002). In the radio regime, UDHIIs are identified by a thermal bremsstrahlung spectrum that is self-absorbed below a few cm (e.g. Johnson et al., 2003). These features dominate the spectral energy distribution (SED) of UDHIIs and can be used along with any escaping visible light emission to constrain the temperature, density, and geometry of the gas and dust excited by the SSC, as well as the age and stellar content of the cluster itself (e.g. Martín-Hernández et al., 2005, 2006). Spectroscopic measurements provide further constraints on these parameters as well as the excitation and composition of the emitting material (e.g. Verma et al., 2003).
2 Spitzer Imaging of Embedded Massive Star-Formation Regions in IC 4662
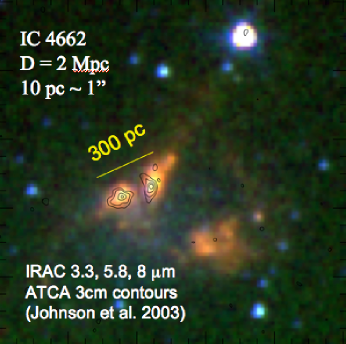
IC 4662 is a nearby (d Mpc, 1 pc), isolated dwarf galaxy that contains two bright Wolf-Rayet (WR) star-forming regions that are extended over pc, and very little molecular gas and dust (Heydari-Malayeri et al., 1990). Radio observations at 2 and 6 cm revealed that compact thermal sources containing up to a few hundred massive stars are associated with the WR star-forming regions, but they are not centered on the brightest optical clusters within them (Johnson et al., 2003). We obtained Spitzer IRAC and MIPS imaging and IRS high-resolution spectroscopy of these regions in order to explore the mid-IR properties of the stars, gas, and dust in these regions. We also obtained Hubble Space Telescope (HST) ACS imaging to study the optical sources in these regions at high resolution, but we focus on Spitzer data in this contribution and treat the starburst regions as unresolved.
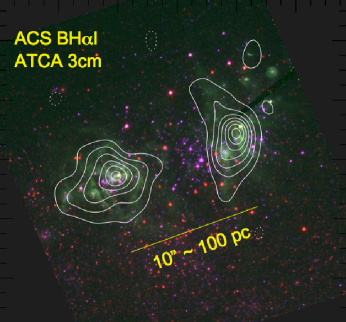
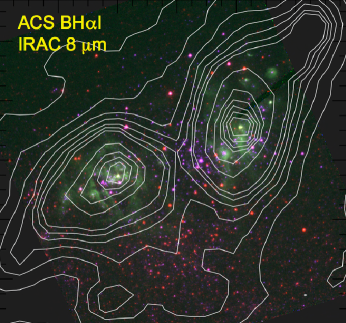
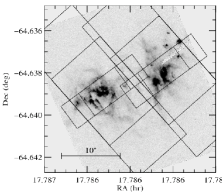
A three-color image of IC 4662, constructed from the IRAC 3.3, 5.8, and 8-m bands, is shown in Figure 1, along with an overlay of the 3 cm radio contours from Johnson et al. (2003). The galaxy has three bright extended regions in the IRAC bands, two of which correspond to the radio and optical regions A1 and A2, and a third (region B, not included in the HST field of view) that is offset to the southwest and fainter in all bands. Figure 2 compares both the radio and IRAC 8 m contours with the optical emission on an ACS three-color image (in filters F435W, F658N, F814W). The radio contours follow the extended H morphology, and the extended 8 m emission, which is a tracer of PAHs or hot dust depending upon metallicity (e.g. Engelbracht et al., 2005; Wu et al., 2006), peaks at the H peaks. Regions A1 and A2 are extended on scales of , but they are complex and may contain sources that are too compact to be resolved by Spitzer’s smallest pixels, which are 1.2” for IRAC.
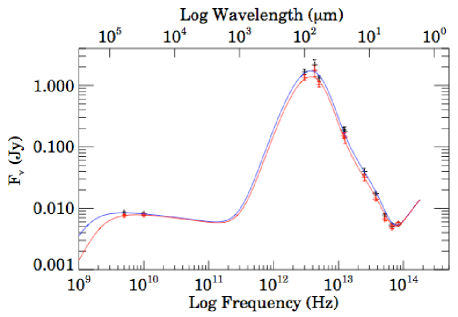
We performed photometry on regions A1 and A2 in the Spitzer pipeline-reduced IRAC and MIPS data. The apertures were matched across all Spitzer bands at a radius of , for which we also recomputed ATCA radio fluxes for consistency. The IR background was subtracted using Spitzer SPOT predictions. In order to incorporate the lower-resolution IRAS measurements (Beichman et al., 1988) into our analysis we scaled the IRAS fluxes so that the 25 m flux matches a power-law fit to the Spitzer 24 and 70 m data interpolated at 25 m. This yields three additional independent estimates of fluxes of A1 and A2 at 12, 60, and 100 m. The resulting SEDs extend from 3 cm to 3 m and feature a radio free-free component longward of about 150 m, a warm dust blackbody peaking at around 100 m, and the onset of stellar photospheric emission appears in the 3 m point (Figure 3).
3 Modeling the SEDs of UDHIIs
In order to interpret the measured SEDs, we begin by considering a simple model111We will consider a more complete and complex model such as DUSTY (Nenkova et al., 2000) in future work, as we conclude in § 4.1 that IC 4662 requires a mixed model for its dust rather than a foreground screen. of a star cluster embedded in an HII region which is embedded in a dust cocoon, following Vacca et al. (2002) and motivated by the UCHII models of e.g. Churchwell et al. (1990). The SED produced by this system is the sum of an optically thick, radio free-free component (assumed to be a constant-density, dust-free HIIR at a temperature of K extending from the center to an inner radius) and an optically thin dust shell component (extending from the inner to an outer radius with a constant density of silicate grains and a power-law temperature profile). We fit the SEDs from 3 cm to 5 m of A1 (A2) to this model and arrive at HIIR parameters: half-light radii of 4 (2.4) pc, n cm-3, and gas masses of about M⊙. The dust shells have temperatures at the inner radius of K and masses of about M⊙. The low model gas and dust masses relative to other UDHIIs like those in He (Vacca et al., 2002) suggest that the exciting clusters A1 and A2 are more evolved, and have destroyed or ejected more of their surrounding matter in the process of emerging from their cocoons.
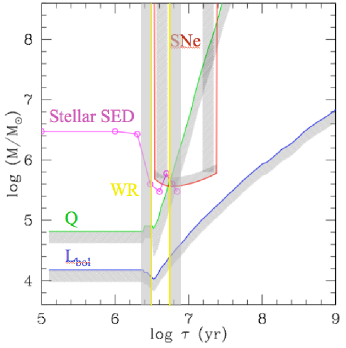
Figure 3 shows that the HIIR+dust cocoon model fits the data points well, with the exception of the near-IR filters that are dominated by stellar continuum emission and may contain PAH emission at 3.3m. The radio data provide several constraints on the age and mass of the ionizing stellar clusters within regions A1 and A2 that are illustrated in Figure 4. From the radio continuum fluxes we derive a Lyman continuum photon rate Q s-1, which requires at least a certain mass in massive stars and hence an overall cluster mass for a full initial mass function as a function of cluster age (we adopt a Kroupa IMF, Kroupa, 2001). Clusters in the M space above the green line in Figure 4 have enough massive stars to explain the observed Q values even if the radio fluxes are underestimates due to self-absorption. The blue line shows a weaker constraint following the same argument for the bolometric luminosity Lbol of the exciting cluster. The lack of non-thermal emission at 3 cm implies no observable supernova (SN) activity, which excludes the region in M that is inside the red box. The detection of He ii 468.6 nm line emission (Heydari-Malayeri et al., 1990) further restricts the permitted age range for the exciting sources to lie between 3 and 5 Ma, as shown by the yellow lines. Finally, a fit to the 3.3 and 4.5 m points in the SEDs of Bruzual and Charlot (2003) models for a range of cluster ages and masses yields and M values that fall on the magenta points, so the allowed cluster parameters are very tightly constrained at Ma and M M⊙. Thus we have added a stellar component to our SED model from the appropriate Bruzual and Charlot (2003) model in Figure 4.
4 Extinction, Excitation, and Abundances from Spitzer IRS Spectroscopy
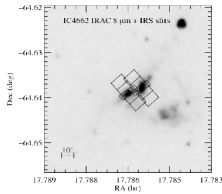
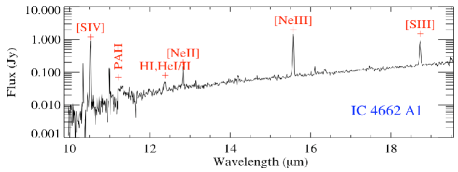
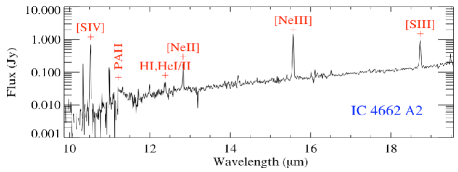
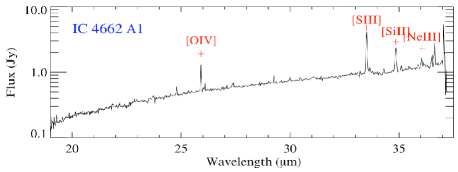
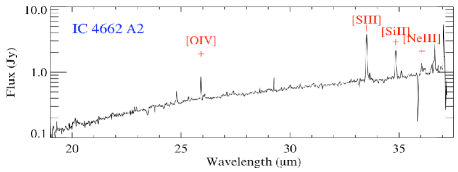
We observed IC 4662 regions A1 and A2 with Spitzer IRS in both high-resolution ( km s-1) settings: short-high (SH) covers about m with a slit, and long-high (LH) covers m with an slit. Both slits are shown in both nod positions for each object in Figure 5 on the continuum-subtracted H and m images. The spectra were reduced and extracted from the full apertures using SPICE, and background-subtracted using the SPOT background calculator. Figures 6 and 7 show the SH and LH spectra, which feature a warm dust continuum, many high-excitation fine-structure lines, a weak PAH feature at m but no discernible silicate absorption, and broad H i Humphreys (Hu) emission at m. Fine-structure lines in the IRS spectra make possible the determination of many properties of the gas, dust, and stars within the emitting regions.
4.1 Extinction and Electron Density
We can estimate the extinction by comparing theoretical ratios of fine-structure lines that are well-separated in with the observed values. In this case we used [Ne iii] 15.6/36 m, which does not vary substantially over a wide range of expected electron temperatures and densities (Te, ne). We thus assume T K and n cm-3 and use the mid-IR extinction law for the Small Magellanic Cloud of Weingartner and Draine (2001) to derive for A1 (A2) an extinction A mag for a foreground dust screen or A mag for dust mixed with the emitting gas. For either dust geometry, correcting the observed [S iii] 18.7/33.5 m ratio for this extinction leads to n cm-3 for A1 (A2), so our initial assumption of a low ne gives a consistent result, whereas a higher assumption gives an inconsistent one222By comparing ratios for [Ne iii] and [S iii] we are assuming they are co-located, although their ionization potentials do differ significantly.. Our fit to the SED (§ 3) yields a higher n cm-3, which might be due to aperture differences between SH and LH slits: the larger area viewed by the LH slit could produce larger fluxes for the LH lines and hence drive down the measured ratio and derived ne. We also note that Hunter et al. (2001) reported a high gas density in warm photo-dissociation regions of n cm-3 from ISO data. These differing density tracers probe different gas phases that may not share the same emitting volume. Here we adopt a low value of n cm-3 in order to obtain a lower limit on the extinction.
These values for AV greatly exceed those that were determined based on optical spectroscopy by Heydari-Malayeri et al. (1990), who reported A mag from Balmer decrement measurements, or even Stasińska et al. (1986), who reported a much higher optical extinction equivalent to A mag. Both groups used apertures of FWHM, which is comparable with the spatial extent of the SH aperture, which encompasses the bulk of the mid-IR and H emission from A1 and A2 (Figure 5), so comparison of our data sets is warranted. Only a mixed dust model can reconcile the low optical AV values with the high mid-IR ones. If the extinction were as low as that inferred from visible wavelengths, the mid-IR line ratios would have the theoretical values. If the dust were in a foreground screen, the high IR extinction would obscure most of the optical recombination line emission; however, we detect only about three times the optically-derived Lyman continuum flux from mid-IR and radio data, so a screen geometry is ruled out. In other Spitzer observations of nearby and hence well-resolved massive star-formation regions, dust has been observed to be mixed with the stars and gas (e.g. RCW 49, Churchwell et al., 2004).
4.2 Excitation and Massive Star Census
Several of the mid-IR fine-structure line ratios that we can measure from the IRS spectra are useful excitation indicators for star-forming regions. For example, starbursts and HIIRs form a diagonal band in a plot of [S iv] 10.5/[S iii] 18.7 m versus [Ne iii] 15.5/[Ne ii] 12.8 m, where higher-excitation objects have higher values of both ratios (e.g. Wu et al., 2006). With [S iv] 10.5/[S iii] 18.7 m ratios and [Ne iii] 15.5/[Ne ii] 12.8 m ratios , IC 4662 A1 and A2 both fall in the upper right corner of such a diagram, along with other metal-poor WR systems like NGC 5253 and II Zw 40 (e.g. Verma et al., 2003). Heydari-Malayeri et al. (1990) also report a very high excitation for IC 4662 based on its [Ne iii] 386.9 nm/H ratio, and Mas-Hesse and Kunth (1999) report a high effective temperature T K from its UV spectrum.
High excitation is caused by the hard radiation field of the most massive stars that are present in SSCs, and we have several handles on the massive star content of IC 4662’s star-forming regions from our data. Assuming that the radio continuum flux is due to free-free radiation from HIIRs as above, we find Q s-1 for A1 (A2), and from the Hu flux we find Q s-1, in reasonable agreement. From these Lyman continuum luminosities we infer that the number of hot stars needed to power the HIIRs is O7V stars. From e.g. Heydari-Malayeri et al. (1990) it is known that these regions contain WR stars, so using the models of Schaerer and Vacca (1998) and Starburst99 (Leitherer et al., 1999) we estimate that WRs should be present. This number agrees with that of Heydari-Malayeri et al. (1990) after correcting for the mid-IR-derived extinction.
4.3 Abundances
We calculated neon and sulfur abundances for regions A1 and A2 from the observed fluxes of fine-structure lines relative to that in Hu at 12.37 m, following a procedure similar to that used by Wu et al. (2007), whose IRS abundance study of blue compact dwarf galaxies (BCDs) is useful to compare with ours. We measured sulfur in two excited states at [S iii] 18.71 m and [S iv] 10.51 m, which we expect to comprise most of the sulfur at such high excitation. Following Wu et al. (2007) we assumed that only 10 % of the total S is in [S ii], since the typical ionic abundance of [S ii] in BCDs is % of that of [S iii] (Izotov et al., 1994, 1997). For neon we used the fluxes of [Ne ii] 12.81 m and [Ne iii] m and made no correction for unseen ionization states. All of these lines were observed with the same slit (SH) as Hu so that no aperture corrections are needed, as would be needed if we used the LH detections of [S iii] 33.48 m and [Ne iii] 36 m.
The observed fluxes were corrected for extinction using the mixed model results discussed in § 4.2, and the resulting abundances for A1 (A2) are: Ne/H = () and S/H = (). In order to compare directly with the BCDs of Wu et al. (2007), we adopt their choices for solar abundances of (Ne/H) (Feldman and Widing, 2003) and (S/H) (Asplund et al., 2005). Thus in solar units we have (Ne/H) (Ne/H)⊙ and (S/H) (S/H)⊙. Heydari-Malayeri et al. (1990) report a mean Ne/H abundance of , which is consistent with our lower limits but nearly a factor of two larger. We note that the Hu is significantly broader than the other nebular lines in the IRS spectra. We investigated whether this broadening could be the direct signature of WR stars via their He i/ii 12.36 m emission (Smith and Houck, 2001). However, the number of WR stars needed to explain the putative excess Hu flux is far larger than the number of O stars expected to be present. Therefore the cause of the broad Hu line remains uncertain.
The relatively weak PAH feature at 11.3 m is consistent with the trends found by Wu et al. (2006) for a sample of BCDs that have high excitation and low abundance like IC 4662 regions A1 and A2.
5 Conclusions
The nearby dwarf irregular galaxy IC 4662 harbors two sites of recent massive star formation that have thermal radio spectra, bright dust and H emission, and rich mid-IR spectra that feature nebular fine-structure lines, a hint of PAHs at 11.3 m, and broad Hu emission. Our emission-line analysis indicates that this starburst has high excitation and low abundances like many UCD galaxies and in agreement with literature values. However, we find much higher extinctions (A mag) than previous shorter-wavelength studies, which can only be reconciled with the optical observations by a mixed geometry for the gas and dust in these regions. SED fitting of the radio-to-near-IR SEDs of the UDHIIs in regions A1 and A2 suggests that they are more evolved toward the SSC stage than similar embedded objects (e.g. in He and NGC 5253): A1 and A2 have lower gas masses in their HIIRs and dust masses surrounding them, and this is consistent with their older ages of about 4 Ma, inferred from radio and optical/near-IR data. The clusters that power the UDHIIs have masses of about M⊙ (assuming a full Kroupa IMF), but they may not be massive, compact, monolithic SSCs like those found in many starbursts, but rather clusters of M⊙ clusters that fill a larger volume of pc diameter.
Acknowledgements This work was performed in part under the auspices of the U.S. Department of Energy, National Nuclear Security Administration by the University of California, Lawrence Livermore National Laboratory under contract No. W-7405-Eng-48, and it was also supported by The Aerospace Corporation’s Independent Research and Development Program.
References
- Asplund et al. (2005) Asplund, M., Grevesse, N., Sauval, A.J.: In: Barnes, T.G.III, Bash, F.N. (eds.) Cosmic Abundances as Records of Stellar Evolution and Nucleosynthesis. Astronomical Society of the Pacific Conference Series, vol. 336, 25 (2005)
- Beichman et al. (1988) Beichman, C.A., Neugebauer, G., Habing, H.J., Clegg, P.E., Chester, T.J. (eds.): Infrared astronomical satellite (IRAS) catalogs and atlases. Volume 1: Explanatory supplement. vol. 1. (1988)
- Bruzual and Charlot (2003) Bruzual, G., Charlot, S.: Mon. Not. R. Astron. Soc. 344, 1000 (2003)
- Churchwell et al. (2004) Churchwell, E., Whitney, B.A., Babler, B.L., Indebetouw, R., Meade, M.R., Watson, C., Wolff, M.J., Wolfire, M.G., Bania, T.M., Benjamin, R.A., Clemens, D.P., Cohen, M., Devine, K.E., Dickey, J.M., Heitsch, F., Jackson, J.M., Kobulnicky, H.A., Marston, A.P., Mathis, J.S., Mercer, E.P., Stauffer, J.R., Stolovy, S.R.: Astrophys. J. Suppl. Ser. 154, 322 (2004)
- Churchwell et al. (1990) Churchwell, E., Wolfire, M.G., Wood, D.O.S.: Astrophys. J. 354, 247 (1990)
- Engelbracht et al. (2005) Engelbracht, C.W., Gordon, K.D., Rieke, G.H., Werner, M.W., Dale, D.A., Latter, W.B.: Astrophys. J. Lett. 628, L29 (2005)
- Fall et al. (2005) Fall, S.M., Chandar, R., Whitmore, B.C.: Astrophys. J. Lett. 631, L133 (2005)
- Feldman and Widing (2003) Feldman, U., Widing, K.G.: Space Science Reviews 107, 665 (2003)
- Heckman et al. (2000) Heckman, T.M., Lehnert, M.D., Strickland, D.K., Armus, L.: Astrophys. J. Suppl. Ser. 129, 493 (2000)
- Heydari-Malayeri et al. (1990) Heydari-Malayeri, M., Melnick, J., Martin, J.M.: Astron. Astrophys. 234, 99 (1990)
- Hunter et al. (2001) Hunter, D.A., Kaufman, M., Hollenbach, D.J., Rubin, R.H., Malhotra, S., Dale, D.A., Brauher, J.R., Silbermann, N.A., Helou, G., Contursi, A., Lord, S.D.: Astrophys. J. 553, 121 (2001)
- Izotov et al. (1994) Izotov, Y.I., Thuan, T.X., Lipovetsky, V.A.: Astrophys. J. 435, 647 (1994)
- Izotov et al. (1997) Izotov, Y.I., Thuan, T.X., Lipovetsky, V.A.: Astrophys. J. Suppl. Ser. 108, 1 (1997)
- Johnson et al. (2003) Johnson, K.E., Indebetouw, R., Pisano, D.J.: Astron. J. 126, 101 (2003)
- Kobulnicky and Johnson (1999) Kobulnicky, H.A., Johnson, K.E.: Astrophys. J. 527, 154 (1999)
- Kroupa (2001) Kroupa, P.: Mon. Not. R. Astron. Soc. 322, 231 (2001)
- Leitherer et al. (1999) Leitherer, C., Schaerer, D., Goldader, J.D., Delgado, R.M.G., Robert, C., Kune, D.F., de Mello, D.F., Devost, D., Heckman, T.M.: Astrophys. J. Suppl. Ser. 123, 3 (1999)
- Martín-Hernández et al. (2006) Martín-Hernández, N.L., Schaerer, D., Peeters, E., Tielens, A.G.G.M., Sauvage, M.: Astron. Astrophys. 455, 853 (2006)
- Martín-Hernández et al. (2005) Martín-Hernández, N.L., Schaerer, D., Sauvage, M.: Astron. Astrophys. 429, 449 (2005)
- Mas-Hesse and Kunth (1999) Mas-Hesse, J.M., Kunth, D.: Astron. Astrophys. 349, 765 (1999)
- Mengel et al. (2005) Mengel, S., Lehnert, M.D., Thatte, N., Genzel, R.: Astron. Astrophys. 443, 41 (2005)
- Nenkova et al. (2000) Nenkova, M., Ivezić, Ž., Elitzur, M.: Thermal Emission Spectroscopy and Analysis of Dust, Disks, and Regoliths 196, 77 (2000)
- Schaerer and Vacca (1998) Schaerer, D., Vacca, W.D.: Astrophys. J. 497, 618 (1998)
- Schweizer et al. (1996) Schweizer, F., Miller, B.W., Whitmore, B.C., Fall, S.M.: Astron. J. 112, 1839 (1996)
- Smith and Houck (2001) Smith, J.D.T., Houck, J.R.: Astron. J. 121, 2115 (2001)
- Stasińska et al. (1986) Stasińska, G., Comte, G., Vigroux, L.: Astron. Astrophys. 154, 352 (1986)
- Vacca et al. (2002) Vacca, W.D., Johnson, K.E., Conti, P.S.: Astron. J. 123, 772 (2002)
- Verma et al. (2003) Verma, A., Lutz, D., Sturm, E., Sternberg, A., Genzel, R., Vacca, W.: Astron. Astrophys. 403, 829 (2003)
- Weingartner and Draine (2001) Weingartner, J.C., Draine, B.T.: Astrophys. J. 548, 296 (2001)
- Whitmore et al. (1993) Whitmore, B.C., Schweizer, F., Leitherer, C., Borne, K., Robert, C.: Astron. J. 106, 1354 (1993)
- Wood and Churchwell (1989) Wood, D.O.S., Churchwell, E.: Astrophys. J. Suppl. Ser. 69, 831 (1989)
- Wu et al. (2007) Wu, Y., Bernard-Salas, J., Charmandaris, V., Lebouteiller, V., Hao, L., Brandl, B.R., Houck, J.R.: ArXiv e-prints 710 (2007)
- Wu et al. (2006) Wu, Y., Charmandaris, V., Hao, L., Brandl, B.R., Bernard-Salas, J., Spoon, H.W.W., Houck, J.R.: Astrophys. J. 639, 157 (2006)