Phases and properties of quark matter
Abstract
I review recent developments in finite temperature lattice QCD which are useful for the study of heavy-ion collisions. I pay particular attention to studies of the equation of state and the light they throw on conformal symmetry and the large limit, and to the structure of the phase diagram for .
1 Introduction
Lattice gauge theory at finite temperature and density has been an extremely active field in the last year. This makes it hard to review it in its entirety within the scope of this article. I have therefore chosen to review two of the major points of contact with heavy-ion physics, namely the equation of state and the phase diagram, in the later sections. In this section I provide pointers to the literature on the many developments I will not discuss further.
-
•
The finite-temperature phase transition is now definitely established to be a cross over: this is verified by the Budapest-Wuppertal (BW) group [1, 2], and confirmed by the BBRC collaboration [3, 4]. Further confirmation has come from the Hot-QCD collaboration. The cross over temperature is temporarily in dispute. The Budapest-Wuppertal group [2] finds a cross-over temperature substantially smaller than that obtained by BBRC [4] using the same thermometer. An old global analysis in 2001 [5] gave MeV with 20 MeV uncertainty from scale setting. BBCR and Hot-QCD prefer the upper end, BW prefer the lower end. This disagreement, while serious, therefore does not impact the experimental search.
-
•
Correlation function measurements have led to new developments. Deconfinement occurs at the chiral cross over point: this has been shown using linkages between quantum numbers; for example, the linkage between baryon number and strangeness becomes exactly that expected from quarks at [6]. There is steady and slow advance in the measurement of transport coefficients on the lattice [7]. Renormalized Polyakov loop measurements in various representations give strong evidence for Casimir scaling to all orders [8]. The octet loop, in particular, does not see the phase transition. The non-melting of and the melting of soon above is now verified in many different computations [9].
-
•
There has been significant advance in defining chiral fermions at finite chemical potential [10]. There are advances in the understanding of isospin chemical potential and imaginary chemical potential [11]. There are new results for thermodynamics using Wilson quarks [12]. Localization of staggered Dirac eigenvectors is seen to set in abruptly at , although this could be a finite volume artifact [13].
2 The equation of state
The equation of state is rather well-known for QCD without quarks. Recently there have been three separate efforts to extract it for , i.e., two light degenerate flavours (corresponding to and quarks) and one heavier flavour. The BW collaboration uses staggered quarks and sets the renormalized quark masses to their physical values by tuning to realistic values of and . The BBRC collaboration uses P4 quarks with light quark masses heavier than physical but a physical strange quark masses by tuning to a heavier pion ( MeV) and a realistic . The HotQCD collaboration is investigating the equation of state with both P4 and Asqtad quarks at renormalized quark masses equal to that used by the BBRC collaboration.
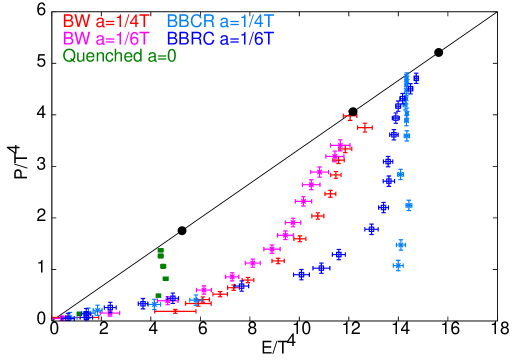
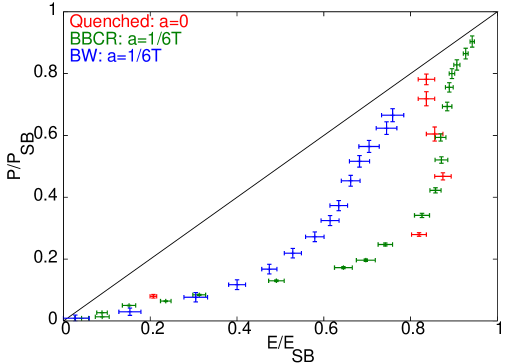
The equation of state of state in the form is an important input into hydrodynamics, and therefore very important for predictions of various signals in heavy-ion collisions. In conformal field theories, including free field theory, one necessarily has , so that . This limit has excited interest recently, since many toy models for QCD can be solved using AdS/CFT techniques which demand conformal symmetry along with the large approximation.
The lattice data is displayed in the two composite plots in Figure 1. The diagonal line denotes conformal equations of state: points corresponding to the ideal gases for , 2 and 3 are marked on this line. Note that the data on the quenched theory is extrapolated to the continuum limit, whereas those for are for a finite lattice cutoff and . There is apparent disagreement between the computations with staggered and P4 quarks: they are not expected to agree at finite lattice spacing, only in the continuum limit must they give the same result. In this connection note that the results of the HotQCD collaboration at smoothens the behaviour of the P4 quarks, reducing the maximum excursion from the conformal line by about 20%, while leaving data at and higher almost unchanged. In summary, there is clear evidence for strong violation of conformal symmetry in the region of the crossover from hadron to quark phases.
Importantly, the deviations are not restricted to a narrow region around , but extend to or slightly higher. This will have two consequences in applications to heavy-ion collisions—
-
1.
Hydrodynamics of non-ideal fluids with conformal equations of state () allow only for shear viscosity. If conformal symmetry is broken, the fluid can have bulk viscosity as well. Closely related to this is the fact that .
-
2.
Unless initial temperatures rise well above , heavy-ion collisions may never be, a priori, approximated as systems with vanishing bulk viscosity.
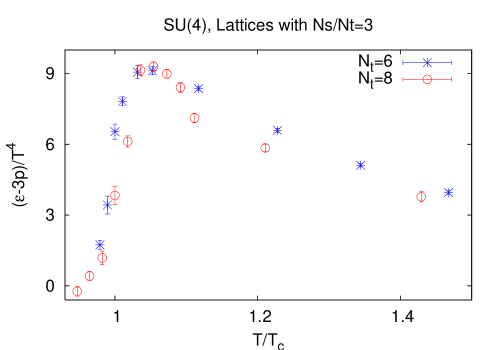
A recent study of SU() pure gauge theories shows that this behaviour persists for [16]. The breaking of conformal symmetry is often exhibited as a plot of against (see Figure 2). For SU(3) gauge theory with or without quarks, peaks in this quantity are seen close to . For pure gauge theories, there is a first order phase transition, and the maximum value of is at least as large as the latent heat density, and hence expected to scale at . Since the Stephan-Boltzmann values of and also scale as , the breaking of conformal symmetry for SU() pure gauge theories is also expected to persist to large .
In heavy-ion collisions a very important use of the equation of state is the estimate of typical energy densities in the plasma phase and in the hadronic phase of QCD. For reference I quote some estimates for the energy density from current lattice computations just below the lowest estimate of the crossover temperature, and just above the highest estimate. We can take as fiducial values which is definitely in the hadron phase and which is definitely in the plasma phase. The current estimates are
| (1) |
In the high temperature phase we have,
| (2) |
While noting the statistically significant differences between the results of the two computations, note also that the renormalized quark masses differ, and that both estimates are made at finite lattice spacing with quark formulations which differ at finite cutoff. For comparison, note that in the continuum limit of quenched QCD one finds Gev/fm3 [14].
The success of a hydrodynamic description of heavy-ion collisions would eventually be gauged from its ability to reliably extract (and other material properties such as transport coefficients) from data, thus permitting experimental tests of lattice predictions. Any claims of disagreement between such extractions and lattice predictions are actually claims of the failure of QCD, and therefore should be treated with the strong, fair and rational skepticism that any claim of a failure of a well-established theory should receive. At this point of time it is easier to control lattice studies: one merely has to spend computer time in decreasing the lattice spacing, a procedure that is already under way. Control of the hydrodynamic description is more problematic, with initial conditions, the hydrodynamic equations, and the hadronization prescription each still in need of independent validation.
3 The global phase diagram
Phase diagrams are labeled by the thermodynamic intensive coordinates. For QCD these are , quark masses and chemical potentials. Of these, experiments can tune (at best) of these, since the quark masses are fixed conditions that we are faced with in reality. In practice, heavy-ion collisions have only a single control parameter— . This is not sufficient to examine the 4 dimensional phase diagram of QCD: only enough to explore a single line through the phase diagram. By varying the ions one can smear this line a bit, but this still leaves scope for much thought and experimental ingenuity in exploring larger parts of the phase diagram in the laboratory.
Each point in phase diagram is, almost always, a single pure phase. Exceptions are where two or more phases coexist; these are also called first order transitions. A continuity argument for lines (surfaces) of first order transition is called the Gibbs’ phase rule. It follows from the structure of the solutions of the equation , where are the free energy density in the two phases and . The Gibbs’ phase rule implies that in D dimensional phase diagram one has D-2 dimensional critical surfaces, D-3 dimensional tricritical surfaces, D-4 dimensional tetracritical surfaces etc.. This argument, and equivalent forms of it, strongly constrains the topology of phase diagrams [20].
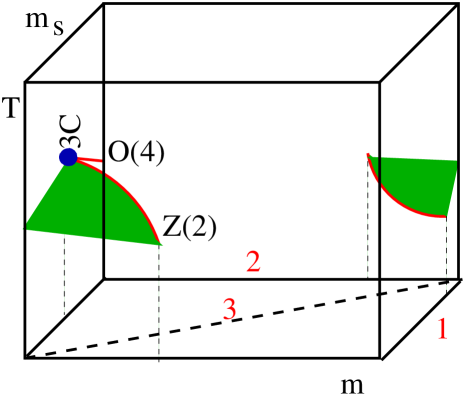
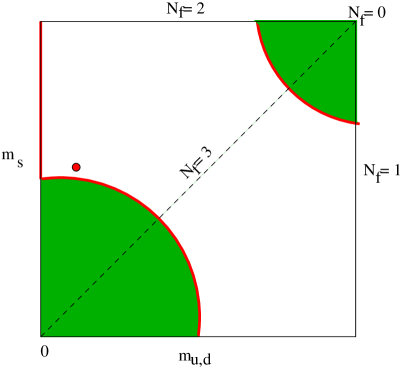
When discussing high dimensional phase diagrams, one often discusses sections, i.e., parts of the phase diagram with some of the intensive variables set equal to fixed values. These are also phase diagrams, in the sense that each point corresponds to an unique thermodynamic phase. However, in QCD it has become the practice to use projections, which we call flag diagrams. A construction of a flag diagram is shown in Figure 3. Each point in a flag diagram shows the kind of phase transition that one obtains by varying the quantity which has been projected away.
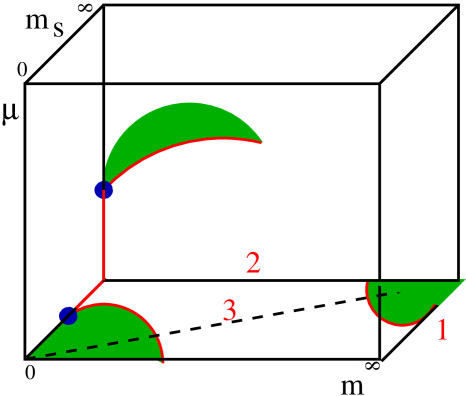


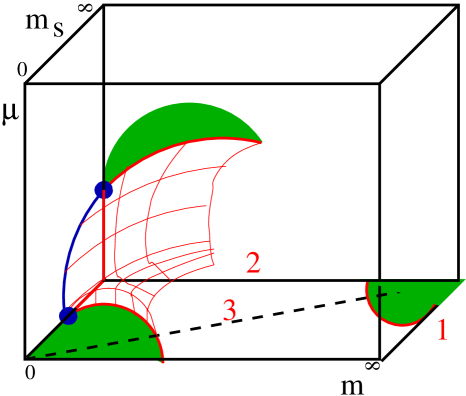
The QCD flag diagram can be extended to include finite baryon chemical potential . Note that we are discussing a 3-d flag diagram obtained from the 4-d section of the full phase diagram with , and the two chemical potentials, . In this flag diagram the planes of and have been explored, and the topology of the phase diagrams are reasonably well understood. In each of these planes there is a tricritical point at which an Ising critical line joins on to an O(4) critical line. One of these tricritical points is shown in Figure 3. Now, the two O(4) critical lines are just the boundary of a single O(4) critical surface. Since these two end in a tricritical point, there must be a tricritical line bounding the O(4) critical surface, of which these two points are the ends (see Figure 4).
Along this tricritical line one must glue together an O(4) critical surface and one or more Ising critical surfaces. Now, [17] found that a part of the Ising critical surface near the region bends in the direction of smaller . With this evidence they claimed that the tricritical line must occur in two pieces, and the two known Ising critical lines must belong to two different Ising critical surfaces. This argument, while compelling, is not water-tight. The reason is that there is no physical principle that constrains the curvature of critical (and tricritical) surfaces: they are allowed to bend, twist and wander. Hence the “wrong” curvature seen in [17] can be accommodated into the flag diagram shown in Figure 4. One must enumerate all topologies that the tricritical line may have.
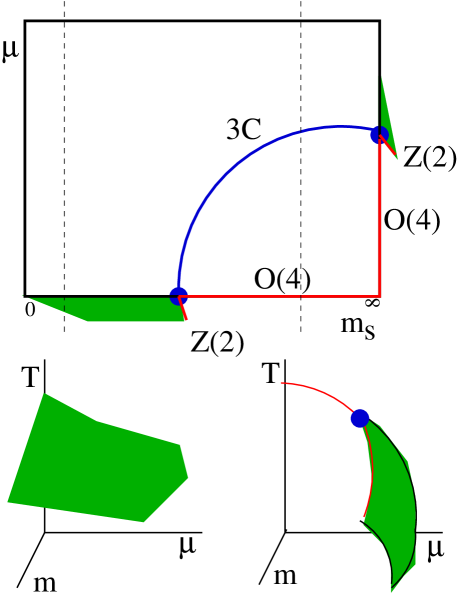
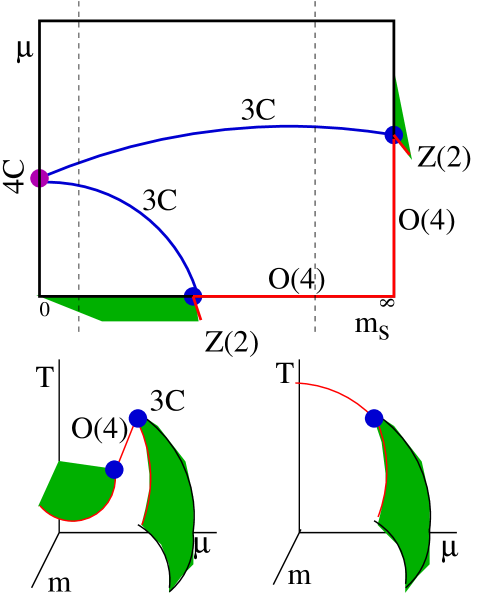
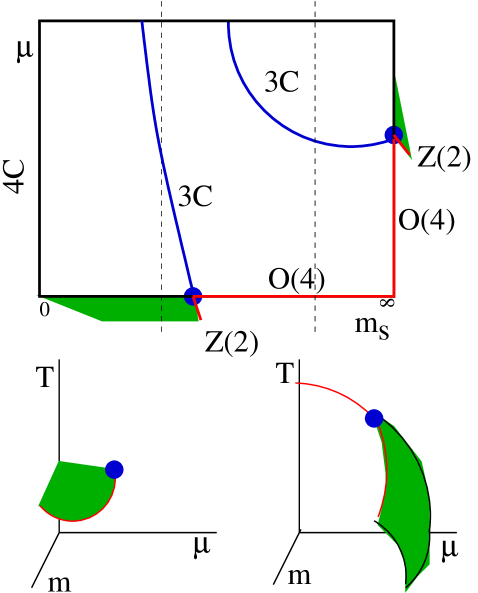
Apart from the simple topology shown in the last panel of Figure 4, there are several more possibilities. In a 4-d phase diagram one non only has the possibility of a tricritical line, but also a tetracritical point where two such tricritical lines meet. If indeed the two Ising critical surfaces are physically distinct, then the possibility of a tetracritical point must be considered. Usually, one would discover a higher-order critical behaviour at a point of enhanced symmetry. Such points are along the 3 flavour line . However, this is ruled out, since universality arguments rule out critical behaviour for SU(3) flavour. The remaining possibility is to draw the tetracritical point out to infinity. These three distinct possibilities for the topology of the tricritical line] are shown in Figure 5, along with the three dimensional physical phase diagrams that they would give rise to at generic quark masses. Note that the second case is ruled out by universality. Which of these cases is true for QCD is something that has to be decided by further lattice simulations.
4 Summary
Significant progress has been made in lattice computations in the last year. The new state of the art is –220 MeV. For the first time all collaborations are using . Conformal symmetry is strongly broken for , as shown directly by the equation of state. There is direct evidence from the lattice that conformal symmetry breaking persists for larger number of colours, and hence, through power counting arguments, to all . One major consequence of this observation is that hydrodynamic studies should include bulk viscous terms. I have argued that a QCD critical point could exist at small chemical potentials even in the theory, and that it is still possible that computations are a good guide to its location. Further lattice computations are called for.
References
- [1] Aoki Y et al., Nature, 443 (2006) 675.
- [2] Aoki Y et al., J. H. E. P.,0601 (2006) 089.
- [3] Cheng M et al., Phys. Rev.,D 74 (2006) 054507.
- [4] Cheng M et al., Phys. Rev.,D 77 (2008) 014511.
- [5] Gupta S, Phys. Rev.,D 64 (2001) 034507.
- [6] Gavai R V and Gupta S, Phys. Rev.,D 73 (2006) 014004.
- [7] Aarts G et al., Phys. Rev. Lett,99 (2007) 022002; Meyer H B, arXiv:0710.3717.
- [8] Gupta S, Hubner K and Kaczmarek O, Phys. Rev.,D 77 (2008) 034503.
- [9] Döring M et al., Phys. Rev.,D 75 (2007) 054504; Aarts G et al., Phys. Rev.,D 76 (2007) 094513; Umeda T arXiv:0710.0204.
- [10] Gattringer C et al., Phys. Rev.,D 76 (2007) 054502; Banerjee D, Gavai R V and Sharma S, arXiv:0803.3295.
- [11] Splittorff K and Svetitsky B, Phys. Rev.,D 75 (2007) 114504; Conradi S and d’Elia M, Phys. Rev.,D 76 (2007) 074501; Kogut J B and Sinclair D K, arXiv:0712.2625; Cea P et al., Phys. Rev.,D 77 (2008) 051501.
- [12] Maezawa Y et al., J. Phys.,, G 34 (2007) S651; Chen H S and Luo X Q, hep-lat/0702025; Creutz M, Phys. Rev.,D 76 (2007) 054501.
- [13] Gavai R V , Gupta S and Lacaze R, arXiv:0803.0182.
- [14] Gavai R V, Gupta S and Mukherjee S, hep-lat/0506015.
- [15] Detar C et al., arXiv:0710.1655.
- [16] Datta S and Gupta S, in progress.
- [17] de Forcrand P and Philipsen O, J. H. E. P.,, 0701 (2007) 077.
- [18] Brown F R et al., Phys. Rev. Lett,65 (1990) 2491; Karsch F, Laermann E and Schmidt C, Phys. Lett.,B 520 (2001) 41.
- [19] Pisarski R D and Wilczek F, Phys. Rev.,D 29 (1984) 338.
- [20] Gupta S, arXiv:0712.0434.