Radio and Infrared Selected Optically Invisible Sources In The Boötes NDWFS
Abstract
We have combined data from the NOAO Deep Wide-Field Survey in Boötes and the Spitzer Space Telescope to determine basic properties for sixteen optically “invisible” MIPS 24 m (OIMS) and thirty-five optically “invisible” radio (OIRS) sources, including their spectral energy distributions (SED) and luminosities. Most OIMSs possess steep power-law SEDs over , indicating the presence of obscured AGN in agreement with Spitzer spectroscopy. These objects are extremely luminous at rest-frame near and mid-IR ( W), consistent with accretion near the Eddington limit and further implying that they host buried QSOs. The majority of the IRAC detected OIRSs have flat 3.6 to 24 m SEDs, implying comparable emission from stellar photospheres and hot AGN illuminated dust. This may reflect relatively small amounts of dust close to the central engine or current low mass accretion rates. A small subset of OIRSs appear to be starburst dominated with photometric redshifts from 1.0 to 4.5. The OIMSs and OIRSs with significant starburst components have similar LK and stellar masses ( M⊙) assuming minimal AGN contribution. Roughly half of the OIRSs are not detected by Spitzer’s IRAC or MIPS. These are most likely radio galaxies. The IRAC detected OIRSs are more likely than OIMSs to appear non point-like in the 3.6 and 4.5 m images, suggesting that interactions play a role in triggering their activity. The AGN powered OIMSs may represent sub-millimeter galaxies making the transition from starburst to accretion dominance in their evolution to current epoch massive ellipticals.
Subject headings:
galaxies: high-redshift – galaxies: starburst – galaxies: active – infrared: galaxies – radio continuum: galaxies1. Introduction
Sensitive multi-band surveys in the optical and near-infrared portion of the electromagnetic spectrum have proven extremely successful in identifying large and diverse galaxy populations in the high-redshift universe. Deep images obtained through optical UnGR filters, for example, readily find galaxies by the presence of a strong 912 Å Lyman break (e.g., Steidel et al. 1996). Lyman Break Galaxies (LBGs) tend to be massive galaxies with star formation rates (SFR) between M⊙ yr-1 and relatively low dust obscuration. Similarly, unobscured star forming disk (S-BzK galaxies) and passively evolving spheroidal galaxies at can be discerned from the myriad background sources by their optical/near-infrared colors or other magnitude-color criteria (see, e.g., Daddi et al. 2004; Adelberger et al. 2004). The S-BzK galaxies in particular tend to possess large stellar masses ( M⊙) with SFR M⊙ yr-1. Nevertheless, it had been long suspected that a substantial fraction of luminous galaxies powered by star formation or accretion onto super-massive black holes would not be identified using these and related techniques because of heavy dust obscuration, but would turn up instead at infrared, sub-millimeter, and radio wavelengths (see, e.g., Chary & Elbaz 2001 and references within). Indeed, deep but small-area surveys at sub-millimeter wavelengths by SCUBA (e.g., Smail et al. 1997) revealed a population of extremely dusty galaxies at , whose high luminosities are generally though to originate primarily in star formation (SFR M⊙ yr-1), though a small fraction may be AGN dominated. Galaxies powered by starbursts or active nuclei (AGN) can also be strong emitters at radio wavelengths through either large populations of supernova remnants or accretion disk phenomena. Even though this emission is unaffected by obscuration, roughly of compact radio sources identified in deep radio surveys have either extremely faint optical counterparts or none at all (e.g., Richards et al. 1999; Fomalont et al. 2002), and may represent distant luminous obscured starburst or AGN powered galaxies. Such objects make a still unknown contribution to the luminosity, chemical, and accretion history of the universe. Determining an accurate census of heavily obscured sources - their redshifts, luminosities, space densities, and dominant power source - is one of the key issues in observational astrophysics and a primary objective of the Spitzer Space Telescope (Spitzer; Werner et al. 2004).111The Spitzer Space Telescope is operated by JPL, California Institute of Technology for the National Aeronautics and Space Administration. Information on Spitzer can be found at http:ssc.spitzer.caltech.edu.
A number of ambitious large area multi-wavelength surveys incorporating Spitzer data have been conducted to date. These include the Great Observatories Origins Deep Survey (GOODS), the Spitzer Wide-area InfraRed Extra-galactic survey (SWIRE), and the First Look Survey (FLS). This paper is concerned with the nature of infrared and radio selected sources with extremely faint optical counterparts originally selected from the NOAO Deep Wide-Field Survey (NDWFS) in Boötes (Jannuzi & Dey 1999)222The NOAO Deep Wide-Field Survey is supported by the National Optical Astronomy Observatory, which is operated by AURA, Inc., under a cooperative agreement with the National Science Foundation. Information on the NDWFS can be found at http:www.noao.edunoaonoaodeep. with the expectation that they are either heavily extincted, at high redshift, or both. Higdon et al. (2005; hereafter, Higdon05) identified thirty-six Optically “Invisible” Radio Sources (hereafter, OIRSs) out of 377 compact or unresolved radio sources found in a VLA A-array 20 cm survey covering 0.5 deg2 in the NDWFS Boötes field. These observations reached a flux density limit of Jy () at the three overlapping pointing centers. To be considered optically “invisible”, a radio source must have no , , or counterpart within a 1.5″ radius. This corresponds to limiting magnitudes of approximately 26.9, 25.6, and 24.9 (Vega; 2″ aperture) respectively, with the precise value depending upon location within the optical survey. The NDWFS region was surveyed at 24 m and 70 m with the Multiband Imaging Photometer for Spitzer (MIPS, Rieke et al. 2004). Analysis of the OIRS’s q-parameter led Higdon05 to conclude that they are a population powered by relatively unobscured radio-loud active nuclei.333q . Systems powered by star formation or radio-quiet active nuclei possess q . Smaller, and in particular, negative values of q indicate the presence of increasingly radio-loud active nuclei (Appleton et al. 2004). While none of the OIRSs have measured redshifts, Higdon05 argued that they are likely to be at based on the faint optical limits set by the NDWFS survey. An independently defined sample of seven optically faint ( 24.5) and ten optically “invisible” sources from the NDWFS Boötes region, subject to the additional constraints that 0.75 mJy and 100, was observed using Spitzer’s Infrared Spectrometer (IRS, Houck et al. 2004). These Optically “Invisible” MIPS Sources (hereafter, OIMSs) are a high-z population, with . Comparisons with mid-IR spectra of local starburst and AGN dominated galaxies suggested that the primary energy source in thirteen of the seventeen OIMSs is a heavily obscured active nucleus (Houck et al. 2005, hereafter Houck05). All seventeen have inferred luminosities of 1013 L⊙, placing them in the “hyper”-luminous class.
It is not known how the radio and infrared selected “invisible” populations in Higdon05 and Houck05 are related, apart from the fact that the majority of both appear to possess powerful AGN. We do not know, for example, if the OIRS population lies at systematically higher redshifts than the OIMSs with similar LIR, or for that matter, if they are a sub-L∗ population at . Key to addressing these issues is estimating photometric redshifts for the OIRSs, which are generally too faint for Spitzer’s IRS. In this paper, we present results obtained by combining optical , , and , and MIPS 24 m, 70 m, and 160 m flux densities (or limits) with data from Spitzer’s Infrared Array Camera (IRAC, Fazio et al. 2004) Shallow Survey of the NDWFS Boötes field (Eisenhardt et al. 2004). The IRAC Shallow Survey covers 8.5 deg2 in four bands centered at 3.6, 4.5, 5.8, & 8.0 m. For , these bands measure emission in the rest-frame near-infrared. Because this wavelength regime is much less sensitive to extinction relative to the optical, the IRAC data can constrain the evolved stellar content of galaxies at this epoch. Photometric redshifts are also possible by virtue of the rest-frame 1.6 m peak arising from the H- opacity minimum in the photospheres of evolved stars. It is our aim to derive basic properties for both optically “invisible” source populations, including rest-frame near-infrared luminosities and SEDs, and to determine, for example, if their rest-frame near-infrared emission is dominated by starlight or an AGN. Only then would it be possible to relate OIMSs and OIRSs to other high-z populations. It is also our intent to use the IRAC images to explore the near environments of OIMSs and OIRSs for additional clues to their nature and evolution.
A brief description of the extraction of IRAC flux densities for the infrared and radio selected “invisible” sources is given in 2. Photometric redshift estimates for selected OIRSs are presented in 3, along with determinations of the average rest-frame SEDs, luminosities, and near environments of the OIMS and OIRS samples detected with IRAC. The nature of these two populations is discussed in 4. These results are summarized in . Throughout this paper we will refer to the OIRSs and OIMSs by number (i.e., OIRS #97 or OIMS #13), corresponding to their entries in Table 2 of Higdon05 and Table 1 of Houck05. Source coordinates can be found from those papers directly, or through their SIMBAD designations, [HHW2005] # and [HSW2005] # for the OIRSs and OIMSs respectively. We assume a flat CDM cosmology, with =0.27, =0.73, and a Hubble constant of 71 km s-1 Mpc-1.
2. Observations And Source Extraction
Flux densities or limits at 3.6, 4.5, 5.8, and 8.0 m for the OIRSs and OIMSs were extracted from the final IRAC Shallow Survey mosaics (pipeline version S11) using SExtractor (Bertin & Arnouts 1996) with 4.8″ diameter apertures. All sources are nearly point-like, and point-source aperture corrections were applied. The 3.6 m images were used for matching the radio and 24 m selected source positions since they had the highest point source sensitivity ( = 6.4 Jy () in a 4″ diameter aperture) and angular resolution ( FWHM). To qualify as a “match” the coordinates of an OIMS or OIRS had to agree with an IRAC 3.6 m source to within . We decided upon this match radius after comparing the radio and mJy MIPS catalogs with the IRAC Shallow Survey catalog. For example, 2/3 of the compact 20 cm radio sources (excluding the OIRSs) had a 3.6 m source counterpart centered within . Since the great majority of these matches are real we took to represent the relative positional accuracy between the radio and IRAC 3.6 m catalogs. A similar value () was found for the relative positional accuracy between the mJy MIPS sources and 3.6 m counterparts in the Shallow Survey. The match radius of , while seemingly small, represents essentially a criterion, i.e., we would expect radio/IRAC mismatch out of the full 377 compact radio source sample. As a consequence, OIMSs and OIRSs can be said to lack IRAC counterparts at the level if no 3.6 m sources are within , and at the level if there are none within .
The original count of OIRSs in Higdon05 was thirty-six. However, we are no longer confident that #362 is a clear-cut OIRS. As a result, we will not include it in the following analysis. Of the remaining thirty-five OIRSs within the IRAC Shallow Survey, nineteen (54) were unambiguously detected at 3.6 m as shown in Figure 1. Even when a potential optical counterpart exists within (e.g., #97 & 410) the compact radio source sits squarely on an IRAC source. Of these, six (17) were detected in three IRAC bands to (OIRS 79, 176, 208, 245, 346, and 349), and two (176 and 349) in all four. The median 3.6 m and 4.5 m flux densities for these nineteen objects are 18.3 Jy and 22.5 Jy, respectively. Sixteen OIRSs were found to lack IRAC counterparts within and are shown in Figure 2. Note that in four instances (9, 305, 430, and 441) possible IRAC counterparts are present roughly away. OIRSs 9, 305, and 441 are particularly suspicious as their candidate IRAC matches are also optically “invisible”, i.e., like the 19 OIRSs with clear IRAC counterparts. The coordinate mismatches in these instances however equal or exceed the radio/IRAC relative positional accuracy at the level. Moreover, the expected number of OIRSs in Figure 2 with an optically “invisible” IRAC source away due to chance is , given the estimated density of 3.6 m sources with no optical counterparts (3.3 arcmin-2) in the Shallow Survey. We conclude that these four OIRSs are unlikely to be physically associated with the relatively nearby IRAC sources. However, even if we allow these four matches, it remains true that a significant fraction (at least 12/35 or 34) of the OIRSs lack clear 3.6m counterparts in the IRAC Shallow Survey.
It should also be noted that while the radio source morphologies in Figures 1 and 2 are for the most part quite simple, extended radio emission may have been lost due to a lack of short spacings (though the 4.5-hours spent at each pointing center in the A-array observations should reliably represent emission up to scale-sizes) or surface brightness dimming that might otherwise have connected an OIRS to an optical or infrared source. Observations in more compact array configurations will be needed to resolve this issue. With these caveats in mind, stack averages of the 3.6, 4.5, 5.8, and 8.0 m images at the radio source positions led to flux density upper-limits of 1.5, 2.0, 10.1, and 11.0 Jy () for the sixteen OIRSs with no apparent IRAC counterparts.
OIMS 11 was not included in this study due to its uncertain redshift.444The S/N for this source’s IRS spectrum is low. While Houck05 gives , a redshift of is just as feasible using the same galaxy template. All of the sixteen remaining OIMSs were detected by IRAC, although OIMSs 17 was only observed at 3.6 m and 5.8 m. These are shown in Figure 3 and their flux densities or limits are listed in Table 2. The median 3.6 m and 4.5 m flux densities for the fifteen OIMSs observed in all four IRAC bands are 17.0 Jy and 26.1 Jy, i.e., quite similar to that of the nineteen IRAC detected OIRSs. However, a much higher fraction of these OIMSs (12/15 or 80) were detected in all four IRAC bands. The OIMSs are also significantly brighter at 8.0 m than the OIRSs: the median OIMS is 136 Jy, while the median for the nine OIRSs detected in this band is 37 Jy.
The OIMSs were chosen from the MIPS 24 m catalog to satisfy 0.75 mJy, and the sources in Table 2 have a median of 1.1 mJy. By contrast, only four OIRSs were detected at 24 m at or higher (OIRS 97, 176, 245, and 363), with a mean of 0.38 mJy. Two additional OIRSs were detected at the level (OIRS 208 and 349), with a mean of 0.24 mJy. We stack-averaged MIPS 24 m sub-images centered on the eleven non-detected OIRSs in an attempt to recover faint emission from these sources. No significant signal was found, allowing us to set a flux density upper-limit of 67 Jy () at 24 m for these sources as a group. No OIRSs or OIMSs were detected with MIPS at 70 m or 160 m, placing upper-limits of 24 mJy and 60 mJy at these two wavelengths.
The IRAC and MIPS flux densities (or limits) for the two source populations are listed in Tables 1 and 2. To these have been added flux densities (or limits) in , and from the NDWFS catalog555If not already published, new limits were calculated using , where is the rms per pixel, Npix is the number of pixels within the 4 diameter aperture, and is the appropriate zero-point constant., and at 20 cm from either Higdon05 for the OIRSs or de Vries et al. (2002) for the OIMSs.
3. Properties Of The Optically Invisible Populations
3.1. Photometric Redshifts
Photometric redshifts () were calculated using a set of galaxy templates corresponding to starburst (M 82, from Xu et al. 2001), composite starburst plus AGN (Arp 220, from Devriendt et al. 1999, modified using IRS spectra to better represent its polycyclic aromatic hydrocarbon (PAH) emission and silicate absorption), AGN dominated (I Zw 1, Xu et al. 2001), and elliptical (Silva et al. 1998) galaxies. For each OIRS, the templates were redshifted from in steps of 0.05, re-gridded and scaled to the observed flux densities. Redshifts were determined by minimizing the reduced , defined as
| (1) |
where Oλ and T(1+z)λ are the observed and template flux densities, NDOF are the degrees of freedom, and is a scaling constant calculated at each value of z. The optical and far-infrared upper-limits were included in the calculation only when they were exceeded by the template flux density (i.e., when T Oλ). When this occurred Oλ was set to the respective limit and was calculated as above. Formal uncertainties in were estimated by numerically evaluating
| (2) |
Additional extinction corresponding to AV = 1-2 (assuming a screen geometry and the Galactic reddening law in Mathis 1990) was typically required to satisfy the optical constraints.666Estimates of the intrinsic extinction in the template galaxies can vary considerably depending on angular resolution, precise location in the source, and method used. Typical values of AV are 80 magnitudes for Arp 220 (Devriendt et al. 1999), 10 for the central region of I Zw 1 (Eckart et al. 1994), to 5 for M 82 (Lester et al. 1990; Telesco et al. 1991). The elliptical models of Silva et al. have essentially zero extinction. This was applied to the template in Equation 1 prior to redshifting.
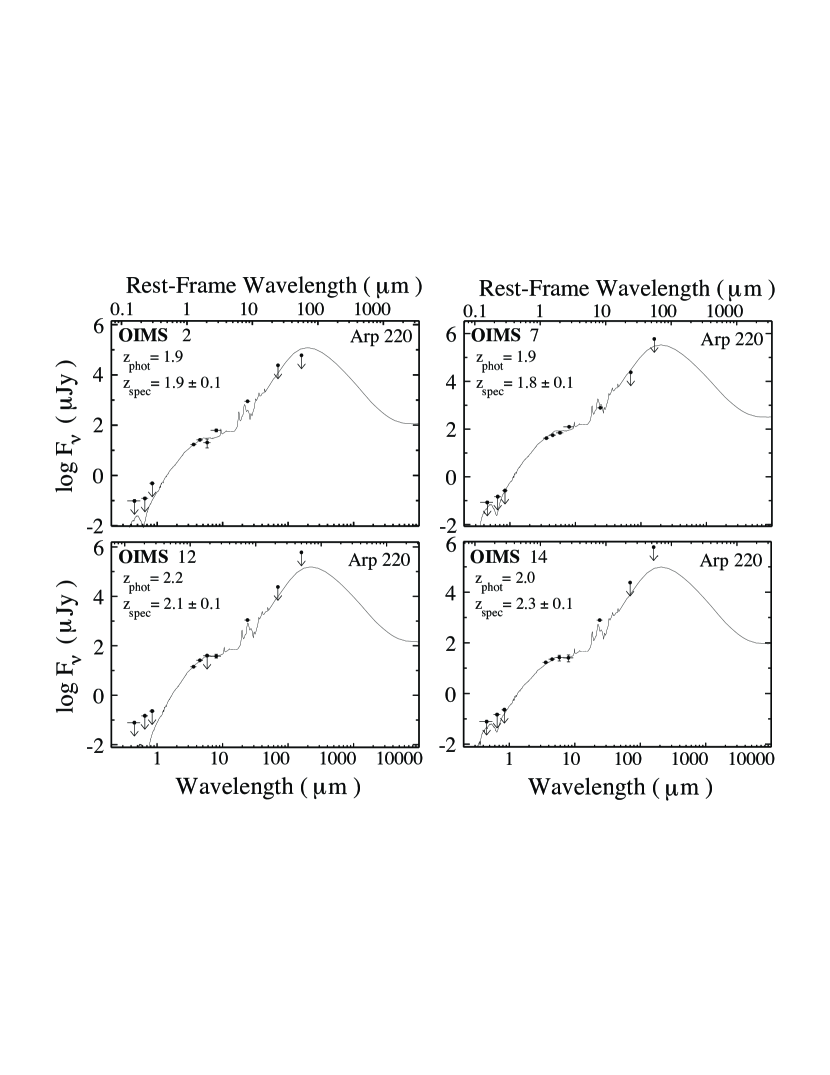
As a test, we determined photometric redshifts for the four OIMSs that Houck05 fit with either an Arp 220 or NGC 7714 spectral template (OIMS 2, 7, 12, and 14 in Table 2). The minimum- fits are shown in Figure 4 along with the corresponding photometric redshifts. We find good agreement between the photometric and spectroscopic redshifts of all four, with = 0.1, 0.1, 0.1 and 0.3, respectively. The Arp 220 template with an additional magnitudes of visual extinction provided the best fits for all four, including OIMS 2, whose IRS spectrum was classified as a starburst (NGC 7714) by Houck05. Starburst templates gave similar for this source, but produced too little emission at 8.0 m and 24 m, implying the presence of an additional dust component in the rest-frame mid-IR. The fact that OIMSs #12 & 14 are significantly brighter than the Arp 220 template in the 24 m band may reflect stronger PAH emission in these sources. Again, similar photometric redshifts were obtained using the M 82 template and down-weighting the 24 m measurements, however only the Arp 220 template could match the observed . The remaining OIMSs in Table 2 either lacked a sufficient number of data points for template fitting (e.g., 5, 10, and 17) or possessed power-law SEDs, for which unambiguous redshift determinations were not possible.
Photometric redshifts were derived for six OIRSs: 97, 176, 208, 245, 349, and 363. Each was detected in at least three IRAC and MIPS bands to . The minimum- fits are shown in Figure 5, along with the best matching template and derived . The results are summarized in Table 3. In each case we are fitting the inflection point in the spectrum where the dominant emission source changes from evolved stars to warm dust. For OIRS 363 the inflection point is implied by the upper-limits in the IRAC 5.8 m and 8.0 m bands, which effectively rule out a power-law between 3.6 m and 24 m. The derived redshifts range from 1.0 to 4.5 with a mean of 2.2. The formal redshift uncertainty is , though a comparable contribution to the error budget may arise from our ignorance of the source’s true SED. For example, OIRSs 97 and 245 would have been detected at 160 m to had the Arp 220 template accurately represented their far-infrared SEDs. (A more in depth analysis employing a larger set of templates and extinction laws is not warranted at this point given the paucity of data points.) The six OIRSs are best represented by either the starburst M 82 (176, 208, and 349) or the starburst/AGN composite Arp 220 (97, 245, and 363) templates. In each case the best fitting template was unambiguous. In particular, the AGN-dominated galaxy templates make poor matches to the SEDs in Figure 5. Likewise, elliptical galaxy templates are ruled out by the detection of emission at 24 m. This sub-sample of OIRSs detected both with IRAC and with MIPS at 24 m represents a population of sources with a significant starburst component with a redshift range similar to the OIMSs.
Two other OIRSs, 79 and 346, permitted rough photo- estimates. Minimum- fits are shown in Figure 6. For 79, the flat IRAC spectrum could reasonably be interpreted as the rest-frame 1-3 m region, consistent with redshifts between . In fact, the smallest is achieved with a starburst (M 82) template at = 1.6 with one magnitude of additional extinction. An Arp 220-like SED appears to be ruled out unless the 9.7 m silicate absorption feature in these sources is much deeper than the template. We emphasize that these redshifts are approximate, as also yields a small . The second OIRS in Figure 6, 346, shows a fairly steep power-law shape ( = -2.1, for ) in the IRAC data that does not extend to the MIPS 24 m band. If this spectral break occurs at rest-frame wavelengths of 1-2 m, then redshifts exceeding 3 are implied, and a reasonable fit using the M 82 and Arp 220 template at are possible, as is shown in Figure 6. Note that good fits also result using the elliptical template for both, since the 24 m upper-limit provides no constraint to the shape of the SED. In both cases, the derived is close to that derived using M 82 or Arp 220. Because these redshifts are only estimates, we do not include them in Table 3.
Overall, no starburst, AGN, or composite template could be found that would permit a fitted of less than one for the above eight OIRSs. At the very least, a significant fraction of OIRSs are at high redshift. While galaxy templates with a sizable young stellar component (i.e., Arp 220 or M 82) are consistent with the data, early-type galaxies cannot be ruled out in the two cases where there are no 24 m detections (Figure 6).
There are insufficient data to determine photometric redshifts for the remaining OIRSs in Table 1. It is important to keep in mind that we have derived reasonably confident for only 1/3 of the IRAC detected OIRSs. This represents only of the total OIRS sample from Higdon05. We will address the issue of how likely these six are to be representative of the entire OIRS population below.
3.2. Spectral Energy Distributions and Emission Mechanisms
Houck05 found that the mid-IR spectra of the OIMSs could be fit using only four templates, all derived from local galaxies (see Table 4). The same templates also fit the wider spectral energy distributions examined here. They are: (1) a heavily obscured Seyfert 2 nucleus, represented by IRAS F00183-7111 and denoted obsSy2, (2) an obscured Seyfert 1 nucleus, represented by Mrk 231 and denoted obsSy1, (3) a starburst nucleus, represented by NGC 7714 and denoted sb, and (4) a combination of an obscured AGN and a starburst, represented by Arp 220 and denoted comb. The first four panels of Figure 7 show average rest-frame SEDs for the sources in each category. The SEDs were found by shifting each source’s flux densities (or limits) to the rest-frame, then normalizing at µm. The individual scaled SEDs were then coadded and binned.
The averaged SEDs for the obsSy1 and obsSy2 OIMSs both show steep power-laws extending from . This is consistent with a luminous and heavily obscured active nucleus. Assuming this emission arises from dust, which is reasonable given the high extinction deduced by Houck05, emission at 1 µm implies that some of the dust approaches the sublimation temperature of refractory dust. For the obsSy2 SED, the power-law exponent () over the range µm, and there is a break in the power-law at –8 µm. For the obsSy1 OIMSs, the slope is shallower (), but the power-law component extends over a wider range, , with no break. The slope is still steep compared to SEDs of unobscured AGN (e.g., Elvis et al. 1994) and even compared to the lensed quasar APM 08279+5255 (Soifer et al. 2004), for which over µm. The steep SEDs suggest a distribution of dust mass that rises rapidly with distance from the central heating source, and the break in the obsSy2 SED suggests that the rapid rise ends at a distance corresponding to K. The absence of PAH emission in the IRS spectra of these objects is consistent with the AGN interpretation of the emission.
The sb SED rises about as steeply () as the obsSy1 SED in the rest-frame 1–8 µm spectral range, though with only one object the slope is poorly determined. A 1.6 µm bump can be seen in the IRAC data, indicating that the rest-frame 1–3 µm emission arises primarily from evolved stars. The steep rise at longer wavelengths is characteristic of dust in star formation regions. In contrast, the average SED for comb objects is much shallower for between 1 - 3 µm, , with a steeper rise from rest 3 to 8 µm. The lack of a prominent 1.6 µm bump suggests a power-law AGN component contributes much of the rest-frame m flux, and the steepening suggests the presence of dust associated with the starburst, consistent with the dual starburst/AGN nature of these objects.
The average SED for the six IRAC-detected OIRSs with photometric redshifts is also shown in Figure 7. This SED resembles the sb class by virtue of the clear 1.6 m bump. However, the steep rise for between 3 - 10 m may reflect a combination of star formation plus a weak active nucleus. In any event, there is no evidence of a dominant obscured active nucleus, which suggests that a significant fraction of the luminosity is provided by star formation. This is in marked contrast with the OIMSs, which are powered in most cases by dusty AGN. We again wish to stress that the averaged OIRS SED was created using only the six sources with photometric redshifts and may not be representative of the remaining thirteen IRAC detected OIRSs in Table 1, much less the parent population of OIRSs in Higdon05.
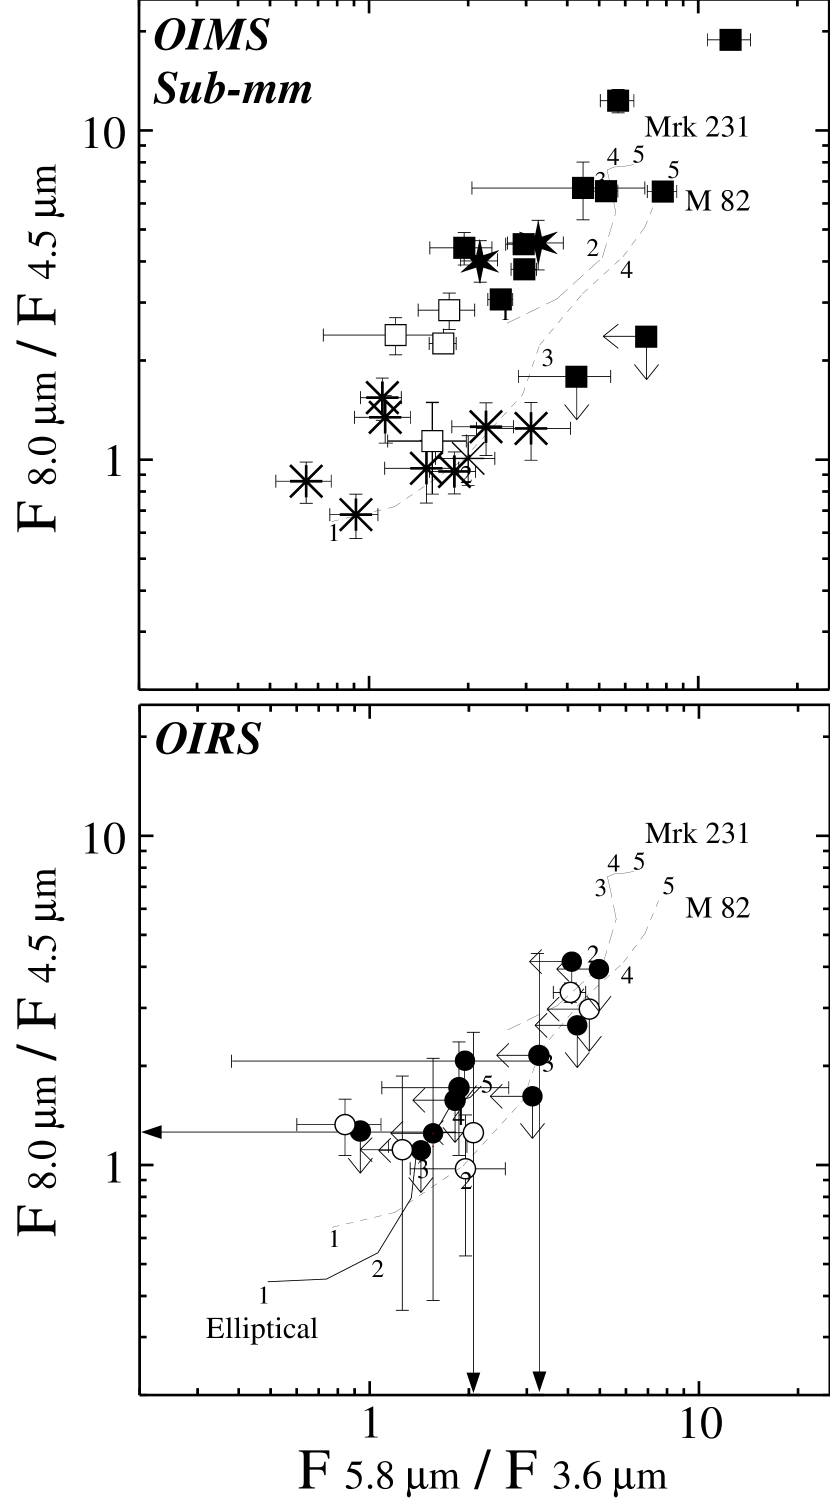
Additional insight into the dominant power source for OIMSs and IRAC detected OIRSs can be gathered from their positions in an IRAC two-color diagram. Figure 8 shows that OIMSs and OIRSs tend to occupy distinct regions. Most OIMSs define a fairly narrow distribution extending from relatively flat observer-frame SEDs () in the lower-left to steep power-law SEDs () in the upper-right. Nearly all of the obsSy1 and obsSy2 OIMSs lie above , in the portion of the diagram dominated by quasars and obscured AGN (Lacy et al. 2004). This is consistent with both their IRS spectra (which show deep 9.7 m silicate absorption and no PAHs) and their steep power-law SEDs in Figure 7. The comb and sb OIMSs are situated at and , where starburst systems dominate, also in agreement with their IRS spectra.
The IRAC detected OIRSs are shown in the lower panel of Figure 8. The six OIRSs with photometric redshifts have positions that are for the most part consistent with the dusty M 82 track for , in agreement with their and fitted spectral templates. The remainder of this population are also clustered in the lower-left of the figure, i.e., and . Given the uncertainties, their IRAC colors are equally consistent with elliptical galaxies at or moderately obscured () starbursts. However, all possess radio-loud AGN by virtue of their negative q-values and so cannot be pure starbursts.
Figure 8 highlights the fact that the IRAC detected OIRSs as a group have much flatter mid-IR SEDs than the OIMSs. The latter possess mean ratios of 170, 65, 52, and 44 for the obsSy2, obsSy1, sb, and comb classes respectively. By contrast, the thirteen IRAC detected OIRSs without (i.e., the filled circles in Figure 8) possess a mean . Given their 3.6 µm flux densities, all thirteen should have been detected at 24 µm had their SEDs been steep power-laws like the obsSy1 and obsSy2 OIMSs.777 For example, OIRS #232, with the smallest Jy, would have yielded 24 µm flux densities between 0.5 and 1.4 mJy, easily detectable by the MIPS survey. Even if their SEDs resembled the sb or comb OIMSs, most would have been detected at 24 m. This is consistent with emission from stellar photospheres and AGN heated dust being at least comparable in most of the IRAC detected OIRSs.
3.3. Luminosities and Stellar Masses
Rest-frame K-band luminosities, defined as L, with corresponding to the Johnson K-band filter FWHM ( Hz; Tokunaga et al. 2002) were calculated for the OIMSs and the six OIRSs with photometric redshifts. These are listed in Tables 3 and 4 in units of the sun’s K-band luminosity (L⊙,K = 8.7 1024 W; Bessel 1979). With this definition, Arp 220 and IRAS F00183-7111 would have Johnson K-band luminosities of L⊙,K and L⊙,K respectively. Monochromatic rest-frame luminosities at 5 m, defined as L, were also calculated for these sources. This quantity provides a measure of the emission from hot () dust free of any contribution from evolved stars and which avoids the (rest-frame) silicate feature. These are also given in Tables 3 and 4. Uncertainties in redshift constitute the dominant source of error in the derived luminosities.
The OIMSs are highly luminous in the rest-frame K-band, with a median LK of L⊙,K and more than an order of magnitude spread. The obsSy2 OIMSs are the most luminous, with LK L⊙,K on average. These are followed by the obsSy1 and comb OIMS, both with average LK L⊙,K. The obsSy2 and comb OIMSs are both on average an order of magnitude more luminous than their local templates, IRAS F00183-7111 and Arp 220. Their rest-frame monochromatic 5 m luminosities are also extremely large, with median L5μm = W and W for the obsSy2 and obsSy1 OIMSs respectively.
The six IRAC detected OIRSs with photometric redshifts show a very wide range in LK, led by 176 with L⊙,K. This is roughly fifty times more luminous than the five other OIRSs and nearly twice as large as the most luminous OIMS. The three OIRSs that were best fit with a comb template have a mean LK of 5 1011 L⊙,K. This is within a factor of two of the average for the three comb OIMSs (OIMS 7, 12 and 14). Accurate 8-1000 m luminosities (LIR) for the OIMSs and OIRSs are not possible since none were detected at 70 m or 160 m. However, the fact that median LK for the OIRSs and comb/sb OIMSs are similar suggests that they have comparable total luminosities, and that at least some of the IRAC detected OIRSs are hyper-luminous.
The 1.6 m bump apparent in the averaged OIRS SED in Figure 7 points to a significant evolved stellar component. For these objects we estimated stellar masses by multiplying their LK by near-infrared mass to light ratios derived from burst models in Bell & de Jong (2001). From their Figure 1, we adopted M∗/LK = 0.3, which corresponds to their bluest models ( = 0.6). The mass to light ratio increases fairly slowly with color, as can be seen from the fact that M∗/LK = 0.5 at = 1.0. We find a wide range in derived stellar masses, again led by OIRS 176 with M M⊙. The other OIRSs have masses in the range M⊙, with a mean of M⊙. Very massive galaxies are indicated even if warm dust makes a 50 contribution to the rest-frame 2.2 m emission.
Despite the lack of redshifts for the remaining IRAC detected OIRSs, we can set useful limits to their stellar masses if we assume they lie at and that the (putative) AGN makes an insignificant contribution to the IRAC 3.6 m and 4.5 m bands. The first assumption is reasonable given their faint optical limits. The second follows from the data in Table 1, where only OIRSs #49, 79, 232, & 410 have mid-IR to radio SEDs that might allow significant synchrotron emission in the mid-IR. For , where the IRAC 4.5 m band measures rest-frame 2.2 m emission, the average (18.0 Jy) implies a K-band luminosity of L⊙,K. For an early-type M∗/LK ratio, we derive a typical stellar mass of M⊙ for this sub-population. So long as there is minimal contribution from an AGN to the 4.5 m emission, the IRAC detected OIRSs without redshifts also appear to be massive galaxies.
For the majority of OIMSs, the rest-frame near-infrared is dominated by non-stellar emission, and the upper-limits to their stellar masses are not very informative. However, the four OIMSs with comb or sb IRS spectra (#2, 7, 12, and 14) show evidence of a weak 1.6 m bump in Figures 1 and 4. Using the same starburst M∗/LK of 0.3, their rest-frame LK imply maximum M∗ between M⊙. These objects also appear to be very massive even if the stellar component makes only a contribution to the rest-frame near-infrared.
Rest-frame 20cm luminosity densities were estimated for the OIMSs and the six IRAC detected OIRSs with using
| (3) |
where DL is the luminosity distance in Mpc, is the radio spectral index (), taken to be 0.65, and is the observed 20 cm flux density (or upper-limit) in Jy. The latter are taken from Higdon05 and de Vries et al. (2002). Seventy per cent of the OIMSs were not detected in the radio, implying L20cm upper-limits of W Hz-1 (). Of the remainder, OIMS 13 in Table 4 is noteworthy for possessing the largest radio luminosity density among both OIRS and OIMS, with L W Hz-1. It represents the sole OIMS that is squarely in the “powerful” radio galaxy class (i.e., L20cm W Hz-1; McCarthy 1994). A wide range of values is found for the OIRSs with photometric redshifts, with L20cm between 0.2-2.9 1025 W Hz-1 and a median of W Hz-1.
The six IRAC detected OIRSs show signs of large evolved stellar populations by virtue of the 1.6 m bump apparent in Figure 7. If we assume that their radio emission arises primarily from supernova remnants, we can estimate their current star formation rates with their L20cm. Excluding the radio-loud OIRS #97 (q), we derive a median SFR of 2200 M⊙ yr-1 after Bell (2003). For the single sb-like OIMS the L20cm upper-limit implies SFR M⊙ yr-1. Assuming a minimal contribution to L20cm from an active nucleus, we find these objects to possess SFRs comparable to the highest values derived for local ultra-luminous infrared galaxies (ULIRGs) using both X-ray and far-infrared luminosities (e.g., Persic et al. 2004).
3.4. The Near Environments of OIMSs and OIRSs
Most of the IRAC detected OIRSs appear to possess nearby companion candidates, whereas few of the OIMSs do. Figure 3 shows that the OIMSs are typically unresolved by IRAC at 3.6 m, with only OIMS #3 and 6 showing hints of structure. By contrast, twelve of the nineteen IRAC detected OIRSs () in Figure 1 are clearly not simple point-sources. Examples include OIRS #79, 97, and 363. While gravitational lensing by foreground clusters can not be ruled out, the most straightforward interpretation is that IRAC is detecting several closely spaced galaxies. This is consistent with the majority of the IRAC detected OIRSs having companions within .
The clustering properties of these systems are beyond the scope of this paper. It is worth noting, however, that neither OIMSs nor OIRSs appear to inhabit particularly crowded environments like the cores of rich clusters. For example, using the sixteen IRAC subimages of OIMSs in Figure 3 we find an average of sources per wide field (not including the OIMSs). The average number of sources in the fields centered on OIRSs is , again not including the OIRSs. As a baseline figure, we would have expected sources in a random sized region given the total number of sources ( at 3.6 m) detected within the 8.5 deg2 IRAC Shallow Survey (Eisenhardt et al. 2004).888We used the Student t-Test to evaluate the likelihood that the IRAC detected OIRSs have a significantly higher number of companion candidates within the 20′′ wide fields relative to the OIMSs. For the sources visible in the two sets of IRAC sub-images, we calculated t = 1.43. For thirty-two degrees of freedom and a 95% confidence level, t would have had to exceed 2.04 for a significant difference between the OIMSs and OIRSs near environments to be real. We thus find no measurable difference in the apparent density on this scale.
This is not to suggest that OIMSs and the IRAC detected OIRSs do not inhabit clusters. Recent work indicates that radio galaxies and quasars show a wide variety in local density up to at least , from the cores of rich clusters to field-like environments (e.g., Barr et al. 2004; Best et al. 2003). Further, the radio galaxies and radio-loud quasars that are associated with rich centrally concentrated clusters are as often as not situated outside the actual core. Given these trends and the rather small spatial dimensions of the IRAC subimages (area 0.04 Mpc2) it is perhaps not surprising that we do not see an excessive number of companion galaxies surrounding the OIMSs or OIRSs. An investigation of the environments of OIMSs and OIRSs on scales of several Mpc2 will be presented in a future paper.
4. Discussion
4.1. OIMSs as Buried QSOs
Houck05 concluded that both the obsSy1 and obsSy2 OIMSs are heavily obscured and hyper-luminous, with LIR estimated to be . Their IRS spectral shapes, and in particular, the absence of PAHs, implied that their primary energy source was an active nucleus rather than star formation. We have shown that the obsSy1 and obsSy2 OIMSs also possess steep power-law SEDs over the rest-frame m region and extremely high rest-frame monochromatic 5 m luminosities (L W). The latter originates in the hottest dust component and necessarily implies a powerful active nucleus. To place these luminosities in context, we calculated rest-frame for the sample of 42 3CRR radio galaxies and quasars observed with Spitzer by Ogle et al. (2006).999Rest-frame were extrapolated for the quasars and radio galaxies in Table 1 of Ogle et al. using the listed rest-frame and the 7 to 15 m spectral indices. For the sources classified as mid-IR luminous, which consist of quasars and narrow-line radio galaxies (NLRGs), L W. The quasar-like L5μm of the obsSy1 and obsSy2 OIMSs, together with their steep power-law SEDs and IRS spectra provide compelling evidence that they are driven by powerful AGN accreting near the Eddington limit. These sources may be considered to be obscured or “buried” quasi-stellar objects (QSOs).
Final proof that the obsSy1 and obsSy2 OIMSs host heavily obscured QSOs would be the detection of luminous hard (i.e., keV) X-ray emission. These photons originate very near the super-massive black hole and are a reliable indicator of powerful AGN activity. They are also fairly insensitive to obscuration, at least up to N cm-2 where the optical depth for Compton scattering reaches unity. Of the OIMSs discussed in this paper, only 13 (not coincidently, the most radio-loud OIMS) was detected above the 99 confidence level in the “hard” ( erg s-1 cm-2) and “full” ( erg s-1 cm-2) bands in the 2 ks Chandra survey of the Boötes field by Kenter et al. (2005). This corresponds to a hard X-ray luminosity L W, with no correction for intrinsic extinction.101010X-ray luminosities were calculated from L, where DL is the luminosity distance and is the power-law index, taken to be 1.8. For the other eight obsSy1 and obsSy2 OIMSs we obtain upper-limits of L W, again with no extinction correction. Powerful AGN in the local universe typically possess L W. So while only OIMS 13 can be conclusively shown to be a “buried” QSO based on its hard X-ray emission, the other obsSy1 and obsSy2 OIMSs are still consistent with this interpretation. Deeper observations (or a stacking analysis) to detect hard X-rays with Chandra should be carried out, as well as searches for high-ionization infrared lines such as [S IV] and [Ne V] . These were not evident in the IRS spectra shown in Houck05, though this can be attributed to the low spectral resolution coupled with the relative faintness ( mJy) of the sources.
4.2. The OIRSs Detected by IRAC
The IRAC detected OIRSs fall into two groups depending on whether or not they were also detected with MIPS at 24 m. Those that are detected at 24 m appear to be massive and dusty galaxies that are primarily driven by star formation. Those not detected at 24 m (by far the majority) possess radio-loud AGN as evidenced by their negative q upper-limits. They also appear to be massive, with if they are at as their faint optical limits imply. Their individual limits are consistent with mid-IR SEDs in which stellar emission is at least comparable to that from dust close to the central engine.
Figure 9 shows the ratio as a function of redshift for five representative objects known to contain powerful AGN: the composite obsSy2 OIMS from Figure 7, the NLRG 3C459, the quasar 3C273, the Low Excitation Radio Galaxy (LERG) 3C293, and the “red and dead” radio galaxy LBDS 53W091 (Stern et al. 2006). Except for the OIMS and LBDS 53W091 the SEDs were constructed using data from NED. This figure also illustrates the extremely steep m SED of the obsSy2 OIMSs relative to a fairly typical NLRG and quasar. The thick horizontal line in the figure represents the mean upper-limit for the IRAC detected OIRSs (). This was determined by dividing the stack-averaged 24 m upper-limit (67 Jy, ) by the mean for the twelve OIRSs not detected at 24 m. The upper/lower bounds to these limits, defined by dividing the stack-averaged 24 m limit by the minimum/maximum values are also shown as two thin horizontal lines. Taken as a group, these OIRSs have spectral shapes that are inconsistent with obsSy2 OIMSs, typical NLRGs, and quasars at essentially all redshifts. They are, however, consistent with LERGs and the “red and dead” radio source LBDS 53W091 for .
Of the two, LERGs are currently the best studied at infrared wavelengths. LERGs are identified by their nuclear spectra which show extremely weak high-excitation optical lines like [O III] 5007 Å (Laing et al. 1994), and are nearly always hosted by massive ellipticals. Most FRI radio galaxies are LERGs, though a substantial number of FRIIs are as well. LERGs display a wide range of radio luminosities, with L20cm 1023 W Hz-1 to W Hz-1, showing that LERGs can be “powerful” radio galaxies. Their flat rest-frame near to mid-IR SEDs have been attributed to the absence of massive obscuring tori like those inferred in NLRGs and BLRGs. More direct evidence comes from X-ray spectra of LERG nuclei, which (with few exceptions) lack an absorbed soft component (Evans et al. 2006), and radio VLBI observations showing polarized emission on parsec scales (Kharb et al. 2005).111111This has led to suggestions that the accretion process in LERGs is fundamentally different from NLRGs and BLRGs (e.g., Hardcastle et al. 2006). Accordingly, super-massive black-holes in NLRGs and BLRGs accrete material from a dusty molecular torus while those in LERGs accrete hot gas directly from the intergalactic medium through Bondi accretion (Allen et al. 2006). For our purposes, this is less important in understanding their infrared SEDs than the apparent lack of a massive obscuring torus extending close to the central engine. Siebenmorgen et al. (2004) used simple dust models to fit the optical/infrared SEDs of a number of LERGs in the 3CRR (Laing et al. 1983). They concluded that compared with NLRGs and BLRGs, LERGs possess lower AGN luminosities, more extensive dust distributions (i.e., much less dust at small radii), and lower overall obscuration (A).
The small limits for the OIRSs not detected at 24 m are consistent with a population of high- LERGs, i.e., massive elliptical galaxies hosting radio-loud AGN with relatively small amounts of dust close to the central engine. However, the data are also consistent with a population of radio-loud ellipticals with active nuclei weak enough to be “drowned out” by stellar emission, even if only temporarily, due to a drop in the mass accretion rate.
Whether the OIRSs discussed in this section are LERGs or not, their radio luminosities will be substantially less than W Hz-1 if their typical redshifts are . Only if will most of these objects be classified as “powerful” radio galaxies. Future observations to better constrain their rest-frame infrared SEDs and determine accurate redshifts will be required to help resolve this issue.
It may at first seem puzzling that so many of the IRAC detected OIRSs resemble LERGs and “red and dead” radio galaxies. One may ask where are the optically “invisible” mid-IR luminous NLRGs? Part of the answer must lie in the way the OIRS sample was originally defined, namely, by requiring a compact or unresolved radio morphology in the A-array 20 cm images. The original intent of the VLA survey was to detect optically obscured starburst galaxies through their radio emission. Such sources were expected to be point-like in the 20 cm A-array images. As a result, extended radio structures (i.e., jets and lobes) were excluded from consideration from the outset since they (1) would identify AGN dominated sources, and (2) would have also proven difficult to confidently associate with an optical counterpart given the high source density in the NDWFS , , and -band images. As a consequence, it is possible that we preferentially selected beamed radio sources, i.e., sources resembling BL Lac objects. It has been suggested that FRI radio galaxies are the parent population for BL Lac objects. The fact that LERGs comprise most of the local FRI allows a simple explanation, namely, that most of the IRAC selected OIRSs are in fact a population of high-z BL Lac objects.
4.3. The OIRSs Not Detected by IRAC
The fact that nearly half (16/35) of the OIRSs appear to lack IRAC counterparts (see Figure 2) is a significant result, especially in light of the small number of spurious radio sources expected in Higdon05.121212There are 392 radio sources in the final catalog. The number of false radio sources was estimated by repeating the SExtractor runs on the final VLA images multiplied by -1. The number of negative “sources” provides a robust estimate of the number of false positives. Only three such sources were found in the radio images, a number that is also consistent with random fluctuations given the number of independent synthesized beams in the radio images. Minimal contamination of the source catalog is indicated. We also considered the possibility that some of the OIRSs might be hot-spots in large radio doubles “resolved out” by the interferometer array. However, given their wide separation (few OIRSs are within 2-3 minutes of each other) these would have to be gigantic radio sources, and therefore unlikely. By contrast, all of the OIMSs were detected by IRAC, which suggests that the two groups have very different SEDs and/or redshifts. We can constrain the average LK of the non-IRAC detected OIRSs (and indirectly, their likely redshift range) with the stack-averaged upper-limits at 3.6, 4.5, 5.8, and 8.0 m listed in 2.
If the OIRSs not detected by IRAC are primarily a 1 population, they must be sub-L∗ galaxies. For an object at , where rest-frame 2.2 m shifts to the center of the IRAC 3.6 m band, the 1.5 Jy upper-limit would correspond to LK 1.2 1010 L⊙,K. This is substantially smaller than the K-band luminosities of L∗ galaxies determined by Kochanek et al. (2001), who found L = 0.7-1.2 1011 L⊙,K for early to late types.131313 Kochanek et al. derived M using a complete sample of 4,353 galaxies in the 2MASS survey. For H∘ = 71 km s-1 Mpc-1, their results translate into M = -23.7 (late-type), -24.3 (early-type), and -24.1 (all types). This in turn limits the stellar mass of the non-IRAC detected OIRS hosts. For an early-type galaxy M∗/L (Bell & de Jong 2001), and the resulting M∗ is less than 8 109 M⊙. Still smaller masses result for later host types since M∗/LK will only decrease for these galaxies. Galaxies of this mass are unlikely to host radio-loud AGN as powerful as W Hz-1, which is the inferred average L20cm for the non-IRAC detected OIRSs over .
On the other hand, if the host galaxies of these OIRSs are ellipticals as suggested by Gruppioni et al. (2001), we would have expected to detect most with IRAC. A spinning super-massive black hole is generally held to be a requirement for a radio-loud active nucleus (Rees 1984). Since the black hole mass correlates with the mass of the host galaxy’s stellar bulge (e.g., Magorrian et al. 1998), radio-loud AGN hosts are known to be quite massive, and considerably more luminous than L∗. Using the above stack-averaged limits, we find the redshift where a massive elliptical host galaxy with LK = 3L would escape detection to be , with a corresponding average L20cm of W Hz-1. The OIRSs not detected by IRAC appear to represent a population of powerful radio galaxies at .
This may not be the entire story, of course. The OIRSs lacking IRAC counterparts show a substantially wider dispersion in compared with the OIRSs detected by IRAC. Of the four OIRSs with mJy, three lack IRAC counterparts. At the same time, eight of the thirteen OIRSs fainter than 0.25 mJy at 20cm lack IRAC counterparts. It may well be that the non-IRAC detected OIRSs consist of two distinct populations: one characterized by W Hz-1 and (corresponding to the 0.25 mJy objects) and a much more powerful and distant sub-group of radio galaxies (i.e., those with 1 mJy). Further progress in understanding the nature of these objects will require either photometric redshifts derived with deeper Spitzer IRAC and MIPS observations, or through ground-based spectroscopy using the next generation of large optical telescopes.
4.4. Comparison with Sub-Millimeter Galaxies
It is worth comparing properties of the OIMSs and OIRSs with other luminous objects at , in particular, the galaxies discovered at sub-millimeter wavelengths using instruments like SCUBA (Smail et al. 1997). Sub-millimeter galaxies (SMGs) are extremely luminous (L L⊙) and dusty systems, with a redshift distribution that peaks near (Chapman et al. 2003). Most appear to be powered primarily by star formation. Indeed, a significant fraction of star formation in the early universe may take place in them. SMGs also tend to be extremely faint or “invisible” at optical wavelengths (e.g., Hughes et al. 1998). To ensure meaningful comparisons with the OIMSs and OIRSs, we selected a sample of ten SMGs detected at 850 m with SCUBA in the Lockman Hole East region that were observed with both IRAC and MIPS by Egami et al. (2004). Four of the SMGs were also detected at 1.2 mm with MAMBO (Eales et al. 2003) by Ivison et al. (2004), and nine were detected at 20 cm using the VLA’s A-configuration (Ivison et al. 2002). The redshift range for the SMG sample () is similar to that of the OIMSs and the IRAC detected OIRSs with . Rest-frame radio and infrared luminosities as defined in 3.3 were calculated for the SMGs and are listed in Table 5. Likewise, averaged rest-frame m SEDs were calculated as in 3.2, and are shown in Figure 7 for the “cold” SMGs.
Two of the ten SMGs possess power-law SEDs in the IRAC and MIPS data, suggesting a significant AGN contribution (“warm” sources in Egami et al.’s terminology). Their power-law exponents () are similar to those of the obsSy1 OIMSs. The largest K-band luminosity belongs to the “warm” SMG LH850.8b (LK L⊙,K), which is within a factor of of the median LK for the hyper-luminous obsSy2 OIMSs ( L⊙,K). The remaining eight SMGs have SEDs consistent with obscured star formation providing the bulk of their luminosity (i.e., “cold” sources in Egami et al.’s terminology).
There is considerable overlap between the emission properties of the “cold” SMGs and the sb/comb OIMSs and IRAC detected OIRSs with . For all three groups we derive comparable luminosities at rest-frame K-band (average L⊙,K for the “cold” SMGs) and 5 m (average Lν(5 m) W), both over an order of magnitude smaller than the obsSy1 and obsSy2 OIMSs. The similarity between the “cold” SMGs and the sb/comb and IRAC detected OIRSs with extends to their averaged rest-frame SEDs as well, as Figure 7 shows. In particular, both the “cold” SMGs and IRAC detected OIRSs with show a prominent 1.6 m bump implying substantial evolved stellar components. This is followed by a gradual rise to 10 m as expected for dusty starbursts. Adopting a starburst M∗/LK of 0.3, we estimate a median stellar mass of M for the “cold” SMGs, which is comparable with the starburst dominated OIMSs and OIRSs. Similarly, assuming that the radio continuum from the “cold” SMGs originates in supernova remnants, star formation rates between 500 and 1700 M⊙ yr-1 (median SFR = 1100 M⊙ yr-1) are implied by their L20cm. The similar luminosities, implied star formation rates and stellar masses, faint optical magnitudes, and SED shapes is evidence that at least a fraction of the OIMSs and IRAC detected OIRSs are members of the same parent population as the “cold” (i.e., starburst dominated) SMGs.
The top panel of Figure 8 includes the ten “warm” and “cold” SMGs in the IRAC two-color diagram, along with the OIMSs. As expected, the two “warm” SMGs are positioned in the region occupied by the AGN powered obsSy1 OIMSs. Neither have mid-IR SEDs that rise as fast as the obsSy2 OIMSs, though with only two “warm” sub-millimeter sources it is impossible to draw any definite conclusions. The eight “cold” sources are situated close to the dusty M 82 track at , both consistent with their redshifts and with obscured star formation providing the bulk of their luminosities. There is a clear separation between the “cold” SMGs on one hand and the AGN dominated obsSy1 and obsSy2 OIMSs on the other.
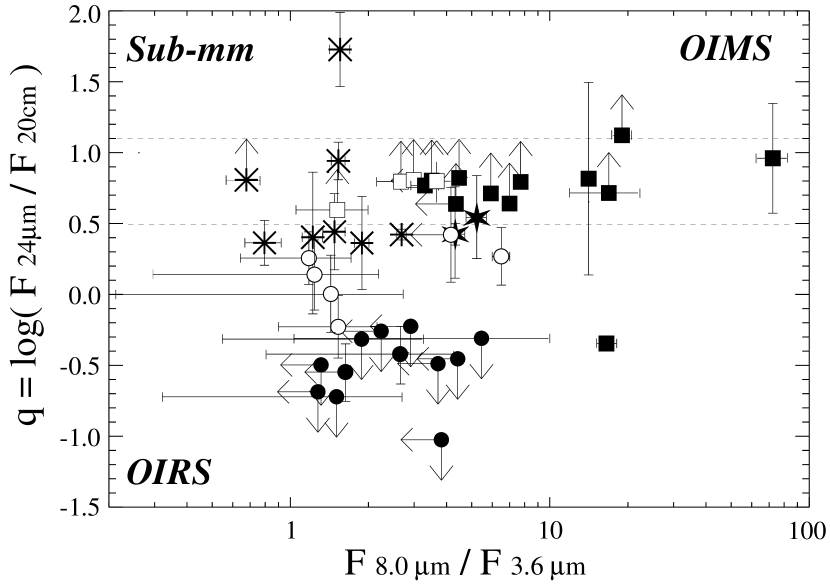
Figure 10 shows the relative positions of the OIMSs, OIRSs, and the ten Lockman Hole East SMGs in a radio/infrared two-color diagram. Systematic trends can be seen: (1) obsSy1 and obsSy2 OIMSs extend to the right of center () due to their steep power-law SEDs; (2) comb and sb OIMSs are situated primarily to the left of this, with ratios between 1.6 and 4; (3) “cold” SMGs are left of center (); (4) “warm” SMGs are to the right of the “cold” ones (); (5) the IRAC detected OIRSs primarily occupy the lower-left portion of the diagram. A few of the latter overlap the region occupied by the “cold” SMGs. However, the majority of IRAC detected OIRSs are radio-loud (13/19 have q ) and are well separated from five of the six OIRSs with . It is also apparent that with two exceptions, the OIMSs and the “warm” and “cold” SMGs obey the radio-infrared correlation within the uncertainties.141414OIMS #13 is the most radio-loud OIMSs in Houck05, while the “cold” SMG [LE 850] 8a may have strong PAH emission within the 24 m passband, giving rise to its large q-value. OIMSs, OIRSs, and SMGs thus occupy distinct regions in a radio/infrared two-color diagram, though there is also considerable overlap, particularly between the OIMSs and SMGs.
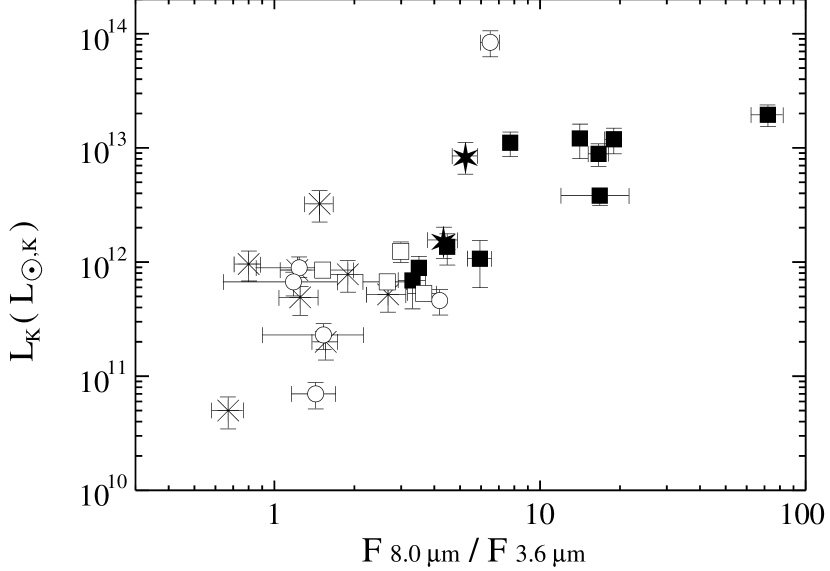
This overlap is further illustrated in Figure 11, where LK is plotted against . A clear progression is seen, with luminous and flat-spectrum “cold” SMGs (i.e., LK L⊙,K and ) giving way to obsSy1 OIMSs and “warm” SMGs (LK few L⊙,K and ), and finally to the steep power-law obsSy2 OIMSs (LK 1013 L⊙,K and ). This suggests that the OIMSs, a subset of the IRAC detected OIRSs, and the SMGs are all taken from the same population of dusty hyper-luminous high- objects. The chief difference between them is the dominant emission mechanism: obsSy1 and obsSy2 OIMSs in particular can be thought of as analogs of SMGs sources whose luminosities in the rest-frame near and mid-IR are dominated by powerful and heavily obscured active nuclei accreting near the Eddington limit.
Figure 10 also illustrates a dichotomy between the IRAC detected OIRSs with and without redshifts (i.e., those with and without 24 m detections). With one exception, all of the former are characterized by , which is consistent with systems dominated by star formation, a radio-quiet AGN, or a combination of the two. By contrast, the remaining IRAC detected OIRSs all have negative q-values indicating an increasingly dominant radio-loud active nucleus. The parent OIRS population is similarly dominated by radio-loud active nuclei, for excluding the six OIRSs with , 72% of the sources in Table 1 of Higdon05 have negative q. This suggests that the 24 m detected OIRSs in Figure 5 are not representative of the larger OIRSs population, but rather form a starburst dominated sub-group.
4.5. Do OIMSs and SMGs Form an Evolutionary Sequence?
Results from the previous sections suggest that the obsSy1/obsSy2 OIMSs and “cold” SMGs are members of the same parent population of heavily obscured hyper-luminous galaxies, with the fundamental difference being their dominant power source, i.e., either accretion near the Eddington limit or star formation. The obsSy1 and obsSy2 OIMSs in particular can be thought of as heavily obscured QSOs. While it is true that very few SMGs contain “buried” QSOs (, Almaini et al. 2003), recent ultra-deep X-ray observations argue persuasively that many SMGs contain massive central black holes and luminous, though not yet dominant, active nuclei. For example, of the SMGs with radio counterparts and known redshifts in the Chandra Deep Field North were detected in hard X-rays by Alexander et al. (2005). Their X-ray luminosities (L W), levels of obscuration (eighty percent show N cm-2), and spectral power-law exponents () are similar to nearby powerful AGN. However, their X-ray to infrared luminosity ratios (LX/L) are typically an order of magnitude smaller than QSOs, consistent with intense star formation (SFR M⊙ yr-1) providing the bulk of their luminosity. This may be simply saying that that the X-ray detected SMGs are currently accreting at substantially sub-Eddington rates, which would imply that the only real difference between the obsSy1/obsSy2 OIMSs and “cold” SMGs is the rate at which material is transfered to the central engine. On the other hand, near-IR spectra of SMGs typically show that when broad rest-frame optical lines are present they are typically only km s-1 wide (cf. Swinbank et al. 2004), which is consistent with only modest black hole masses, i.e., M⊙. It is thus possible (though admittedly speculative) that what distinguishes the AGN powered OIMSs and “cold” SMGs is primarily the central black hole mass rather than simply the accretion rate.
Given the well established correlation between the masses of the spheroid and central black hole in local galaxies (e.g., Kormendy & Richstone 1995; Magorrian et al. 1998) and the evidence linking the SMG population with current epoch massive ellipticals (e.g., Smail, Ivison, & Blain 1997; Barger et al. 1998; Barger et al. 1999), it is intriguing to consider the possibility that the obsSy1 and obsSy2 OIMSs represent SMGs that have made the transition from a starburst dominated “cold” phase to an accretion dominated “buried” QSO phase. A plausible mechanism for this transition would be the growth of a sufficiently massive black hole (in parallel with the stellar bulge) during the high-SFR “cold” phase, with the subsequent transfer of material to the central regions through tidal interactions or mergers. The energy released during this relatively brief phase would act to expell the obscuring gas and dust from the central regions, effectively halting the growth of the bulge and super-massive black hole and “unveiling” a QSO in the manner envisoned by Sanders et al. (1988).
SMGs and OIMSs appear to have have very different mean space densities. If so, this would have important implications for the envisoned SMG-QSO transition. For example, the number of SMGs per square degree with mJy (which we take to represent the hyper-luminous sources) is 400 using the cumulative 850 m source count formulation in Sanders (2000). Assuming they all lie between , their average space density becomes Mpc-3. There are seventy sources in the NDWFS Boötes field satisfying mJy and , i.e., OIMSs by our definition, of which fifty-eight have been observed by Spitzer. Forty-five of these OIMSs can be confidently classified as obsSy1 or obssSy2 on the basis of their IRS spectra and/or steep power-law infrared SEDs (Higdon et al. in preparation). Over half of these sources have on the basis of IRS observations, and the remainder have IRAC/MIPS SEDs consistent with this redshift range.151515It was noted in 3.2 that the obsSy2 OIMSs show a pronounced break in their power-law SEDs near m. For the obsSy2-like OIMSs in the larger sample with featureless IRS spectra, the observed wavelength of this SED break was found to be consistent with . There are thus obsSy1 and obsSy2 OIMSs in the 8.5 deg2 NDWFS. Assuming that the OIMSs with no redshift measurements are within , we estimate a mean space density of Mpc-3 for this population, or nearly two orders of magnitude smaller than . This could be simply explained if the duration of the “buried” QSO phase is short compared with the SMG’s “cold” phase, i.e., the time spent growing a sufficiently massive black hole and bulge.
One caveat to the above analysis is the sensitivity of to the adopted 850 m flux density cut-off. For example, if only the mJy SMGs pass through a obsSy1 or obsSy2 phase, then Mpc-3, and . The sub-millimeter properties of the OIMS population are largely unknown, and it is not certain whether OIMSs with mJy map onto SMGs with F mJy, or for that matter, SMGs with F mJy.161616For example, none of the OIMSs in Houck05 and in the larger sample of OIMSs were detected by MIPS at 70 m or 160 m. Conversely, it had been previously noted that SMGs are fainter than expected at 24 m given their inferred LIR (e.g., Ivison et al. 2004; Egami et al. 2004). This difference may simply reflect the presense of a strong contribution from AGN heated dust in the OIMSs that is lacking in the “cold” SMGs. Despite these uncertainties, it appears likely that . This suggests that if indeed the obsSy1 and obsSy2 OIMSs represent a transition from SMGs to QSOs, and eventually to current epoch massive elliptical galaxies, it is a relatively rapid one.
4.6. Do Interactions Trigger the Activity in OIMSs/OIRSs?
Evidence that the near environment of galaxies plays a role in triggering active nuclei has been known for some time. Heckman et al. (1984, 1986), for example, found that a large fraction of low redshift quasars have companion galaxies within that typically differ in radial velocity from the quasar by km s-1. In addition, roughly one-third of radio galaxies show highly peculiar morphologies (i.e., tails, bridges, and shells) indicative of tidal interactions. More recent work supports these results (e.g., Canalizo & Stockton 2001). The 3.6 m images in Figure 1 suggest that most IRAC detected OIRSs possess close companions, and may therefore be tidally interacting. If so, this implies that like low redshift radio galaxies, the central activity in the majority of the IRAC detected OIRSs may be induced through collisions.
The fact that most OIMSs appear point-like with IRAC might at first suggest that they are relatively isolated. However, the mid-IR images shown in Figure 3 cannot exclude the possibility that OIMSs possess faint or lower-mass companions capable of inducing tidal perturbations large enough to fuel an active nucleus. Nor can the IRAC images rule out the possibility that OIMSs are a population of late-state mergers. Local examples, such as NGC 7252, typically show luminous asymmetric cores with extended low surface brightness tails (Schweizer 1982). Neither would be detectable with IRAC given the OIMS’s redshifts. It thus remains an interesting possibility that interactions have triggered the nuclear activity in both OIRSs and OIMSs. Deep and high angular resolution near-infrared imaging studies will be needed to test this hypothesis.
5. Conclusions
OIMSs can be split into two populations based on their rest-frame 1-10 m SEDs and IRAC colors in concordance with their IRS spectra: most (12/16) are dominated by a heavily obscured radio-quiet active nucleus, while the remainder are powered by either a starburst or a composite starburst/active nucleus. The AGN dominated obsSy1 and obsSy2 OIMSs in particular are extremely luminous in the rest-frame near and mid-IR, with Lν(5 m) comparable to the most luminous local NLRGs and quasars. They can be regarded as “buried” QSOs and likely represent the predecesors of current epoch massive elliptical galaxies. OIMSs are also distinct from other high-z source populations routinely selected using UV/optical or optical/near-infrared criteria such as LBGs and BzKs in their dominant power source, levels of obscuration, and mid-IR luminosity. Compared with other optically faint mid-IR selected populations (e.g., Yan et al. 2007), OIMSs represent extremes in both obscuration and AGN luminosity. This follows from their respecive selection criteria, which for OIMSs favor steeper mid-IR continuua and higher levels of extinction. There appears to be significant overlap between OIMSs and SMGs, with the sb/comb OIMSs appearing largely indistinguishable from SMGs in their optical, mid-infrared, and radio properties. Moreover, the obsSy1 and obsSy2 OIMSs may represent a brief obscured phase in the transition of a “cold” SMG to a QSO, and eventually to a massive current epoch elliptical galaxy.
The OIRSs do not represent a single source population. The minority (6/35) that are detected by both IRAC and MIPS at 24 m have SEDs, mid-IR colors, and q-values indicative of either starburst or composite starburst/AGN powered systems. For these sources we find in between 1.0 and 4.5, implying rest-frame K-band luminosities, maximum star formation rates, and stellar masses virtually identical to the “cold” (i.e., starburst dominated) SMGs in the Lockman Hole East region.
The remaining OIRSs - which comprise of the parent population in Higdon05 - fall into two classes depending upon whether or not they are detected by IRAC. Those that are detected have flat mid-IR SEDs implying comparable luminosities from stellar photospheres and hot AGN illuminated dust. As a group, their average L24μm/L3.6μm ratio is most consistent with either Low Excitation Radio Galaxies (LERGs) or objects like the “red and dead” radio galaxy LBDS 53W091. Those that are not detected by IRAC must be at if they are as massive as the hosts of local radio sources. Both of these groups are characterized by negative values of q and thus may represent a population of relatively unobscured radio galaxies at high redshift. Both represent populations that are highly distinct from the obsSy1 and obsSy2 OIMSs.
Differences between the optically invisible populations detected through observations at sub-millimeter, mid-IR and radio wavelengths can be understood in terms of selection effects: (1) extreme optical/mid-IR luminosity ratios appears to ensure highly obscured AGN dominated sources (obsSy1 and obsSy2 OIMSs), (2) extreme optical/sub-millimeter luminosity ratios will select highly obscured sources primarily powered by star formation (SCUBA/MAMBO sources), and (3) compact sub-mJy radio sources lacking optical counterparts appears to preferentially choose distant BL Lac-like objects (OIRSs).
We find no evidence that OIMSs or OIRSs inhabit the cores of rich clusters. Nor do we find significant differences in local galaxy density between the two on kpc scales. However, unlike the OIMSs, a large fraction of the IRAC detected OIRSs appear to possess close and massive companions, though higher angular resolution studies will be needed to reach firm conclusions. This suggests that the luminosity of OIRSs (and conceivably OIMSs) may be triggered by tidal interactions, as appears to be the case for low- radio galaxies and quasars. The IRAC detected OIRSs may thus represent the formation of very massive galaxies at high redshift through major mergers.
References
- (1)
- (2) Adelberger, K., Steidel, C., Shapley, A., Hunt, M., Erb, D., Reddy, N., & Pettini, M. 2004, ApJ, 607, 226
- (3)
- (4) Alexander, D., Bauer, F., Chapman, S., Smail, I., Blain, A., Brandt, W.. & Ivison, R. 2005, ApJ, 632, 736
- (5)
- (6) Allen, S., Dunn, R., Fabian, A., Taylor, G. & Reynolds, C. 2006, MNRAS, 372, 21
- (7)
- (8) Almaini, O. et al. 2003, MNRAS, 338, 303
- (9)
- (10) Appleton, P. et al. 2004, ApJS, 154, 147
- (11)
- (12) Barger, A., Cowie, L., Sanders, D., Fulton, E., Taniguchi, Y., Sato, Y., Kawara, K., & Okuda, H. 1998, Nature, 394, 248
- (13)
- (14) Barger, A., Cowie, L., & Sanders, B. 1999, ApJ, 518, L5
- (15)
- (16) Barr, J., M., Baker, J. C., Bremer, M. N., Hunstead, R. W., & Bland-Hawthron, J. 2004, AJ, 128, 2660
- (17)
- (18) Bell, E. F. & de Jong, R. S. 2001, ApJ, 550, 212
- (19)
- (20) Bell, E. F. 2003, ApJ, 586, 794
- (21)
- (22) Bertin, E. & Arnouts, S. 1996, A&AS, 117, 393
- (23)
- (24) Bessel, M. S. 1979, PASP, 91, 589
- (25)
- (26) Best, P. N., Lehnert, M. D., Miley, G. K., & Röttgering, H. J. 2003, MNRAS, 343, 1
- (27)
- (28) Canalizo, G. & Stockton, A. 2001, ApJ, 555, 719
- (29)
- (30) Chapman, S., Blain, A., Ivison, R. & Smail, I. 2003, Nature, 422, 695
- (31)
- (32) Chary, R., & Elbaz, D. 2001, ApJ, 556, 562
- (33)
- (34) Daddi, E., Cimatti, A., Renzini, A., Fontana, A., Mignoli, M., Pozzetti, L. Tozzi, P. & Zamorani, G. 2004, ApJ, 617, 746
- (35)
- (36) Devriendt, J. E. G., Guiderdoni, B., & Sadat, R. 1999, A&A, 350, 381
- (37)
- (38) de Vries, W. H., Morganti, R., Röttgering, H. J., Vermeulen, R., van Breugel, W., Rengelink, R., & Jarvis, M. J. 2002, AJ, 123, 1784
- (39)
- (40) Eales, S. A., Bertoldi, F., Ivison, R. J., Carilli, C., Dunne, L, & Owen, F. 2003,MNRAS, 344, 169
- (41)
- (42) Eckart, A., van der Werf, P., Hofmann, R., & Harris, A. 1994, ApJ, 424, 627
- (43)
- (44) Egami, E. et al. 2004, ApJS, 154, 130
- (45)
- (46) Eisenhardt, P. R. et al. 2004, ApJS, 154, 48
- (47)
- (48) Elvis, M., Wilkes, B., McDowell, J., Green, R., Bechtold, J., Willner, S., Oey, M., Polomski, E. & Cutri, R. 1994, ApJS, 95, 1
- (49)
- (50) Evans, D., Worrall, D., Hardcastle, M., Kraft, R., & Birkinshaw, M. 2006, ApJ, 642, 96
- (51)
- (52) Fazio, G. G. et al. 2004, ApJS, 154, 10
- (53)
- (54) Fomalont, E., Kellermann, K., Partridge, R., & Richards, E. 2002, AJ, 123, 2402
- (55)
- (56) Gruppioni, C., Oliver, S., & Serjeant, S. 2001, Ap&SS, 276, 791
- (57)
- (58) Hardcastle, M., Evans, D., & Croston, J. 2006, MNRAS, 370, 1893
- (59)
- (60) Heckman, T. M., Bothun, G. D., Balick, B., & Smith, E. P. 1984, AJ, 89, 958
- (61)
- (62) Heckman, T. M. et al. 1986, ApJ, 311, 526
- (63)
- (64) Higdon, J. L., Higdon, S. J. U., Weedman, D. W., Houck, J. R., Le Floc’h, E., Brown, M. J. I., Dey, A., Jannuzi, B. T., Soifer, B. T. & Rieke, M. J. 2005, ApJ, 626, 58 (Higdon05)
- (65)
- (66) Houck, J. R. et al. 2004, ApJS, 154, 18
- (67)
- (68) Houck, J. R., Soifer, B. T., Weedman, D., Higdon, S. J. U., Higdon, J. L., Herter, T., Brown, M. J. I., Dey, A., Jannuzi, B. T., Le Floc’h, E., Rieke, M., Armus, L., Charmandaris, V., & Teplitz, H. 2005, ApJ, 622, 105 (Houck05)
- (69)
- (70) Hu, E. M., & Ridgeway, S. E. 1994, AJ, 107, 1303
- (71)
- (72) Hughes, D. H., et al. 1998, Nature, 394, 241
- (73)
- (74) Ivison, R. J. et al. 2002, MNRAS, 337, 1
- (75)
- (76) Ivison, R. J. et al. 2004, ApJS, 154, 124
- (77)
- (78) Jannuzi, B. & Dey, A. 1999, ASP Conference Series Vol. 191, (R. Weymann, L. Storrie-Lombardi, M. Sawicki, & R. Brunner, eds.), p. 111
- (79)
- (80) Kenter, A., Murray, S., Forman, W., Jones, C., Green, P., Kochanek, C., Vikhlinin, A., Fabricant, D., Fazio, G., Brand, K., Brown, M., Day, A., Jannuzi, B., Najita, J., McNamara, B., Shields, J., & Rieke, M. 2005, ApJS, 161, 9
- (81)
- (82) Kharb, P., Shastri, P., & Gabuzda, D. 2005, ApJ, 632, 69
- (83)
- (84) Kochanek, C. S., Pahre, M., Falco, E., Huchra, J., Mader, J., Jarrett, T., Chester, T., Cutri, R., & Schneider, S. 2001, ApJ, 560, 566
- (85)
- (86) Kormendy, J. & Richstone, D. 1995, ARA&A, 33, 581
- (87)
- (88) Lacy, M. et al. 2004, ApJS, 154, 166
- (89)
- (90) Laing, R., Riley, J., & Longair, M. 1983, MNRAS, 204, 151
- (91)
- (92) Laing, R., Jenkins, C., Wall, J., & Unger, S. 1994, ASP Conference Series, Vol. 54, (Bicknell, Dopita, and Quinn, eds.), p. 56
- (93)
- (94) Lester, D., Carr, J., Joy, M., & Gaffney, N. 1990, ApJ, 352, 544
- (95)
- (96) Magorrian, J. et al. 1998, AJ, 115, 2285
- (97)
- (98) Mathis, J. C. 1990, ARA&A, 28, 37
- (99)
- (100) McCarthy, P. 1993, ARA&A, 31, 639
- (101)
- (102) Ogle, P., Whysong, D. & Antonucci, R. 2006, ApJ, 647, 161
- (103)
- (104) Persic, M. et al. 2004, A&A, 419, 849
- (105)
- (106) Rees, M. J. 1984, ARA&A, 22, 471
- (107)
- (108) Richards, E., Fomalont, E., Kellermann, K., Windhorst, R., Partridge, R., Cowie, L. & Barger, A. 1999, ApJ, 526, L73
- (109)
- (110) Rieke, G. H. et al. 2004, ApJS, 154, 25
- (111)
- (112) Sanders, D., Soifer, B., Elias, J., Madore, B., Matthews, K., Neugebauer, G. & Scoville, N. 1988, ApJ, 325, 74
- (113)
- (114) Sanders, D. 2000, Advances in Space Research, 25, 2251
- (115)
- (116) Schweizer, F. 1982, ApJ, 252, 455
- (117)
- (118) Siebenmorgen, R., Haas, M., Krügel, E., & Schulz, B. 2005, A&A, 436, L5
- (119)
- (120) Silva, L., Granato, G., Bressan, A., & Danese, L. 1998, ApJ, 509, 103
- (121)
- (122) Smail, I., Ivison, R. J., & Blain, A. W. 1997, ApJ, 490, 5
- (123)
- (124) Soifer, B. T. et al. 2004, ApJS, 154, 151
- (125)
- (126) Stern, D., Chary, R., Eisenhardt, P., & Moustakas, L. 2006, ApJ, 132, 1405
- (127)
- (128) Steidel, C., Giavalisco, M., Dickinson, M. & Adelberger, K. 1996, AJ, 112, 352
- (129)
- (130) Swinbank, A., Smail, I., Chapman, S., Blain, A., Ivison, R. & Keel, R. 2004, ApJ, 617, 64
- (131)
- (132) Telesco, C. M., Campinis, H., Joy, M., Dietz, K., & Decher, R. 1991, ApJ, 369, 135
- (133)
- (134) Tokunaga, A. T., Simons, D. A., & Vacca, W. D. 2002, PASP, 114, 180
- (135)
- (136) Werner, M. W. et al. 2004, ApJS, 154, 1
- (137)
- (138) Xu, C., Lonsdale, C. J., Shupe, D. L., O’Linger, J., & Masci, F. 2001, ApJ, 562, 179
- (139)
- (140) Yan, L., Sajina, A., Fadda, D., Choi, P., Armus, L., Helou, G., Teplotz, H. Frarer, D., & Surace, J. 2007, ApJ, 658, 778
- (141)
- (142)
| OIRS(a)(a)OIRS number from Table 2 in Higdon05, where source positions are given. These sources are also designated [HHW2005] by SIMBAD as (e.g., [HHW2005] 97). | F(b)(b) limits from NDWFS images. | FR(b)(b) limits from NDWFS images. | FI(b)(b) limits from NDWFS images. | F3.6μm | F4.5μm | F5.8μm | F8.0μm | F24μm | F20cm | q(c)(c) ). The radio flux densities are from Higdon05, while the 24 m flux densities and limits are from this work. |
|---|---|---|---|---|---|---|---|---|---|---|
| [HHW2005] | (Jy) | (Jy) | (Jy) | (Jy) | (Jy) | (Jy) | (Jy) | (mJy) | (mJy) | |
| 19 | 0.062 | 0.256 | 0.404 | 26.7 1.9 | 27.6 2.5 | 25.0 12.5 | 35.0 | 0.18 | 0.57 0.04 | -0.50 |
| 49 | 0.056 | 0.233 | 0.255 | 12.5 2.1 | 15.6 2.7 | 40.5 | 33.2 12.1 | 0.18 | 0.57 0.03 | -0.50 |
| 79 | 0.081 | 0.256 | 0.193 | 29.1 2.1 | 35.2 2.7 | 45.3 | 43.9 12.2 | 0.18 | 0.95 0.04 | -0.72 |
| 97 | 0.056 | 0.147 | 0.212 | 19.7 1.9 | 24.1 2.5 | 40.7 | 30.2 12.1 | 0.23 0.04 | 0.40 0.03 | -0.24 0.08 |
| 114 | 0.081 | 0.194 | 0.255 | 16.8 1.8 | 18.4 2.3 | 31.3 12.6 | 31.6 11.2 | 0.18 | 0.37 0.05 | -0.31 |
| 156 | 0.067 | 0.122 | 0.176 | 22.0 1.9 | 22.8 2.5 | 39.9 | 35.8 | 0.18 | 0.80 0.06 | -0.65 |
| 176 | 0.067 | 0.194 | 0.336 | 38.2 2.2 | 74.2 3.1 | 155.3 15.1 | 248.1 13.2 | 0.46 0.04 | 0.25 0.04 | 0.26 0.08 |
| 182 | 0.067 | 0.161 | 0.336 | 9.7 1.7 | 8.7 1.8 | 39.9 | 36.0 | 0.18 | 0.55 0.04 | -0.49 |
| 185 | 0.067 | 0.122 | 0.212 | 16.0 1.9 | 17.0 2.4 | 31.0 13.0 | 35.8 | 0.18 | 0.33 0.04 | -0.26 |
| 208 | 0.067 | 0.122 | 0.193 | 32.1 2.1 | 35.8 1.7 | 40.3 | 39.8 12.1 | 0.26 0.08 | 0.19 0.03 | 0.13 0.15 |
| 232 | 0.074 | 0.281 | 0.336 | 8.1 1.7 | 9.1 2.3 | 40.4 | 35.9 | 0.18 | 0.51 0.02 | -0.45 |
| 245 | 0.074 | 0.256 | 0.306 | 21.2 1.9 | 25.7 2.5 | 41.5 12.8 | 25.0 11.2 | 0.44 0.05 | 0.24 0.03 | 0.26 0.07 |
| 278 | 0.076 | 0.148 | 0.146 | 2.2 | 6.1 1.6 | 29.4 13.5 | 35.6 | 0.18 | 0.45 0.07 | -0.40 |
| 346 | 0.067 | 0.112 | 0.176 | 8.8 1.6 | 13.2 2.2 | 36.8 | 47.9 11.4 | 0.18 | 0.37 0.04 | -0.31 |
| 349 | 0.062 | 0.134 | 0.232 | 26.7 0.9 | 28.9 1.5 | 22.5 6.9 | 38.3 7.2 | 0.25 0.08 | 0.24 0.05 | 0.02 0.17 |
| 363 | 0.056 | 0.134 | 0.193 | 8.6 0.9 | 12.0 1.4 | 40.3 | 36.0 | 0.38 0.05 | 0.15 0.04 | 0.40 0.13 |
| 380 | 0.074 | 0.194 | 0.279 | 9.4 1.7 | 13.5 2.4 | 40.0 | 35.8 | 0.18 | 1.92 0.04 | -1.0 |
| 389 | 0.074 | 0.112 | 0.193 | 12.4 1.8 | 22.3 2.5 | 40.0 | 36.0 | 0.18 | 0.30 0.02 | -0.22 |
| 410 | 0.067 | 0.147 | 0.193 | 28.2 2.0 | 32.5 2.6 | 40.3 | 36.0 | 0.18 | 0.88 0.08 | -0.69 |
| OIMS(a)(a) OIMS number from Table 1 in Houck05, where source positions are given. These sources are also designated [HSW2005] by SIMBAD (e.g., [HSW2005] 13). | F(b)(b) Optical flux densities or limits from NDWFS. | FR(b)(b) Optical flux densities or limits from NDWFS. | FI(b)(b) Optical flux densities or limits from NDWFS. | F3.6μm | F4.5μm | F5.8μm | F8.0μm | F24μm | F20cm(c)(c) 20 cm flux densities or limits from de Vries et al. (2002). | q(d)(d)q log(). The values are from Houck05. |
|---|---|---|---|---|---|---|---|---|---|---|
| [HSW2005] | (Jy) | (Jy) | (Jy) | (Jy) | (Jy) | (Jy) | (Jy) | (mJy) | (mJy) | |
| 1 | 0.169 | 0.337 | 0.443 | 26.9 1.0 | 46.0 1.4 | 79.3 8.9 | 207.7 8.2 | 1.24 0.01 | 0.15 | 0.90 |
| 2 | 0.081 | 0.102 | 0.404 | 17.0 1.0 | 26.0 1.4 | 20.4 8.0 | 62.1 7.3 | 0.89 0.01 | 0.15 | 0.76 |
| 3 | 0.067 | 0.123 | 0.193 | 22.3 1.0 | 26.0 1.6 | 39.0 7.4 | 73.9 8.2 | 1.81 0.02 | 0.31 0.03 | 0.77 0.04 |
| 4 | 0.089 | 0.445 | 0.584 | 17.6 0.9 | 38.0 1.4 | 92.4 6.4 | 248.5 7.3 | 1.08 0.01 | 0.24 0.04 | 0.65 0.06 |
| 5 | 0.067 | 0.123 | 0.193 | 4.8 0.8 | 9.4 1.3 | 33.0 | 21.0 | 0.87 0.01 | 0.15 | 0.75 |
| 6 | 0.067 | 0.123 | 0.193 | 15.6 0.8 | 21.1 1.5 | 30.4 6.3 | 92.6 8.2 | 1.03 0.02 | 0.15 | 0.82 |
| 7 | 0.141 | 0.123 | 0.443 | 41.7 0.8 | 55.3 1.4 | 70.1 6.5 | 124.7 7.8 | 0.78 0.01 | 0.15 | 0.70 |
| 8 | 0.129 | 0.123 | 0.279 | 12.2 0.8 | 18.8 1.4 | 69.6 6.7 | 231.3 7.9 | 2.65 0.02 | 0.15 | 1.23 |
| 9 | 0.067 | 0.123 | 0.193 | 7.4 1.0 | 28.3 1.2 | 92.4 6.8 | 533.3 5.9 | 3.83 0.02 | 0.42 0.03 | 0.96 0.04 |
| 10 | 0.511 | 0.123 | 0.336 | 6.0 0.8 | 12.5 1.4 | 25.3 7.7 | 21.0 | 1.45 0.01 | 0.15 | 0.97 |
| 12 | 0.067 | 0.123 | 0.193 | 14.3 1.0 | 25.9 1.3 | 41.0 | 38.0 6.8 | 1.12 0.01 | 0.20 0.03 | 0.80 0.07 |
| 13 | 0.561 | 0.929 | 1.112 | 42.1 3.2 | 107.2 4.5 | 328.1 22.5 | 699.2 25.1 | 2.30 0.01 | 5.09 0.03 | -0.34 0.01 |
| 14 | 0.067 | 0.123 | 0.193 | 16.9 0.8 | 22.6 1.5 | 26.4 7.0 | 25.7 7.8 | 0.79 0.01 | 0.15 | 0.69 |
| 15 | 0.067 | 0.123 | 0.193 | 33.3 0.9 | 48.5 1.4 | 83.6 6.9 | 148.8 7.5 | 1.05 0.01 | 0.15 | 0.82 |
| 16 | 0.067 | 0.123 | 0.193 | 3.6 0.9 | 9.0 1.4 | 16.0 7.5 | 60.4 8.0 | 1.04 0.01 | 0.15 | 0.81 |
| 17 | 0.067 | 0.123 | 0.193 | 20.6 0.8 | (e)(e) No data at these bands. | 56.2 6.3 | (e)(e) No data at these bands. | 1.23 0.01 | 0.15 | 0.89 |
| OIRS(a)(a)OIRS number from Table 2 in Higdon05, where source positions are given. These objects are designated in SIMBAD as [HHW2005] (e.g., [HHW2005] 97). | Template(b)(b)The best fitting galaxy template; see 3.1 for descriptions. | AV(c)(c)Additional visual extinction in magnitudes to satisfy optical constraints. | LK(d)(d)The source rest-frame Johnson K-band luminosity, defined as LK = 4D(1+z), in units of the sun’s K-band luminosity, L⊙,K = 8.7 1024 W (Bessel 1979). DL is the luminosity distance, is the Johnson K-band filter FWHM ( Hz; Tokunaga et al. 2002), and is the source flux density at estimated from the source’s SED template. | L5μm(e)(e)The source rest-frame monochromatic luminosity at 5 m in Watts, defined as Lν(5 m), where Lν(5 m) = 4D(1+z). DL is again the luminosity distance and is the source flux density at estimated from the source’s SED template. | M∗(f)(f)Stellar mass derived by multiplying LK by M∗/LK = 0.3, which is appropriate for a starburst galaxy (Bell & de Jong 2001). | L20cm | |
|---|---|---|---|---|---|---|---|
| [HHW2005] | ( 1011 L⊙,K ) | ( 1037 W ) | ( 1011 M⊙ ) | ( 1025 W Hz-1 ) | |||
| 97 | 1.5 0.3 | Arp 220 | 2 | 3.7 1.6 | 0.3 0.2 | 1.4 0.5 | 0.4 0.2 |
| 176 | 4.5 0.2 | M 82 | 1 | 278. 26. | 11.6 1.3 | 116. 11. | 2.9 0.3 |
| 208 | 2.0 0.3 | M 82 | 1 | 9.9 3.4 | 0.7 0.2 | 3.4 1.1 | 0.4 0.1 |
| 245 | 2.0 0.3 | Arp 220 | 2 | 7.4 2.7 | 1.2 0.3 | 3.3 1.1 | 0.5 0.2 |
| 349 | 1.0 0.2 | M 82 | 2 | 1.8 0.6 | 0.09 0.03 | 0.8 0.3 | 0.2 0.1 |
| 363 | 2.2 0.6 | Arp 220 | 1 | 4.5 2.4 | 1.1 0.6 | 2.3 1.4 | 0.4 0.2 |
| OIMS(a)(a)Source number from Table 1 of Houck05 where coordinates can be found. The OIMSs can also be referenced by their SIMBAD designation HSW2005 (e.g., [HSW2005] 13) | Template(b)(b)Best fitting template spectrum type; see §3.2 for descriptions. | LK(c)(c)Rest-frame Johnson K-band luminosity in units of the sun’s K-band luminosity, L⊙,K = 8.7 1024 W (Bessel 1979). | L5μm(d)(d)Monochromatic luminosity at rest-frame 5 m in Watts, defined as Lν(5 m). | M∗(e)(e) Stellar mass derived by multiplying LK by M∗/LK = 0.3, which is appropriate for a starburst (Bell & de Jong 2001). | L20cm | log LIR(f)(f)Estimated 8-1000 m luminosity from Houck05. | |
|---|---|---|---|---|---|---|---|
| [HSW2005] | ( 1012 L⊙,K ) | ( 1038 W ) | ( 1011 M⊙ ) | ( 1025 W Hz-1 ) | ( L⊙ ) | ||
| 1 | 2.64 0.25 | obsSy2 | 8.3 1.8 | 8.3 1.8 | 25. | 0.8 | 13.3 |
| 2 | 1.86 0.07 | sb | 0.7 0.1 | 1.0 0.1 | 1.9 0.2 | 0.4 | 13.0 |
| 3 | 1.78 0.30 | obsSy1 | 0.9 0.3 | 0.9 0.3 | 2.7 | 0.5 0.2 | 13.0 |
| 4 | 2.59 0.34 | obsSy2 | 9.4 2.9 | 9.4 2.4 | 28. | 0.9 0.3 | 13.2 |
| 5 | 2.34 0.28 | obsSy2 | 0.7 | 13.0 | |||
| 6 | 1.96 0.34 | obsSy1 | 1.2 0.5 | 1.7 0.6 | 3.7 | 0.4 | 12.8 |
| 7 | 1.78 0.14 | comb | 1.6 0.3 | 1.4 0.3 | 4.8 0.9 | 0.3 | 13.4 |
| 8 | 2.62 0.26 | obsSy2 | 9.1 2.1 | 10.2 2.2 | 27. | 0.8 | 13.6 |
| 9 | 2.46 0.20 | obsSy2 | 16.3 3.2 | 21.0 4.1 | 49. | 1.4 0.3 | 13.7 |
| 10 | 2.08 0.21 | obsSy1 | 0.9 0.2 | 0.8 0.2 | 2.8 | 0.5 | 13.0 |
| 12 | 2.13 0.09 | comb | 0.7 0.1 | 0.4 0.1 | 2.1 0.2 | 0.5 0.1 | 13.8 |
| 13 | 1.95 0.17 | obsSy2 | 10.2 2.1 | 10.9 2.2 | 31. | 10.2 2.1 | 13.3 |
| 14 | 2.26 0.11 | comb | 0.8 0.8 | 3.0 0.4 | 2.4 0.3 | 0.6 | 13.7 |
| 15 | 1.75 0.21 | obsSy1 | 1.8 0.5 | 1.6 0.4 | 5. | 0.3 | 12.7 |
| 16 | 2.73 0.19 | obsSy2 | 2.7 0.4 | 2.9 0.5 | 8. | 0.8 | 13.2 |
| 17 | 2.13 0.17 | obsSy1 | 0.5 | 13.0 |
| Source(a)(a)Source number in Table 1 of Egami et al. (2004), where radio, mid-IR, and sub-millimeter flux densities are given. Coordinates can be found via SIMBAD using the designation LE850 followed by the source number (i.e., [LE850] 4). | (b)(b)Sources 8a, 14a, and 18 have spectroscopic redshifts. The other redshifts are photometric. See footnotes a and b in Table 1 of Egami et al. (2004) for references. | Type(c)(c)Sources classified as “warm” possess power-law SEDs in the Spitzer data and are likely AGN powered, whereas “cold” sources appear to be powered largely by star formation (e.g., bottom-right panel of Figure 7). | LK(d)(d)Rest-frame Johnson K-band luminosity in units of the sun’s K-band luminosity, L⊙,K = 8.7 1024 W (Bessel 1979). | L5μm(e)(e)Monochromatic luminosity at rest-frame 5 m in Watts, defined as Lν(5 m). | M∗(f)(f)Estimated stellar mass from multiplying LK by M∗/LK = 0.3, which is appropriate for a starburst (Bell & de Jong 2001). | L20cm | q(g)(g)q . |
|---|---|---|---|---|---|---|---|
| [LE850] | ( 1011 L⊙,K ) | ( 1037 W ) | ( 1011 M⊙ ) | ( 1024 W Hz-1 ) | |||
| 1 | 2.6 | cold | 4.0 1.0 | 1.4 0.3 | 1.2 0.3 | 3.1 0.7 | 0.42 0.10 |
| 4 | 2.6 | cold | 3.8 1.0 | 1.3 0.3 | 1.1 0.3 | 1.3 0.3 | 0.68 0.51 |
| 7 | 1.8 | cold | 12.2 4.7 | 4.2 1.5 | 3.7 1.4 | 2.0 0.8 | 0.36 0.07 |
| 8a | 1.0 | cold | 5.0 3.5 | 1.8 1.0 | 1.5 1.1 | 1.2 0.7 | 1.73 0.24 |
| 8b | 3.0 | warm | 53.2 12.5 | 18.4 4.3 | 16. | 4.1 1.0 | 0.69 0.14 |
| 8c | 0.9 | cold | 1.4 0.6 | 0.6 0.3 | 0.4 0.2 | 0.3 | 0.81 |
| 14a | 2.4 | cold | 6.7 2.0 | 2.3 0.7 | 2.0 0.6 | 0.7 0.3 | 0.36 0.24 |
| 14b | 2.5 | cold | 6.9 1.8 | 2.4 0.7 | 2.1 0.5 | 1.6 0.6 | 0.36 0.15 |
| 18 | 2.7 | warm | 11.4 3.0 | 3.9 1.0 | 3.4 | 1.1 0.3 | 0.42 0.16 |
| 35 | 3.0 | cold | 20.3 4.8 | 7.0 1.7 | 6.1 1.4 | 2.8 0.7 | 0.44 0.13 |