Multi-rate asynchronous sampling of bandwidth-limited signals
Abstract
We demonstrate experimentally an optical system for under-sampling several bandwidth limited signals with carrier frequencies that are not known apriori that can be located anywhere within a very broad frequency region between 0-18 GHz. The system is based on under-sampling asynchronously at three different sampling rates. The pulses required for the under-sampling are generated by a combination of an electrical comb generator and an electro-absorption modulator. To reduce loss and improve performance the implementation of the optical system is based on a wavelength division multiplexing technique. An accurate reconstruction of both the phase and the amplitude of the signals was obtained when two chirped signals generated simultaneously were sampled.
I Introduction
In many applications of radars and communications systems it is desirable to reconstruct a multi-band sparse signal from its samples. Such a signal is composed of several narrow-band signals with different carrier frequencies that are transmitted simultaneously. When the carrier frequencies of the signals are high compared to the bandwidths of the signals, it is not cost effective and often it is not feasible to sample at the assumed Nyquist rate that is approximately equal to twice the maximum carrier frequency of the signals. It is therefore desirable to reconstruct the signals by under-sampling; that is to say, from samples taken at rates lower than the Nyquist rate.
There is a vast literature on theoretical methods to reconstruct signals from under-sampled data [3, 4, 5, 6, 7, 8, 9]. Most methods are based on a periodic nonuniform sampling (PNS) scheme. In a PNS scheme low-rate cosets are chosen out of cosets of samples obtained from time-uniformly distributed samples taken at a rate where is greater or equal to an assumed Nyquist rate [4]. The sampling rate of each sampling channel is thus times lower than and the overall sampling rate is where .
In a previous work we have demonstrated theoretically a different theoretical scheme for reconstructing sparse multi-band signals which we call multi-rate sampling (MRS)[10]. The scheme entails gathering samples at different rates. The number is small and does not depend on the characteristics of a signal.
The approach is not intended to obtain the total minimum sampling rate. Rather, it is intended to reconstruct signals accurately with a very high probability at an overall sampling rate significantly lower than the assumed Nyquist rate under the constraint of a small number of channels.
The reconstruction method in Ref. [10] does not rely on synchronization of different sampling channels. This significantly reduces hardware requirements. Moreover, unsynchronized sampling relaxes the stringent requirement in PNS schemes of a very small timing jitter in the sampling time of the channels. Simulations indicate that asynchronous multi-rate sampling reconstruction is robust both to different signal types and to relatively high noise. A very high reconstruction probability was obtained ( %) amongst real signals comprised of four real signals in which the bandwidth of each signal was about 100 MHz, and in which the carrier frequencies of the signals were randomly chosen in the region 0-20 GHz. In each simulation the signal was sampled with three sampling channels that operated at 3.8 GHz, 3.9 GHz, and 4 GHz.
The bandwidth of electronic systems is small compared to the bandwidth available to analog optical systems. Therefore, with electronic systems, when sampling a signal whose carrier frequencies can be located in a large frequency region, the spectrum is divided into small frequency bands. Each band is down-converted and sampled by a different electronic subsystem. As a result, the size, the weight and the complexity of electronic systems limit their applications.
Optical systems are capable of very high performance under-sampling [1]. The carrier frequency of the input signal can be very high on the order of 20 GHz and the dynamic range of the signals can be as high as 70 dB. The size, weight, and power consumption of optical systems make them ideal for under-sampling. The under-sampling operation is based on shifting the entire spectrum to a low frequency region called the baseband [1],[11]. The down-converted signal is then sampled using a electronic analog to digital (A/D) converter with a bandwidth that is significantly narrower than the carrier frequency of the signal. A previous work [1] has demonstrated the under-sampling and reconstruction of a single narrow-band signal. However, the system required apriori knowledge of the carrier frequency of the signal and this knowledge was used to determine the sampling rate.
In this paper we demonstrate experimentally the sampling and reconstruction of two chirped signals that are generated at the same time. The carrier frequencies of the signals was unknown apriori. The sampling system entails under-sampling the signals asynchronously at three different rates. The pulses required for under-sampling are generated by a combination of an electrical comb generator and an electro-absorption (EA) modulator. Such an optical pulsed source is simple, small, and consumes low power. Moreover, the source is robust to changes in environmental conditions. The combination of the comb generator and the EA modulator that are used instead of two electro-absorption modulators that were used in Ref. [1] results in an increase in the output power of the pulse train by about 10 dB. The simultaneous sampling at different rates is performed efficiently by using methods based on a wavelength-division multiplexing (WDM) technique that is used in optical communication systems. Such a technique avoids loss caused by splitting of the signal between the sampling channels. This technique also enables use of the same electro-optic modulator for modulating all the sampling channels. Consequently, the frequency dependence of the modulator response curve has the same effect on all sampling channels. We have demonstrated experimentally an accurate reconstruction of two chirped signals, generated simultaneously, each with a width of about 150 MHz. The carrier frequencies of the signals were not known apriori but were assumed to be within a frequency region of 0-18 GHz. The spurious free dynamic range of the system was 87 dB-Hz2/3.
II Experimental setup
II-A System description
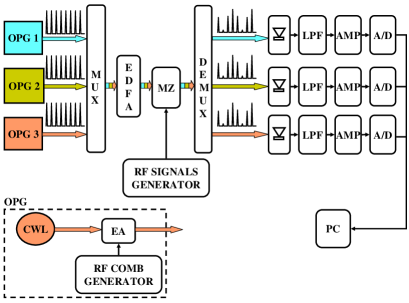
The experimental setup of the system is shown in Fig. 1. The spectrum of the signals was down-converted to a low frequency region, called baseband, by modulating the amplitude of a train of short optical pulses by the signal [1]. Since the reconstruction algorithm requires sampling the signal at three different rates, the down-conversion of the signal was performed separately using three optical pulsed sources that operate at different rates. The wavelengths of the optical pulsed sources were chosen to be different: 1535.04 nm, 1536.61 nm, and 1544.53 nm. Hence, the three optical pulse sources could be added by using an optical multiplexer (MUX) and then be modulated by a single LiNbO3 modulator (MZ). The bandwidth of the modulator used was 40 GHz. The use of a single modulator reduces the sensitivity of the system to the frequency response function of the modulator and simplifies the system design. Since the modulator response is sensitive to its input polarization we used polarization maintaining (PM) fibers in all of the optical components that were connected before the input end of the modulator. In our experiments we lacked suitable optical multiplexer with PM fibers. Instead, we used two PM couplers to multiplex the three optical signals. This added an additional loss of about 6 dB that can be avoided using a PM multiplexer. The optical losses due to the electro-absorbtion modulator, the electro-optical modulators, the multiplexer and the de-multiplexer, were about 10 dB, 7 dB, 1.5 dB, and 1.5 dB, respectively. To compensate for these losses we used an erbium doped fiber amplifier (EDFA) with a 30 dB gain. After passing through the modulator, the optical wave passed through a demultiplexer that splits the optical signal into three pulse trains of different rates with an amplitude modulated according to the RF signal. Each of the three modulated pulse trains was detected by an optical detector connected to a transimpedance amplifier. The input optical power at the entrance of the detectors was about -4 dBm. The output of the transimpedance amplifiers was then passed through low-pass filters with a cutoff frequency of 2.2 GHz, amplified once again by electrical amplifiers with a gain of 20 dB, and sampled by three electronic analog to digital (A/D) converters. Each of the A/D converters sampled at a rate of 4 Gsamples/sec with 5 effective bits. In each sampling the number of sampled points in each channel was equal to 32,767.
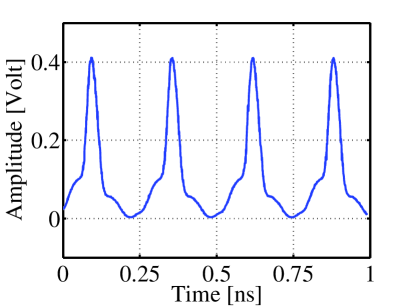
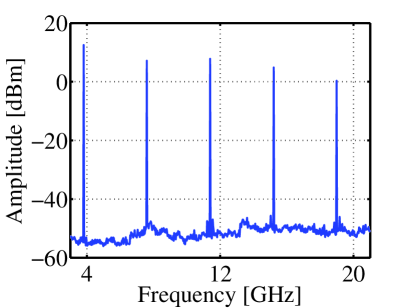
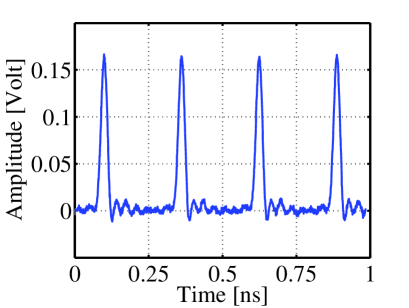
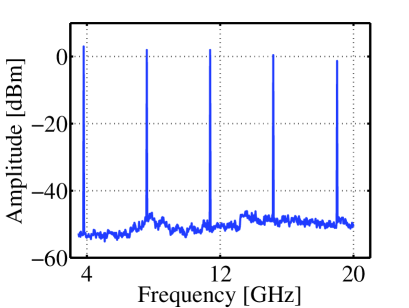
Each pulsed source was implemented by a combination of an EA modulator and a comb generator. The comb generator is based on using a step-recovery diode (SRD) and is used to generate short electrical pulses from a sinusoidal electrical wave. Figure 2 shows the electrical pulse train at the output of the comb generator. The train is measured by a sampling oscilloscope and by an RF spectrum analyzer. The measurement shows the existence of strong ripples between the pulses. Moreover, the difference between the harmonics at 3.8 GHz and 19 GHz is 12.3 dB. In Ref. [1] it has been shown that the bandwidth of the system is limited by the bandwidth of the RF spectrum of the optical pulses. Consequently, the pulse train at the output of the comb generator cannot meet the requirement of sampling signals whose carrier frequency may be as high as 18 GHz. To rectify this, we connected the output of the comb generator to the RF input port of an EA modulator with a bandwidth of 40 GHz. The optical input to the modulator was a continuous wave (CW) laser with a power of 11.5 dBm. The nonlinearity of the modulator enabled a shortening of the optical pulse duration as well as a reduction in the intensity of ripples between pulses. Such improvement in the pulses is essential for high performance and high bandwidth sampling. Figure 3 shows the optical pulses at the output of the EA modulator after conversion to an electric signal by an optical detector with a bandwidth of 40 GHz and measured by an RF spectrum analyzer and a sampling oscilloscope. The pulse duration obtained was about 26 ps. The difference between the RF harmonics at 3.8 GHz and the harmonics at 19 GHz was only 4.3 dB. The average power of each pulse train was about -11 dBm. The repetition rate of the pulses can be controlled easily by changing the frequency of the sinusoidal wave at the input of the comb generator. Using a comb generator and an EA modulator instead of two EA modulators as were used in Ref. [1] enables a reduction in the loss in the pulse source by about 10 dB. We note that the three optical pulse generators in our system were uncorrelated in time.
II-B Principle of operation
The under-sampling is performed in two steps. In the first step the entire signal spectrum is down-converted to a low frequency region called baseband by modulating the amplitude of an optical pulse train by the RF signal. In the second step the down-converted optical signal is transformed into an electronic signal that is then sampled by a bandwidth limited electronic A/D converter. The bandwidth of the electronic A/D converter is significantly narrower than the maximum carrier frequency of the signals. The optical under-sampling is performed at three different rates. The repetition rate of the optical pulse train in each of the channels is chosen to be different and should be lower than the sampling rate of the A/D converters to avoid additional aliasing. Sampling at high rates has a fundamental advantage when applied to signals contaminated by noise. The spectrum evaluated at a baseband frequency in a channel that samples at a rate is the sum of the spectrum of the original signal at all frequencies that are located in the overall system operational bandwidth, where is an integer [10]. Thus, the larger the value of , the fewer terms contribute to this sum. As a result, sampling at a higher rate lowers the noise contribution and hence increases the signal to noise ratio in the baseband. Moreover, our reconstruction method that is described in Ref. [10] enables a significant reduction in the required number of sampling channels when the sampling rate of each channel is increased. The sampling rates that were used in our experiments were 3.8 GHz, 3.9 GHz, and 4 GHz.
We denote the input wave spectrum at the RF input of the modulator by . The signal is sampled using an optical pulse train with a temporal pulse shape and a repetition rate . The current spectrum of the optical detector is proportional to[1]
| (1) |
where is the Fourier transforms of a single optical pulse . The spectrum at the output of each sampling channel contains replicas of the original spectrum shifted by an integer multiple of the repetition rate . The signal spectrum is therefore down-shifted to a baseband where it can be sampled using a conventional electronic A/D converter. Because the sampling rate of each sampling channel is different, the corresponding spectrum in the baseband of each channel is different.
A signal processing algorithm utilizes the information from the three sampling channels to reconstruct the signal [10]. The algorithm can correctly reconstruct the signal in almost all cases; even in the cases when aliasing deteriorates the spectrum in the baseband. The algorithm is based on extracting a spectrum that minimizes the least square error between the three down-converted spectra of the reconstructed signal and the spectra measured in the three sampling channels. The signal can be reconstructed accurately when each of the frequencies of the signal spectrum is unaliased at least in one of the sampling channels. Our simulations indicate that the multi-rate sampling scheme is robust both to different signal types and to relatively high noise.
II-C Experimental results
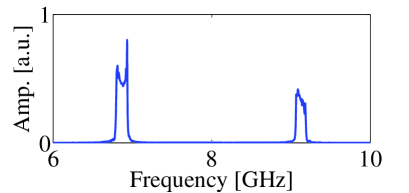
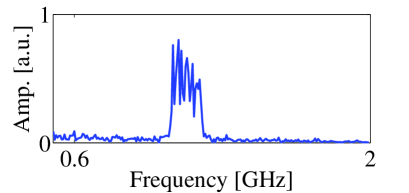
In our experiment we have demonstrated the sampling and the reconstruction of two chirped signals that are generated simultaneously. Figure 4 shows the spectrum of the input RF wave. The wave consisted of two chirped pulses with approximate square time profiles. The waves were generated using a voltage controlled oscillator (VCO). Because the change of the frequency of the VCO as a function of the input control voltage is not linear, the chirp obtained did not change linearly in time. The first signal had a central frequency of 6.87 GHz and a bandwidth of 150 MHz. The second signal had a carrier frequency of 9.13 GHz and a bandwidth of 133 MHz. The average RF power of the superposed signals was approximately -14 dBm. The two signals were generated simultaneously and therefore we have studied the worst case scenario where the two signals completely overlap on time. The duration of the combined pulse was 1.35 s. The repetition rate of the pulses was 2 kHz. We note that our simulation results indicate that the sampling system can be used to efficiently sample and reconstruct more than 4 chirped signals that are transmitted simultaneously [10]. However, our source that generated the input signals could only generate simultaneously two chirped signals.
Mathematically, since the signals in our experiments are real functions each real signal is composed of two bands. One band with a spectrum is located in the positive frequency region, and another band with a spectrum is located in the negative frequency region [10]. Therefore, mathematically, the signal spectrum in our system is composed of four frequency components. We note that due to sampling each two of the down-converted frequency components can overlap.
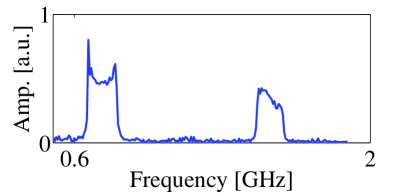
Figure 5 shows the spectra at the output of the three sampling channels. The spectra were calculated by performing a discrete Fourier transform on the digital samples from the outputs of the three A/D converters. We note that after down-converting the signal using a pulse train with a rate of the spectrum becomes periodic with a periodicity of . Moreover, since the signal is real the down-converted spectrum obeys: . Therefore, when sampling at a rate of , all the information about the down-converted signal is contained in the frequency region . Figure 5 shows that down-converting the signal at a rate of 4 GHz resulted in an interference in the spectrum at a frequency around 1.1 GHz due to aliasing effect. The aliasing was between the signal components at GHz and GHz.
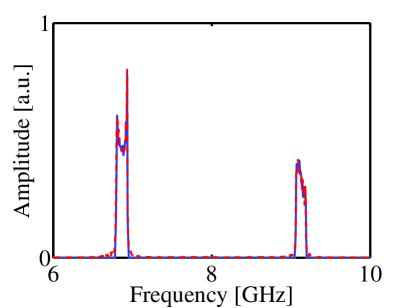
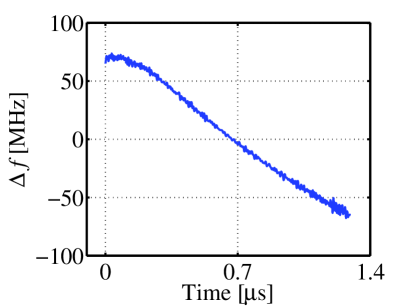
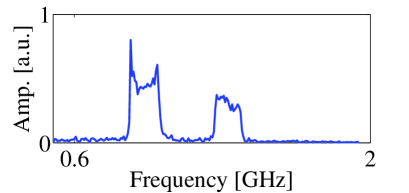
Figure 6 shows the amplitude of the Fourier transform of the reconstructed signal. The algorithm for reconstructing the signal from the three sampled down-converted signals is described in detail in Ref. [10]. For the comparison, the original spectrum as measured by the RF spectrum analyzer was added to the figure. The comparison between the original and the reconstructed signal as shown in Fig. 6 shows an excellent quantitative agreement between the spectrum measured using the analog RF spectrum analyzer and the reconstructed spectrum. An accurate reconstruction was obtained despite aliasing at the channel corresponding to a sampling rate of 4 Ghz. Since the measurement of the RF spectrum analyzer is based on a slow frequency scan, measuring the whole spectrum requires many RF pulses. Our system requires only a single RF pulse for measuring the entire spectrum and hence it can be used in real-time applications. Our system also allows a measurement of the phase of the input RF signal. This important information can not be obtained using the RF spectrum analyzer. Figure 7 shows the instantaneous frequency the time derivative of the phase of the reconstructed signal centered around the frequency GHz. The instantaneous frequency changes in a frequency region of about 142 MHz. This result is in good quantitative agreement with the measured overall signal bandwidth of about 150 MHz. An accurate reconstruction of two signals was obtained in all of our experiments when the carrier frequencies of the two signals were chosen randomly from the frequency region 3-11 GHz. This frequency region was imposed by the bandwidth of our RF sources that were used to generate the signals, and not due to the limitations of the sampling system. We note that in our reconstruction algorithm we assumed that the system bandwidth was 0-20 GHz.
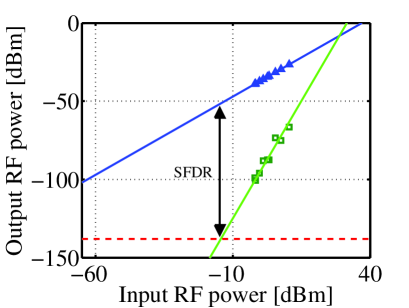
Figure 8 summarizes the measurement of the the spurious free dynamic range of the system. In this measurement the electro–optical modulator was driven by two continuous wave (CW) RF signals of the same power at adjacent frequencies of 6.197 GHz and 6.198 GHz. The power of the two CW electrical signals was gradually changed between -2 dBm and 10.5 dBm. For every value of the input power, the power of the third order products at frequencies 6.196 and 6.199 GHz was measured at the output of each of the three photo-detectors. The obtained spurious free dynamic range of each of the channels was about 87 dB-Hz2/3. We believe that by using narrow optical filters as well as optical multiplexer instead of couplers we will be able to reduce significantly the noise in the system.
The bandwidth of the system was measured by scanning the frequency of a CW RF source that was connected to the system input. The power of the down-converted signal was measured as a function of input signal frequency. The 3-dB bandwidth was about 17.8 GHz. This result is in agreement with the bandwidth of RF spectrum of the optical pulses shown in Fig. 3 as expected by theory [1]. Therefore, shortening the optical pulses will increase the system bandwidth.
III Conclusion
We have demonstrated a new optical system for under-sampling sparse multi-band signals. Such signals are composed of several bandwidth limited signals. The carrier frequencies of the signals are not known apriori and can be located anywhere within a very broad frequency region (0-18 GHz). The system is based on under-sampling asynchronously the signals at three different rates. The under-sampling is performed by down-converting all of the signal spectra to a low frequency region called the baseband. The baseband is then sampled using electronic analog-to-digital converters with a bandwidth that is significantly narrower than the maximum carrier frequency of the input signals. By separating the frequency down-conversion and the analog to digital conversion operations it becomes possible to use a single frequency resolution that is common to all of the sampling channels. This facilitates a robust reconstruction algorithm that is used to detect and reconstruct the phase and the amplitude of the signals. The reconstruction method does not rely on synchronization between different sampling channels. This significantly reduces hardware requirements. Because the entire frequency region of the signal is down-converted to a baseband, aliasing may cause a deterioration in the down-converted spectrum. However, when the sum of the signals forms a sparse wave, a very high theoretical successful reconstruction percentage ( ) can be obtained using our reconstruction algorithm. Our system uses standard optical components that are used in optical communication systems. The optical system is robust against changes in environmental conditions. It is a turn-key system that does not require any adjustments prior to the start of its operation. The weight, power consumption, dynamic range, and bandwidth of the optical system are significantly superior to those of electronic systems capable of meeting similar requirements. The performance of the reconstruction algorithm can be further enhanced by synchronizing the three sampling channels. With such a synchronization aliasing can often be resolved by solving a set of linear equations.
References
- [1] A. Zeitouny, A. Feldser, and M. Horowitz, “Optical sampling of narrowband microwave signals using pulses generated by electroabsorption modulators,” Opt. Comm., 256, pp. 248-255 (2005).
- [2] H. Landau, “Necessary density conditions for sampling and interpolation of certain entire functions,” Acta Math., 117, pp. 37 -52 (1967).
- [3] A. Kohlenberg, “Exact Interpolation of Band-limited Functions,” J. Appl. Phys., 24, pp. 1432–1436 (1953).
- [4] R. Venkantaramani and Y. Bresler, “Optimal sub-nyquist nonuniform sampling and reconstruction for multiband signals,” IEEE Trans. Signal Process., 49, pp. 2301–2313 (2001).
- [5] Y. M. Lu and M. N. Do, “A Theory for Sampling Signals from a union of Subspaces,” IEEE Trans. Signal Process., to be published.
- [6] M. Mishali and Y. Eldar, “Blind multi-band signal recostruction: compressed sensing for analog signals,” arXiv:0709.1563 (September 2007).
- [7] P. Feng and Y. Bresler, “Spectrum-blind minimum-rate sampling and reconstruction of multiband signals,” in Proc. IEEE Int. Conf. ASSP, Atlanta, GA, IEEE, MAY 1996.
- [8] Y. P. Lin and P. P. Vaidyanathan, “Periodically uniform sampling of bandpass signals,” IEEE Trans. Circuits Sys., 45, pp. 340–351 (1998).
- [9] C. Herley and W. Wong, “Minimum rate sampling and reconstruction of signals with arbitrary frequency support, IEEE Trans. Inform. Theory, 45, pp. 1555–1564 (1999).
- [10] A. Rosenthal, A. LInden, and M. Horowitz, “Multi-rate asynchronous sampling of multiband signals,” submitted to J. Opt. Soc. Am. B.
- [11] P. W. Joudawlkis, J. J. Hargreaves, R. D. Younger, G. W. Titi, J. C. Twichell, “Optical Down-Sampling of Wide-Band Microwave Signals,” J. of Lightwave Technol., 21, pp. 3116–3124, 2004.
| Yuval P. Shapira was born in Russia, in 1980. He has received his B.Sc. degree (2006) and his M.Sc. degree (2008), summa-cum-laude, from the Technion - Israel Institute of Technology. He is currently working towards his Ph.D. degree in electrical engineering, at the Technion. His research interests include fiber optics and non-linear effects in fiber Bragg gratings. |