Large Scale Impact of the Cosmological Population of Expanding Radio Galaxies
Abstract
We seek to compute the fraction of the volume of the Universe filled by expanding cocoons of the cosmological population of radio galaxies over the Hubble time as well as the magnetic field infused by them, in order to assess their importance in the cosmic evolution of the Universe. Using N-body CDM simulations, radio galaxies distributed according to the observed radio luminosity function are allowed to evolve in a cosmological volume as using well defined prescriptions for their expansion. We find that the radio galaxies permeate of the total volume with G magnetic field by the present epoch.
Subject headings:
cosmology: miscellaneous — galaxies: active — galaxies: jets — methods: N-body simulations1. Introduction
Radio galaxies (RGs) are believed to have significant impact on the formation and evolution of large scale structures in the Universe. The cosmological population of expanding RGs and quasars can permeate large volumes of the intergalactic medium (IGM) and hence impact a considerable fraction of the filamentary protogalactic structures and could contribute substantially toward magnetization and metal enrichment of the Universe (e.g., Gopal-Krishna & Wiita, 2001; Kronberg et al., 2001; Furlanetto & Loeb, 2001; Barai et al., 2004; Gopal-Krishna et al., 2004; Levine & Gnedin, 2005).
The expansion of shocked and overpressured radio cocoons in a two-phase IGM are argued to compress the cold clouds and trigger star (perhaps even dwarf galaxy) formation (De Young, 1989; Rees, 1989; Daly, 1990; Chokshi, 1997; Natarajan et al., 1998; van Breugel et al., 2004; Silk, 2005), as supported by recent observations of jet-induced star formation (e.g., Dopita et al., 2007; Reuland et al., 2007). At the same time, some works indicate that RG expansion inhibits star formation by expelling (and heating) the IGM gas (e.g., Rawlings & Jarvis, 2004; Schawinski et al., 2006; Fujita, 2008). Other studies (e.g., Nath & Roychowdhury, 2002; Vernaleo & Reynolds, 2007; McNamara & Nulsen, 2007) reveal that the RGs heat up the ICM in galaxy clusters.
A key step to quantify the large scale impact RGs have is to address the question that how much of the volume of the Universe do the cosmological population of radio cocoons occupy over the Hubble time, which we seek to answer in the present work.
From rough calculations, Gopal-Krishna & Wiita (2001) argued that the expanding lobes of the generations of RGs can pervade up to 0.5 of the WHIM (warm/hot intergalactic medium) component in the Universe over . Barai & Wiita (2006) performed Monte Carlo simulations to construct virtual radio surveys (Blundell et al., 1999; Wang & Kaiser, 2008), and Barai & Wiita (2007) estimated the cumulative volume filling factor to be . These results were expressed as a fraction of the WHIM volume, adopted from the numerical simulations of Cen & Ostriker (1999).
In this work we perform self-consistent cosmological simulations to compute the fractional volume of the Universe occupied by RGs, a more rigorous approach than previous attempts. Finding such volume filling fractions is important to probe in more detail the cosmological impact of RGs. We also perform preliminary estimates of the magnetic field infused in the filled volumes. The simulation method and model are described in §2, and the results and discussion are in §3.
2. The Model
2.1. N-body Cosmological Simulation
We perform N-body simulations of a CDM Universe, where a cubic cosmological box with comoving size Mpc on a side, having triply periodic boundary conditions and expanding with the Hubble flow, is evolved from =25 up to =0. The (particle-particle/particle-mesh) code (Hockney & Eastwood, 1981) is used with dark matter particles on a grid. So a particle has a mass of , and the gravitational softening comoving length is of the cell size or Mpc. The cosmological parameters are: present matter density parameter, , baryon density parameter, , cosmological constant, , Hubble constant, (), primordial tilt, , and CMB temperature, K, consistent with the results of WMAP3 (Spergel et al., 2007).
The baryonic gas distribution is assumed to follow the dark matter in the N-body simulation. The ambient gas density, , is obtained from the (matter) density, , using . The external pressure is then (e.g., Pieri et al., 2007), . The external temperature is fixed at K assuming a photoheated ambient medium, and amu is the mean molecular mass. The RGs are distributed in the cosmological volume as given in §2.2. They are then allowed to evolve according to the prescription in §2.3. Hence the volume of the cosmological box filled by the expanding RGs is computed.
2.2. Initial Source Distribution
The cosmological redshift () and luminosity () distribution of RGs is quantified by the radio luminosity function (RLF), which gives the number of sources per unit comoving volume per unit of luminosity. We adopt the RLF computed by Willott et al. (2001), modeling it as a combination of two populations: . The low- population has a number density
| (1) |
where, for , and for . The number density for the high- population is
| (2) |
where, for , and for . We adopt their model C for the redshift evolution, since that is most general with different Gaussian widths at low and high ’s. The best-fit parameter values for and are: , , , , , , , , , , .
We convert the RLF to the current consensus cosmology (§2.1) using the relation from Peacock (1985) relating the RLF in two cosmologies, . Then
| (3) |
gives the number of RGs within the simulation box of comoving volume at epoch in the interval . Sources are generated within radio luminosities .
The radio luminosity is converted to the constant kinetic power transported by a jet, , using the recent result of Koerding et al. (2008), .
Using the RLF and an assumed active source lifetime, , we obtain the entire cosmological population of RGs in the simulation box starting from , namely the birth redshift (), switch-off redshift () and of each source. We implement 3 different values of : 10 Myr produces 312340 sources, 100 Myr produces 49282 sources, and 500 Myr produces 12807 sources.
We also consider the possibility that the RG lifetime is inversely proportional to the jet power, (Daly & Guerra, 2002; Daly et al., 2007), where the constant is found assuming a lifetime of 500 Myr at erg/s. This variable case produced 47179 sources.
At each timestep of the simulation, we spatially locate the new RGs born during that epoch (whose values fall within the timestep interval) in the high-density regions of the cosmological volume. We filter the density inside the box such that the RGs are spatially located in regions which would collapse to form halos of mass . We consider the mesh cells that have a filtered density the mean density of the box, and each new RG is located at the center of one such dense cell, selected randomly.
2.3. Radio Galaxy Evolution
After being born, a RG evolves through an active-AGN phase (§2.3.1, when ), and then goes through a post-AGN phase (§2.3.2, when ). At each timestep the total volume occupied by the RGs is computed by counting the contributions of all the sources born by then, both the active ones and those in the post-AGN phase. This gives the redshift evolution of the total RG volume in the simulation box.
2.3.1 Active-AGN Phase
In a RG when the AGN is active, relativistic plasma flows down a pair of jets, each of length , collides with the external environment at the terminal hotspots and then flows back to inflate the huge radio cocoon of energetic particles. According to the standard scenario (e.g., Begelman & Cioffi, 1989), the cocoon pressure is much larger than the ambient gas pressure. The advance speed of the jet head is obtained by balancing the jet momentum flux with the ram pressure of the ambient medium,
| (4) |
Here is the area of the shocked “working” surface at the end of the cocoon (larger than the instantaneous cross section area of the jet) and is the external density. We use assuming that the shock front has a constant half-opening angle of relative to the central AGN (Furlanetto & Loeb, 2001).
Since is short compared to the Hubble time, energy losses and Hubble expansion are neglected in this phase. All the kinetic energy transported along the jets during a RG’s age is transferred to the cocoon, whose energy is , and . The adiabatic index of the cocoon’s plasma, as it is taken to be relativistic. A shock is driven sideways into the ambient medium at a speed , following .
The RG expands self-similarly during this phase (Falle, 1991; Kaiser & Alexander, 1997) and we approximate it’s shape as cylindrical with length and radius . The two equations of motion are: for advance along the jet, and perpendicular to the jet. We solve for and using a 4th-order Runge-Kutta integration method. The RG volume during this self-similar expansion is then .
If , or, , the RG loses its self-similarity and ceases to have a cylindrical expansion (Begelman & Cioffi, 1989). It then becomes spherical in shape, and the Sedov-Taylor blast wave model describing the adiabatic expansion of a hot plasma sphere into a cold medium can be used to obtain its radius (Castor et al., 1975; Scannapieco & Oh, 2004; Levine & Gnedin, 2005),
| (5) |
We obtain by averaging the gas density of the mesh cells in the simulation box occurring within the cocoon spherical volume. For a strong explosion in the ambient gas, (Keilty et al., 2000). Then the RG volume is .
2.3.2 Post-AGN Phase
When the AGN activity ends, the cocoon self-similarity is lost and we consider that the RG attains a spherical shape, if it had already not done so in the active phase. The pressure inside the cocoon causes the RG to continue expanding as long as it is overpressured (Kronberg et al., 2001; Reynolds et al., 2002). This overpressured cocoon expansion occurs analogous to a spherical adiabatic stellar wind bubble, with the radius evolving as in Eq. (5). Here the total kinetic energy injected into the cocoon by the AGN throughout the active RG lifetime is .
The RG is considered to undergo adiabatic expansion losses, and the cocoon pressure evolves as constant, with the constant derived from the pressure and size it had at the end of the active phase. The RG follows a spherical expansion as long as its pressure exceeds the external pressure, i.e., , and in this late expansion phase, .
When , or, the cocoon has reached pressure equilibrium with the external medium, the RG has no further intrinsic expansion. After this point, the cocoon simply evolves passively with the Hubble flow of the cosmological volume. Thus a RG in pressure equilibrium attains a final volume of , where is the final comoving radius of the cocoon.
3. Results and Discussion
Figure 1 shows the redshift evolution of two single RGs in the simulation; here we discuss only the one with Myr (red curves). At the end of the active phase () its cocoon is overpressured by a factor of . So it continues to expand while its pressure falls faster because of adiabatic losses. Finally when falls to a level to match the external pressure it does not expand anymore. From its comoving radius remains constant at Mpc in the passive Hubble phase.
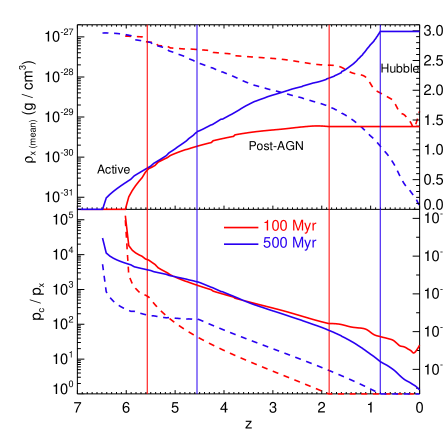
This illustrates that the radio cocoons are persistently overpressured for a substantial period of time even after the AGN has stopped activity, and hence continue to expand into the ambient medium. In Figure 1, after a active life of Myr, the RG remains overpressured for Myr. Such results are in accord with other studies (e.g., Yamada et al., 1999; Kronberg et al., 2001). In our simulations (depending on the active lifetime) of the sources became spherical in shape during the active-AGN phase.
In order to prevent overcounting of the volume due to overlap of RGs, we count the mesh cells in the simulation box which occur inside the volume of one or more RG cocoons. The total number of these filled cells, , give the total volume of the box occupied by RGs. We express the total volume filled as a fraction of volumes of various overdensities in the box, , where is the mean matter density of a spatially flat Universe (the box) at an epoch . So gives the number of cells which are at a density times the mean density. We find for ; gives the total volume of the box, since then is the total number of cells in the box.
Figure 2 shows the redshift evolution of the volume filling factors for different active lifetimes. By the present epoch, of the entire Universe is filled by RGs of active lifetime Myr, the fraction going up to for 100 Myr, and for 500 Myr. With or Myr, RGs fill up all of the the overdense regions (, or higher) by . With Myr, RGs always fill up regions with or higher at all epochs. The case with fills up of the Universe by , and give volume filling fractions similar to the values with a constant lifetime of 100 Myr.
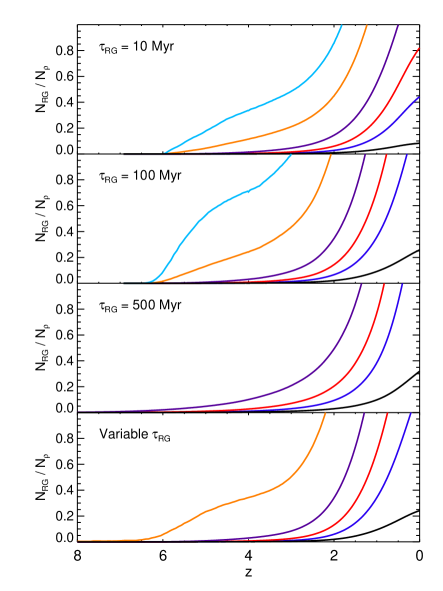
It is the overdense cosmic regions which gravitationally collapse to form stars and galaxies. So evidently the RGs have a profound impact on the protogalactic regions of the Universe. The precise effect on star formation is still open to debate (§1), with possible RG influence on both triggering and suppressing star formation in different regions of the Universe depending on the exact ambient conditions.
Our volume filling factors of are between the values that Gopal-Krishna & Wiita (2001) () and Barai & Wiita (2007) () obtained as a fraction of the volume of the WHIM component of the Universe. Our results, based on self-consistent cosmological simulations, give a more reliable estimate of the fractional volume of the Universe occupied by RGs. The volumes obtained by Levine & Gnedin (2005) (100% filling by ) are much higher, since they consider the whole AGN population.
We perform preliminary estimates of the energy density and magnetic field in the volumes of the Universe filled by radio cocoons. The cocoon energy density behaves similar to the cocoon pressure evolving adiabatically (§2.3.2) . Assuming equipartition of energy between magnetic field of strength and relativistic particles inside the cocoon, the magnetic energy density is . The mean thermal energy density of the ambient medium inside the RG volume is . We define the volume weighted average of a physical quantity as , where the summation is over all RGs existing in the simulation box at that epoch.
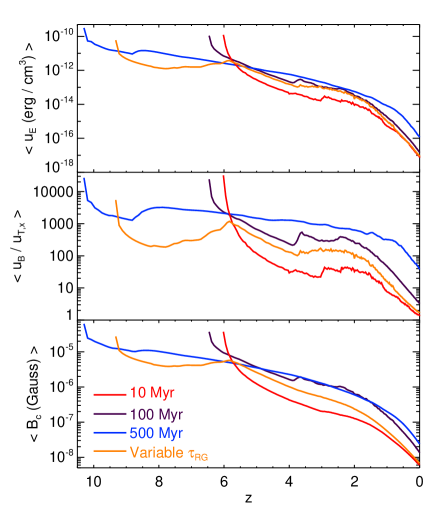
Figure 3 shows the redshift evolution of , and . The energy densities and magnetic field decrease with redshift as the filled volumes get bigger. The ratio , giving the importance of cocoon magnetic energy over external thermal energy, has a trend similar to that deduced by Furlanetto & Loeb (2001). We find that, by the present, is comparable to or greater by factors of few, implying that substantial magnetic energies are infused into the IGM by the expanding radio cocoons. At , a magnetic field of G permeates the filled volumes, consistent with the results of Gopal-Krishna & Wiita (2001) and Ryu et al. (1998). At a given redshift, the energy density and magnetic field are larger for higher source lifetimes. The results for are intermediate between those of 10 and 100 Myr.
We conclude that using our N-body cosmological simulations, the expanding population of RGs pervade of the volume of the Universe by the present, and occupy of the overdense regions by . A magnetic field of G is infused in the filled volumes at .
References
- Barai et al. (2004) Barai, P., Gopal-Krishna, Osterman, M. A. & Wiita, P. J. 2004, BASI, 32, 385
- Barai & Wiita (2006) Barai, P. & Wiita, P. J. 2006, MNRAS, 372, 381
- Barai & Wiita (2007) Barai, P. & Wiita, P. J. 2007, ApJ, 658, 217
- Begelman & Cioffi (1989) Begelman, M. C. & Cioffi, D. F. 1989, ApJ, 345, L21
- Blundell et al. (1999) Blundell, K. M., Rawlings, S. & Willott, C. J. 1999, AJ, 117, 677
- Castor et al. (1975) Castor, J., McCray, R. & Weaver, R. 1975, ApJ, 200, L107
- Cen & Ostriker (1999) Cen, R. & Ostriker, J. P. 1999, ApJ, 514, 1
- Chokshi (1997) Chokshi, A. 1997, ApJ, 491, 78
- Daly (1990) Daly, R. A. 1990, ApJ, 355, 416
- Daly & Guerra (2002) Daly, R. A. & Guerra, E. J. 2002, AJ, 124, 1831
- Daly et al. (2007) Daly, R. A. et al. 2007, arXiv: 0710.5112
- De Young (1989) De Young, D. S. 1989, ApJ, 342, L59
- Dopita et al. (2007) Dopita, M. A. et al. 2007, Ap&SS, 311, 305
- Falle (1991) Falle, S. A. E. G. 1991, MNRAS, 250, 581
- Fujita (2008) Fujita, Y. 2008, MNRAS, 384, L41
- Furlanetto & Loeb (2001) Furlanetto, S. R. & Loeb, A. 2001, ApJ, 556, 619
- Gopal-Krishna & Wiita (2001) Gopal-Krishna & Wiita, P. J. 2001, ApJ, 560, L115
- Gopal-Krishna et al. (2004) Gopal-Krishna, Wiita, P. J. & Barai, P. 2004, JKAS, 37, 517
- Hockney & Eastwood (1981) Hockney, R. W. & Eastwood, J. W. 1981, Computer Simulation Using Particles (New York: McGraw-Hill)
- Kaiser & Alexander (1997) Kaiser, C. R. & Alexander, P. 1997, MNRAS, 286, 215
- Keilty et al. (2000) Keilty, K., Liang, E., Remington, B., London, R., Estabrook, K. & Kane, J. 2000, ApJS, 127, 375
- Koerding et al. (2008) Koerding, E. G., Jester, S. & Fender, R. 2008, MNRAS, 383, 277
- Kronberg et al. (2001) Kronberg, P. P., Dufton, Q. W., Li, H. & Colgate, S. A. 2001, ApJ, 560, 178
- Levine & Gnedin (2005) Levine, R. & Gnedin, N. Y. 2005, ApJ, 632, 727
- McNamara & Nulsen (2007) McNamara, B. R. & Nulsen, P. E. J. 2007, ARA&A, 45, 117
- Natarajan et al. (1998) Natarajan, P., Sigurdsson, S. & Silk, J. 1998, MNRAS, 298, 577
- Nath & Roychowdhury (2002) Nath, B. B. & Roychowdhury, S. 2002, MNRAS, 333, 145
- Peacock (1985) Peacock, J. A. 1985, MNRAS, 217, 601
- Pieri et al. (2007) Pieri, M. M., Martel, H. & Grenon, C. 2007, ApJ, 658, 36
- Rawlings & Jarvis (2004) Rawlings, S. & Jarvis, M. J. 2004, MNRAS, 355, L9
- Rees (1989) Rees, M. J. 1989, MNRAS, 239, 1P
- Reuland et al. (2007) Reuland, M. et al. 2007, AJ, 133, 2607
- Reynolds et al. (2002) Reynolds, C. S., Heinz, S., Begelman, M. C. 2002, MNRAS, 332, 271
- Ryu et al. (1998) Ryu, D., Kang, H. & Biermann, P. L. 1998, A&A, 335, 19
- Scannapieco & Oh (2004) Scannapieco, E. & Oh, S. P. 2004, ApJ, 608, 62
- Schawinski et al. (2006) Schawinski, K. et al. 2006, Natur, 442, 888
- Silk (2005) Silk, J. 2005, MNRAS, 364, 1337
- Spergel et al. (2007) Spergel, D. N. et al. 2007, ApJS, 170, 377
- van Breugel et al. (2004) van Breugel, W., Fragile, C., Croft, S., de Vries, W., Anninos, P. & Murray, S. 2004, IAUS, 222, 485
- Vernaleo & Reynolds (2007) Vernaleo, J. C. & Reynolds, C. S. 2007, ApJ, 671, 171
- Wang & Kaiser (2008) Wang, Y. & Kaiser, C. R. 2008, arXiv: 0805.4541
- Willott et al. (2001) Willott, C. J., Rawlings, S., Blundell, K. M., Lacy, M. & Eales, S. A. 2001, MNRAS, 322, 536
- Yamada et al. (1999) Yamada, M., Sugiyama, N. & Silk, J. 1999, ApJ, 522, 66