A 20 Year Radio Light Curve for the Young Supernova Remnant G1.9+0.3
Abstract
The radio source G1.9+0.3 has recently been identified as the youngest known Galactic supernova remnant, with a putative age of 100 years. We present a radio light curve for G1.9+0.3 based on 25 epochs of observation with the Molonglo Observatory Synthesis Telescope, spanning 20 years from 1988 to 2007. These observations are all at the same frequency (843 MHz) and comparable resolutions ( or ) and cover one fifth of the estimated lifetime of the supernova remnant. We find that the flux density has increased at a rate of per cent yr-1 over the last two decades, suggesting that G1.9+0.3 is undergoing a period of magnetic field amplification.
keywords:
ISM: individual (G1.90.3) — supernova remnants — supernovae general — stars:variables:other1 Introduction
The well known deficit of young supernova remnants (SNRs) in our Galaxy has motivated many searches for these objects (for example; Green & Gull, 1984; Gray, 1994a; Misanovic et al., 2002). Predictions based on extragalactic supernova (SN) rates suggest that there should be around 40 SNRs younger than 2000 years in our Galaxy (Cappellaro, 2003), and yet less than 10 have been identified (Green, 2004). The recent identification of G1.9+0.3 as a young SNR with age years by Reynolds et al. (2008) and Green et al. (2008), adds to this set, and makes it potentially the youngest known Galactic supernova remnant.
Most Galactic SNRs detected at radio wavelengths are detected well after the initial supernova event ( years). Cassiopeia A (SN 168119; Fesen et al., 2006) is the youngest SNR of known age, as years. The early stages of radio supernova (RSN) evolution have been studied in a number of bright extragalactic sources; detailed studies include, SN 1979C in M100 (Weiler et al., 1986), SN 1980K in NGC 6946 (Weiler et al., 1986, 1992), SN 1993J in NGC 3031 (Weiler et al., 2007) and SN 1987A in the Large Magellanic Cloud (Ball et al., 2001; Manchester et al., 2002). However, the oldest RSN of known age is SN 1923A (Eck et al., 1998), which leaves a critical gap in our knowledge of supernova evolution at intermediate ages of years. Hence the age estimate of years for G1.9+0.3 makes it a useful probe of this period in SNR evolution.
G1.9+0.3 was first identified as a potential young SNR based on its small angular size of 1.2′ (Green & Gull, 1984). Recent Chandra observations by Reynolds et al. (2008) showed that the remnant had expanded by per cent between earlier VLA observations in 1985 and the Chandra observations in 2007. This was confirmed by VLA follow-up observations by Green et al. (2008) which gave an expansion of per cent over 23 years (or an expansion rate of per cent yr-1). This led to an age estimate of years (or at most years) for G1.9+0.3. Green et al. (2008) also use archival data from a variety of instruments (over frequencies 332 to 5000 MHz) to suggest that G1.9+0.3 has brightened by a rate of per cent per year over the same period.
We present 20 years of radio observations from the Molonglo Observatory Synthesis Telescope (MOST; Mills, 1981; Robertson, 1991). These observations were carried out at constant frequency (843 MHz) and comparable resolutions ( or ). They show that G1.9+0.3 has been increasing in brightness by a rate of per cent yr-1 over this period. Our new estimate has the advantage that the measurements were taken with the same instrument, whereas the Green et al. (2008) estimate was based on observations from a range of instruments, compiled from the literature.
2 Observations and Data
The observations presented have been carried out over the last 20 years with the Molonglo Observatory Synthesis Telescope. The MOST operates at a central frequency of 843 MHz and has a restoring beam of where is the central declination of the field. Further technical specifications are in Bock et al. (1999).
G1.9+0.3 is detected in a total of 30 archival fields covering the period 1988 to 2007. These fields were observed as part of ongoing projects; the Molonglo Galactc Centre Survey (1985–1991; Gray, 1994b), the Molonglo Galactic Plane Survey (1983–1994; Green et al., 1999), the second epoch Molonglo Galactic Plane Survey (1996–2007; Murphy et al., 2007), and a Galactic centre monitoring program (2004–2007). Discarding five fields in which the data quality was poor, we have 25 observations of G1.9+0.3. The field of view for the early observations was , which increased to after the MOST was upgraded in 1995. The restoring beam is for the pre-1995 fields and for the post-1995 fields. Therefore the frequency and resolution were comparable for all of our observations, making this a self-consistent dataset covering approximately one fifth of the life of G1.9+0.3.
The MOST data are reduced using a custom process described by Bock et al. (1999). The phase and flux density calibration are done by observing a set of calibrator sources before and after each 12 hour observation. These calibrators are strong, unresolved sources taken from the list given in Campbell-Wilson & Hunstead (1994). Analysis of the calibrator sources by Gaensler & Hunstead (2000) showed the relative flux scale (as measured by the average scatter in repeat observations of the non-variable calibrators) to be accurate to around per cent. A similar analysis done by Murphy et al. (2007), found the scatter for non-calibrator sources observed by MOST to be around per cent.
The noise in individual MOST images is a combination of thermal noise and source confusion from both the main beam and sidelobes of the MOST. The noise level varies with Declination. Since the telescope is calibrated only at the beginning and end of each 12 hour run, there may be changes in the precise operational condition of the telescope electronics and feeds that have a small effect on the sensitivity of a given observation. The rms noise at the centre of a typical MOST image is mJy beam-1. However, most of the fields containing G1.9+0.3 have strong artefacts caused by the Galactic centre which is also in the field. Hence typical rms noise levels near the source are mJy beam-1.
3 Analysis
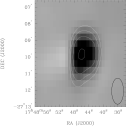
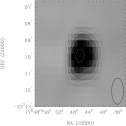
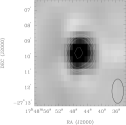
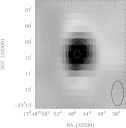
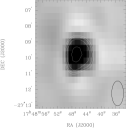
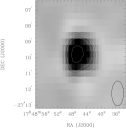
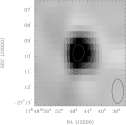
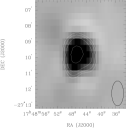
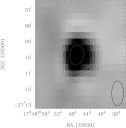
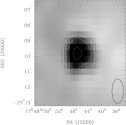
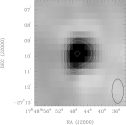
The MOST observations are not at high enough resolution to detect significant changes in the size or mophology of G1.9+0.3 with time. G1.9+0.3 is only slightly extended ( beams E–W) in the MOST images, as shown in Fig. 1 which shows a selection of our observed epochs. Fig. 2 shows a MOST epoch (from 2007/06/19) overlaid on the Green et al. (2008) VLA 4.8 GHz image (from 2008/03/12). When the VLA image is smoothed to the MOST resolution, there is good agreement in the observed morphologies. The rms noise in the 4.8 GHz image is mJy beam-1, and in the MOST image is mJy beam-1.
| 1988/07/06 | 1990/06/28 | 1997/06/26 | 1998/06/24 |
 |
 |
 |
 |
| 1999/06/08 | 2004/05/27 | 2004/08/22 | 2005/01/22 |
 |
 |
 |
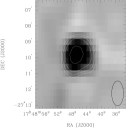 |
| 2005/10/22 | 2006/01/29 | 2006/10/07 | 2007/06/07 |
 |
 |
 |
 |
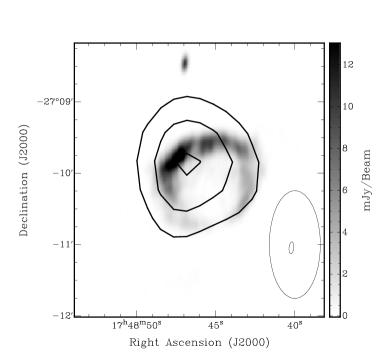
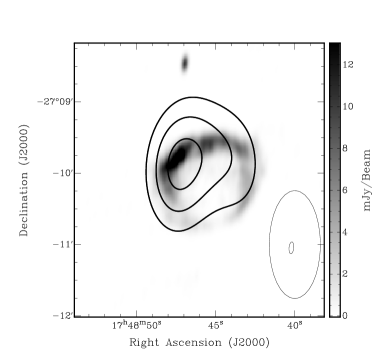
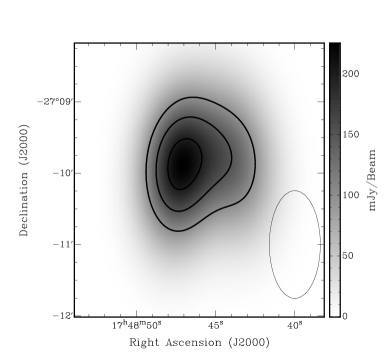
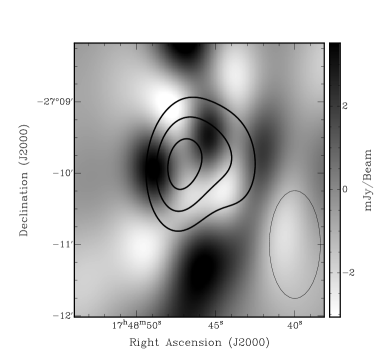
The integrated flux density of the source was measured by first fitting a two dimensional second order polynomial surface to the surrounding region and subtracting it, and then fitting a double elliptical Gaussian to the source itself. Fitting the background was necessary due to the large flux gradient in the image caused by the artefacts from the Galactic center. In most of the fields the source is sitting in a significant negative trough that could have negative flux values as large as mJy. Although the VLA observations show that morphology of the source is clearly a shell, at the MOST resolution it can be modelled reasonably well with a double elliptical Gaussian. This is demonstrated in the lower two panels of Fig. 2 which show a double Gaussian model, and the residuals after subtracting the model from the VLA image smoothed to the MOST resolution. In the MOST images, the residuals after fitting were around the per cent level, which we have included as a component of our overall error. The resulting light curve is shown in Fig. 3. Errors on each point are calculated by adding the estimated error in the flux density scale ( per cent), rms noise (calculated in region local to the source in each map, typically mJy beam-1 or per cent) and estimated fitting errors ( per cent) in quadrature.
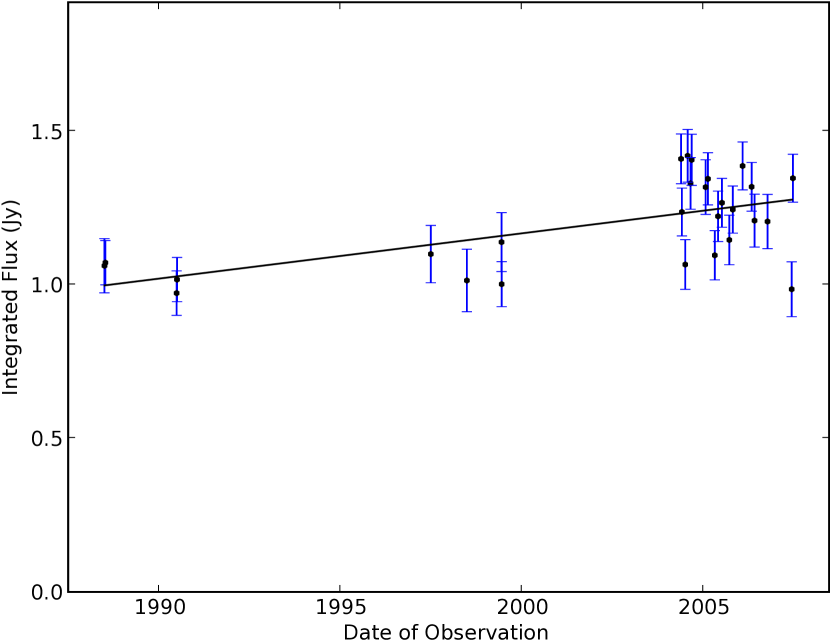
Fitting a power law () to the light curve resulted in an exponent of with large errors. A least squares fit of the light curve with a straight line gave a gradient of 0.015 Jy yr-1, with a reduced of 2.0 for 25 degrees of freedom. Since this does not allow an accurate estimate of our errors, we have performed a bootstrap analysis, as described by Efron (1982). For our analysis we selected random samples with replacement (‘bootstrap samples’) of our flux measurements and fit each sample to form a probability distribution of the resulting parameters. From this we measured a best-fitting gradient and per cent-confidence range of Jy yr-1. This analysis allows us to rule out a flat or decreasing flux density (a line with gradient ) with per cent confidence. We also constructed light curves for several field sources common to most of the epochs in our sample. There was no systematic change in flux density over this period of our observations. Comparison with our fitted flux value of 1.23 Jy on 2005/01/01 gives a percentage increase of per cent yr-1 with per cent-confidence range of per cent yr-1.
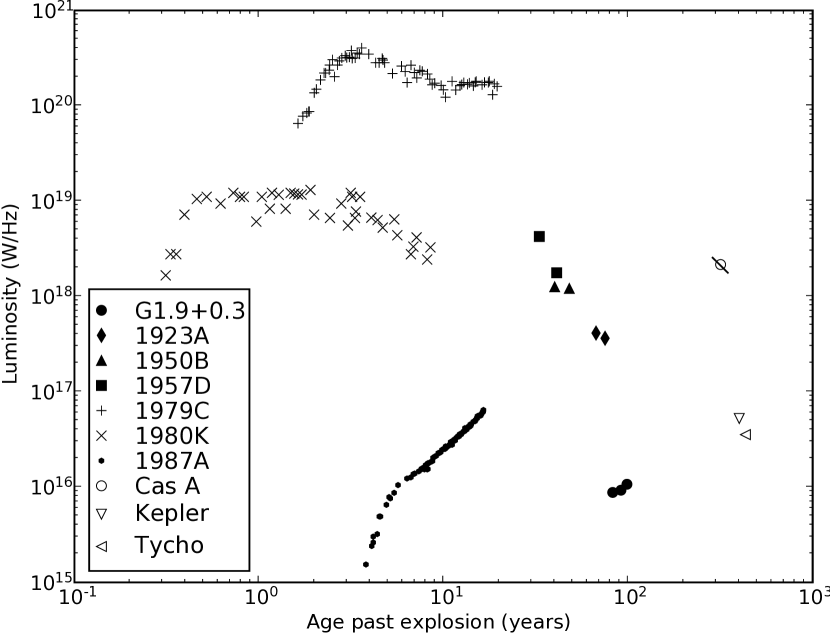
Taking the age estimate of years from Green et al. (2008), we have plotted the light curve of G1.9+0.3 in Fig. 4 with a selection of other RSNe (SN 1923A, SN 1950B, SN 1957D, 1979C, 1980K) and SNRs (Cas A, Kepler – SN 1504, Tycho – SN 1572) for comparison. To convert flux density to luminosity, we assumed a distance of 8.5 kpc for G1.9+0.3, following the argument of Reynolds et al. (2008) that the high absorption towards G1.9+0.3 makes it unlikely that it is significantly closer than the Galactic Center. For plotting clarity, the points have been binned into three groups of measurements (, , ).
4 Discussion
Only a fraction of SNe have detectable radio emission. Observations of these RSNe (see, for example; Eck et al., 2002) show that radio emission caused by the interaction between the shock and the circumstellar medium of the progenitor star is first detected within days to months of the initial explosion. As the shock travels into regions of decreasing opacity, the radio emission brightens, peaking between days to years after the explosion. After reaching their maximum brightness, RSNe then show a power law decrease in flux density with time (Weiler et al., 2002). This is demonstrated by the light curves of SN 1923A, SN 1950B, and others, shown in Fig. 4. The radio behaviour of RSNe is explained well by the models of Chevalier (1982, 1998).
There are even fewer Galactic SNRs of known age. Cassiopeia A, the youngest SNR of known age at years, Kepler (SN 1604) and Tycho (SN 1572) are shown in Fig. 4. The radio emission we detect from SNRs is due to the interaction between the shock and the interstellar medium. Hence the radio emission from a young SNR will increase once it has swept up enough of the surrounding interstellar medium. The timescale of this brightening is predicted to be years (Gull, 1973; Cowsik & Sarkar, 1984).
Between the youngest SNR of known age (Cas A) and the oldest RSNe of known age (SN 1923A), there is a gap in our observational evidence which makes it hard to probe the period after the fading of the radio emission from the RSN and before the SNR switches on. Eck et al. (2002) conducted a search for radio emission from SNe of a range of known ages, but did not detect any of the SNe that occurred prior to SN 1923 (for example, SN 1885A and SN 1909A). If the estimated age of years for G1.9+0.3 is correct, then our measurements help constrain the flux density evolution in this intermediate time range.
To explain the observed expansion rate measured by Reynolds et al. (2008) and the new light curve presented here, we need to reconsider some of the standard assumptions made when predicting the luminosity evolution of SNRs. The radio luminosity of a synchrotron source at a given frequency is a function of the energy spectrum of the ultrarelativistic electrons, the magnetic field present in the source, and the volume of the source , as given in Longair (1994)
where is the spectral index, is a constant, and is defined in terms of the electron energy spectrum per unit volume
Hence for a given frequency
If we make the assumptions that the expansion of the remnant is adiabatic, and that magnetic flux freezing is applicable, then the magnetic field strength decreases as . Following Longair (1994) we can derive that and so
Now the time dependence of the luminosity is proportional to the time dependence of the source radius, since the spectral index should not change during adiabatic expansion. Expressing the change in radius with time as a power law with expansion parameter , , then
During an ideal free expansion phase , and in the Sedov phase . Using the spectral index of given by Reynolds et al. (2008) we would expect the luminosity to change as in free expansion, or in Sedov expansion.
If we fit the measured expansion rate given by Reynolds et al. (2008) with a power law (assuming an age of 100 years in 2008), we get , implying which is intermediate between free expansion and the Sedov phase. Using our new light curve data we get . Clearly, to produce the observed increase in luminosity, either the magnetic field strength or the energy density of the relativistic electrons (or both) must be increasing with time, rather than decreasing as assumed above. A similar conclusion was drawn by Green et al. (2008) . This scenario is supported by what we know about older SNRs — extrapolating backwards from the observed magnetic field strength in Cas A, the assumption of magnetic flux freezing would result in an implausible magnetic field strength in the progenitor star (Longair, 1994). Hence at some period in its evolution, the magnetic field strength must have undergone a process of amplification. Simulations by Jun & Jones (1999) show that a possible mechanism for this amplification is Rayleigh-Taylor instability in the interaction region between the SNR shock and a surrounding cloud of interstellar gas. This happens on timescales of years after the inital explosion. Our observations suggest that G1.9+0.3 has entered such a phase, in which is growing.
5 Summary
Twenty years of observations with the Molonglo Observatory Synthesis Telescope show that the young supernova remnant G1.9+0.3 has increased in brightness by per cent yr-1 between 1998 and 2007. This supports the estimate of per cent yr-1 made by Green et al. (2008). This result, for what is potentially the youngest SNR of known age at years, confirms predictions that although most RSNe are decreasing in brightness, they will have to go through a period of brightening later in their evolution, to match the observed brightness of young SNRs in our Galaxy.
As the next generation of radio telescopes revolutionise the study of RSNe and SNRs, archival data from telescopes such as MOST will have an important role to play, giving us insight into the evolution of these objects over long timescales.
Acknowledgments
Thanks to D. A. Green and colleagues for making their VLA images available. We thank B. Piestrzynska for processing the MOST archival data and to the MOST site manager, D. Campbell-Wilson. The MOST is operated with the support of the Australian Research Council and the School of Physics, The University of Sydney. TM and BMG acknowledge the support of an ARC Australian Postdoctoral Fellowship (DP0665973) and an ARC Federation Fellowship (FF0561298), respectively. SC acknowledges support from the University of Sydney Postdoctoral Fellowship program.
References
- Ball et al. (2001) Ball L., Crawford D. F., Hunstead R. W., Klamer I., McIntyre V. J., 2001, ApJ, 549, 599
- Bock et al. (1999) Bock D. C.-J., Large M. I., Sadler E. M., 1999, AJ, 117, 1578
- Campbell-Wilson & Hunstead (1994) Campbell-Wilson D., Hunstead R. W., 1994, Proceedings of the Astronomical Society of Australia, 11, 33
- Cappellaro (2003) Cappellaro E., 2003, in Weiler K., ed., Supernovae and Gamma-Ray Bursters Vol. 598 of Lecture Notes in Physics, Berlin Springer Verlag. p. 37
- Chevalier (1982) Chevalier R. A., 1982, ApJ, 259, 302
- Chevalier (1998) Chevalier R. A., 1998, ApJ, 499, 810
- Cowsik & Sarkar (1984) Cowsik R., Sarkar S., 1984, MNRAS, 207, 745
- Eck et al. (2002) Eck C. R., Cowan J. J., Branch D., 2002, ApJ, 573, 306
- Eck et al. (1998) Eck C. R., Roberts D. A., Cowan J. J., Branch D., 1998, ApJ, 508, 664
- Efron (1982) Efron B., 1982, The Jackknife, the Bootstrap and other resampling plans. Society for Industrial and Applied Mathematics, Philadelphia
- Fesen et al. (2006) Fesen R. A., Hammell M. C., Morse J., Chevalier R. A., Borkowski K. J., Dopita M. A., Gerardy C. L., Lawrence S. S., Raymond J. C., van den Bergh S., 2006, ApJ, 645, 283
- Gaensler & Hunstead (2000) Gaensler B. M., Hunstead R. W., 2000, Publications of the Astronomical Society of Australia, 17, 72
- Gray (1994a) Gray A. D., 1994a, MNRAS, 270, 861
- Gray (1994b) Gray A. D., 1994b, MNRAS, 270, 822
- Green et al. (1999) Green A. J., Cram L. E., Large M. I., Ye T., 1999, ApJS, 122, 207
- Green (2004) Green D. A., 2004, Bulletin of the Astronomical Society of India, 32, 335
- Green & Gull (1984) Green D. A., Gull S. F., 1984, Nat, 312, 527
- Green et al. (2008) Green D. A., Reynolds S. P., Borkowski K. J., Hwang U., Harrus I., Petre R., 2008, MNRAS, 397, L54
- Gull (1973) Gull S. F., 1973, MNRAS, 161, 47
- Jun & Jones (1999) Jun B.-I., Jones T. W., 1999, ApJ, 511, 774
- Longair (1994) Longair M. S., 1994, High energy astrophysics. Vol.2: Stars, the galaxy and the interstellar medium. 2nd edn. Cambridge University Press, Cambridge
- Manchester et al. (2002) Manchester R. N., Gaensler B. M., Wheaton V. C., Staveley-Smith L., Tzioumis A. K., Bizunok N. S., Kesteven M. J., Reynolds J. E., 2002, Publications of the Astronomical Society of Australia, 19, 207
- Mills (1981) Mills B. Y., 1981, Proceedings of the Astronomical Society of Australia, 4, 156
- Misanovic et al. (2002) Misanovic Z., Cram L., Green A., 2002, MNRAS, 335, 114
- Montes et al. (1998) Montes M. J., van Dyk S. D., Weiler K. W., Sramek R. A., Panagia N., 1998, ApJ, 506, 874
- Montes et al. (2000) Montes M. J., Weiler K. W., Van Dyk S. D., Panagia N., Lacey C. K., Sramek R. A., Park R., 2000, ApJ, 532, 1124
- Murphy et al. (2007) Murphy T., Mauch T., Green A., Hunstead R. W., Piestrzynska B., Kels A. P., Sztajer P., 2007, MNRAS, 382, 382
- Reichart & Stephens (2000) Reichart D. E., Stephens A. W., 2000, ApJ, 537, 904
- Reynolds et al. (2008) Reynolds S. P., Borkowski K. J., Green D. A., Hwang U., Harrus I., Petre R., 2008, ApJ, 680, L41
- Robertson (1991) Robertson J. G., 1991, Australian Journal of Physics, 44, 729
- Staveley-Smith et al. (2007) Staveley-Smith L., Gaensler B. M., Manchester R. N., Ball L., Kesteven M. J., Tzioumis A. K., 2007, in Immler S., McCray R., eds, Supernova 1987A: 20 Years After: Supernovae and Gamma-Ray Bursters Vol. 937 of American Institute of Physics Conference Series. p. 96
- Stockdale et al. (2006) Stockdale C. J., Maddox L. A., Cowan J. J., Prestwich A., Kilgard R., Immler S., 2006, AJ, 131, 889
- Weiler et al. (2002) Weiler K. W., Panagia N., Montes M. J., Sramek R. A., 2002, ARA&A, 40, 387
- Weiler et al. (1986) Weiler K. W., Sramek R. A., Panagia N., van der Hulst J. M., Salvati M., 1986, ApJ, 301, 790
- Weiler et al. (1991) Weiler K. W., van Dyk S. D., Discenna J. L., Panagia N., Sramek R. A., 1991, ApJ, 380, 161
- Weiler et al. (1992) Weiler K. W., van Dyk S. D., Panagia N., Sramek R. A., 1992, ApJ, 398, 248
- Weiler et al. (2007) Weiler K. W., Williams C. L., Panagia N., Stockdale C. J., Kelley M. T., Sramek R. A., Van Dyk S. D., Marcaide J. M., 2007, ApJ, 671, 1959