Thermal Conductivity of Thermally-Isolating Polymeric and Composite Structural Support Materials Between 0.3 and 4 K
Abstract
We present measurements of the low-temperature thermal conductivity of a number of polymeric and composite materials from 0.3 to 4 K. The materials measured are Vespel SP-1, Vespel SP-22, unfilled PEEK, 30% carbon fiber-filled PEEK, 30% glass-filled PEEK, carbon fiber Graphlite composite rod, Torlon 4301, G-10/FR-4 fiberglass, pultruded fiberglass composite, Macor ceramic, and graphite rod. These materials have moderate to high elastic moduli making them useful for thermally-isolating structural supports.
keywords:
Thermal conductivity , Polymers , Composites , Structural materials,
1 Introduction
Cryogenic instruments frequently require rigid mechanical support of significant mass while minimizing conductive heat flow. In particular, optical systems require very stiff structural mounts. To increase the stiffness of a structure the designer generally has the choice of using more material or choosing materials with larger elastic moduli. However, materials with higher elastic moduli tend to have higher thermal conductivity. This situation motivates the use of the ratio of elastic modulus to thermal conductivity as the figure of merit for thermally-isolating structural materials.
This work was motivated by the need to support the cryogenic microwave receiver of the Spider balloon experiment[11, 10, 3]. The Spider instrument insert has massive components at 4.2, 1.4, 0.35 and 0.25 K. Each of these temperature stages are thermally and structurally referenced to an outer liquid helium cryostat. The cryostat will tip in elevation from zenith to horizon and the cryogenic support structures must minimize the gravitational deflection of the focal plane. Historically, we have used polyimide supports such as Dupont Vespel SP because of its low thermal conductivity [9, 12]. Advanced polymers like Vespel are generally quite expensive. At the time of this writing, 1/2′′ Vespel rods cost approximately half the price of gold by weight. Because the Spider instrument will include six duplicate focal plane structures, the cost and availability of the material required to support them is a significant concern.
There are a number of materials properties that are potentially important when designing thermally-isolating structural supports. As mentioned previously, low thermal conductivity and high modulus are desirable attributes. The elastic modulus of materials increases as they cool (for example, see Flynn [5]). This increase in stiffness is moderate in metals but can be significant for for some polymers. In particular, the elastic modulus of Teflon increases by approximately a factor of 20 when cooled from room to cryogenic temperatures [2]. In addition to stiffness, the strength of materials is important for structures that may experience large forces or shocks.
The stability of the dimensions of the structure upon cooling may also be important. In this case, materials with small coefficients of thermal contraction, such as carbon fiber composites [14], may be desirable. For larger structures the support members themselves may comprise a significant fraction of the mass, in which case the density may become important. The enthalpy of the materials, particularly those with low thermal conductivity, may also be a significant concern since they will take longer to cool down.
2 Materials Tested
We test two types of DuPont Vespel polyimides. Vespel SP-1 is the base polyimide resin and SP-22 is filled with 40% graphite by weight. Polyetheretherketone (PEEK) is a semi-crystalline thermoplastic and is available in both pure and filled forms. We test three types of PEEK. The first is unfilled Ketron PEEK 1000 manufactured by Quadrant Plastics111http://www.quadrantepp.com. The second is 30% carbon fiber-filled PEEK 450CA30 manufactured by Drake Plastics222http://www.drakeplastics.com (PEEK CA30). The short carbon fibers are not oriented in this material, although the extrusion process may introduce some anisotropy to its properties. We only measure the thermal conductivity along the extrusion direction of the rod. The third PEEK sampe is 30% glass-filled Sustatec PEEK manufactured by Rochling Sustaplast333http://www.sustaplast.com (PEEK GF30). This is also an extruded product and we measured the thermal conductivity only along the axis of extrusion.
We measure two composite materials made by Avia Sport Composites444http://www.aviasport.net. The first is pultruded carbon-fiber called Graphlite. Graphlite contains 67% carbon fiber by volume and a Bis-F epoxy matrix. The pultrusion process naturally orients the fiber bundle along the axis of the rod, but visual inspection of the material shows that the fibers are not uniformly oriented along this axis. The second material is a pultruded fiberglass rod with Bis-F epoxy which we will refer to as Avia Fiberglass in this paper. We only measure the thermal conductivity along the pultrusion axis of the rods. Both of these composites are supplied by CST Composites555http://www.cstsales.com.
We measure a sample of graphite rod from Poco Graphite Inc.666http://www.poco.com The type of graphite measured is the same as that tested in Woodcraft et al. [18] (industrial grade AXM-5Q). This graphite has a particle size of 5 microns and an apparent density of 1.73 g/cc. Macor is a machinable glass-ceramic manufactured by Corning777http://www.corning.com. We also measure a sample of Torlon 4301. The Torlon base (4203) is a polyamide-imide (PAI) thermoplastic manufactured by Quadrant Plastics and the 4301 grade includes both 12% graphite powder and 3% PTFE.
The final material tested is a commonly available G-10/FR-4 Garolite fiberglass rod purchased from McMaster-Carr888http://www.mcmaster.com. The manufacturer of this sample is unknown, but the distributor states that it meets MIL-I-24768 specification for G-10/FR-4. Although a cryogenic grade of G-10 is available, our own experience and that of Walker and Anderson [17] suggests that for many cryogenic applications the readily available G-10/FR-4 is an acceptable material. However, FR-4 may be unsuitable for ultra-high vacuum applications because of the presence of a halogen flame retardant. These rods are fabricated by bonding layers of woven glass fabric into a sheet and then grinding them into rods along one of the fiber axes. We confirmed the orientation of the fibers in our sample by dissolving away the binding epoxy. We measured the thermal conductivity along the plane of the woven glass fabric.
| Material | (g/cc) | TM (GPa) | CM (GPa) |
|---|---|---|---|
| Vespel SP-1 | 1.43 | , | 2.4 |
| Vespel SP-22 | 1.65 | , | 3.3 |
| PEEK | 1.31 | 4.3 | 3.5 |
| PEEK CA30∗∗ | 1.41 | 7.7 | 4.9 |
| PEEK GF30 | 1.51 | 6.9 | - |
| Graphlite CF Rod | 1.55 | 134 | 131 |
| Avia Fiberglass Rod | 2.05 | 45 | - |
| Torlon 4301 | 1.45 | 6.2 | 6.6 |
| G-10/FR-4 | 1.91 | - | - |
| Macor | 2.52 | ||
| Poco Graphite AXM-5Q | 1.73 |
3 Experimental Procedure
The thermal conductivity measurements are performed in an IR Labs HD-3(10)L liquid nitrogen/liquid helium cryostat. Temperatures below 0.27 K are obtained with a 3He sorption fridge operating from the pumped helium bath of the cryostat. The experiment is conducted within the 1.4 K radiative environment of the pumped helium cryostat.
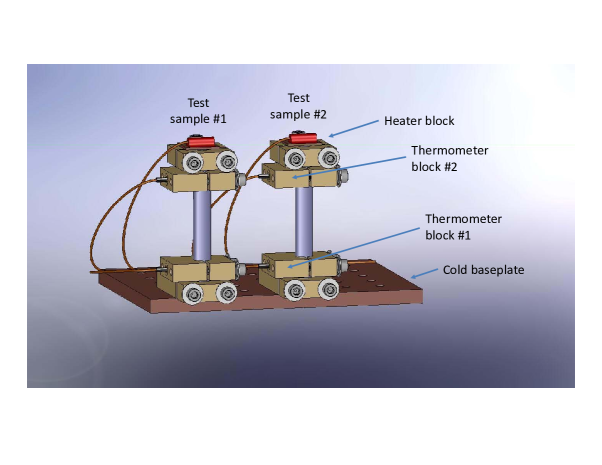
The sample test stage (shown schematically in Figure 1) has provision for two independent samples. The C10100-alloy copper mounting blocks are two piece clamps. Because the coefficient of thermal contraction of the test samples is generally higher than copper we use stainless belleville spring washers to maintain clamping force. A mounting block holds the sample upright and thermally sinks it to the cold stage. There are two thermometer blocks along the length of the sample, each containing a calibrated Cernox thermometer read out with a 4-wire resistance bridge. At the top of each sample is a 1 M metal-film resistive heater. In order to track any temperature coefficient of the resistive heater, we monitor both voltage and current across the heater to determine the heater power. Over the range of temperatures reported in this paper, the heater impedance is observed to vary by 7% . A thin layer of Apiezon-N thermal grease is applied to all interfaces. The test samples were all turned down to 0.25′′ in diameter with the exception of the Poco Graphite sample, which was 3/16′′ diameter and shimmed in the mounting blocks. The overall length of each sample was 2′′. The two thermometer blocks are spaced approximately 1′′ apart and their separation is measured with calipers.
An important element of the experimental setup is the separation of the thermometers from the heaters and heatsinks. When heat flows across a thermal interface a temperature gradient is formed. This thermal boundary resistance can lead to a significant temperature offset between the thermometer block and the sample under test if heat flows through the clamp to the material. If the thermometers are separated from the heaters and heatsinks, then once the test sample has come to thermal equilibrium there is very little heat flow from the thermometer block into the material (of order several pico–Watts). We can therefore be confident that the thermometer is reading the temperature of the material at that point along its length. Failure to effectively isolate the thermal boundary impedance from the intrinsic thermal conductivity of the sample will result in a biased estimate of the thermal conductivity of the sample.
We use the steady–state heat method and apply a measured amount of heater power to the top of each sample, wait until the system comes to thermal equilibrium, and measure the equilibrium temperatures at two points along the length of the sample. The wiring used to read out thermometers and bias heaters is 0.0045′′ diameter manganin. The thermal conductivity of the wiring is estimated to be no more than 2% of the conductivity of the least conductive material. The measurements are shown in Figure 2.

4 Results and discussion
The data are sparsely sampled between 0.27 and 4.2 K and the lower temperature changes with applied power because of the thermal boundary impedance with the heat sink. These factors prevent us from taking the derivative with respect to the upper temperature and employing the Leibniz rule for differentiating integrals. We instead fit the integral of a thermal conductivity model to the measured equilibrium temperatures and applied thermal power.
The conductive heat flow through the test sample for the data point is
where is the heat flow, is the geometric factor, is the thermal conductivity, is the lower temperature and the upper temperature. We fit our data to a thermal conductivity model of the form
The thermal conductivity of many of our samples begins to plateau at temperatures below K. Using the functional form allows a convenient parameterization of this rolling index. The phenomenon of the thermal conductivity reaching a plateau is common in polymers [6, 4, 1]. It is important to note that there are degeneracies between the parameters of our thermal conductivity model – the individual parameters are not physically motivated. However, the should encode information about the physical processes involved at each temperature.
For each material we use the set of electrical powers and temperatures and fit the set of data
where represents the particular equilibrium point and is a small constant–power offset. could include thermometer calibration error, wiring parasitics, and radiative coupling and is typically measured to be between 5 and 20 nW. The results of the fits can be found in Table 2 and are valid for temperatures within the measured range of 0.3 to 4.2 K. These functions are plotted in Figure 3 as well as the effective index, . Note that because the variables used in this fit are not uncorrelated different combinations of , , , and may result in that are identical within the accuracy of the data.
| Material | (mW/m K) | (1/Kn) | ||
|---|---|---|---|---|
| Vespel SP–1 | 2.23 | 1.92 | -0.819 | 0.0589 |
| Vespel SP–22 | 1.44 | 2.11 | -0.521 | -0.0163 |
| PEEK | 3.88 | 2.41 | -1.43 | 0.0884 |
| PEEK CA30 | 3.37 | 3.20 | -2.19 | 0.0640 |
| PEEK GF30 | 4.14 | 3.07 | -1.84 | 0.0553 |
| Graphlite CF Rod | 8.39 | 2.12 | -1.05 | 0.181 |
| Avia Fiberglass Rod | 10.3 | 2.28 | -0.585 | 0.310 |
| Torlon 4301 | 7.77 | 5.46 | -4.13 | 0.0682 |
| G–10/FR–4 | 12.8 | 2.41 | -0.921 | 0.222 |
| Macor | 4.00 | 2.55 | -0.140 | 0.809 |
| Poco Graphite AXM–5Q | 1.54 | 3.36 | -1.83 | -0.142 |
| Material | K | K | K | ||
|---|---|---|---|---|---|
| (mW/m K) | (mW/m K) | (mW/m K) | (mW/m) | (mW/m) | |
| Vespel SP–1 | 0.553 | 3.21 | 9.74 | 2.05 | 18.3 |
| Vespel SP–22 | 0.217 | 2.46 | 14.3 | 1.31 | 21.7 |
| PEEK | 1.00 | 5.31 | 12.0 | 3.57 | 25.3 |
| PEEK CA30 | 0.823 | 4.66 | 10.6 | 3.09 | 22.4 |
| PEEK GF30 | 0.812 | 6.20 | 19.6 | 3.76 | 36.7 |
| Graphlite CF Rod | 1.80 | 11.8 | 25.0 | 7.62 | 55.0 |
| Avia Fiberglass Rod | 1.08 | 17.8 | 73.2 | 9.17 | 130 |
| Torlon 4301 | 1.06 | 11.8 | 28.5 | 6.88 | 60.7 |
| G–10/FR–4 | 1.64 | 20.6 | 65.6 | 11.4 | 126 |
| Macor | 0.199 | 8.85 | 81.4 | 3.64 | 116 |
| Poco Graphite AXM–5Q | 0.366 | 2.66 | 22.7 | 1.44 | 29.9 |
We assign an uncertainty of 10% to a value of thermal conductivity generated using the parameters presented in Table 2 throughout the range 0.3 to 4 K. The statistical scatter of the residuals to the fits is generally of order a few percent indicating that the model is a good fit to the data. We have not corrected for the change in due to the contraction of the materials as they cool from room temperature and our measurements of were of order 1%. The uncertainty on the heater power applied on the top of the sample is estimated at 4%. We estimate the parasitic conductivity from the wiring to be less than 2% for the least conductive materials. The calibration of the thermometers is accurate to better than 1% with respect to the calibration from Lakeshore Cryotronics. We measured a PEEK CA30 sample in both sample test locations with different clamps, wiring, heaters, and thermometry and the best fit conductivity agreed to across the full temperature range.

Locatelli et al. [9] and Olson [12] have previously reported the low–temperature thermal conductivity of Vespel SP–1 (up to 1 K) and SP–22 (up to 2 K). For SP–22, our results are in very good agreement with Olson [12] for temperatures below 1 K. Above 1 K our results favor an index closer to 1.6. Locatelli et al. [9] measured SP–1 from 0.1 to 1 K and we agree with the shallow index of 1.1–1.2 across this temperature range. However, our measured conductivity is of order 25–30% larger than their result. Our measurements extend the the thermal conductivity measurements of both types of Vespel up to 4 K.
The thermal conductivity of unfilled PEEK has been measured previously [7], but we are unaware of previous measurements of carbon–filled PEEK or glass–filled PEEK at low temperatures. Our measurements of the thermal conductivity of unfilled PEEK disagree significantly with those in Gottardi et al. [7]. We measure a factor of 2–3 higher conductivity in the region of overlap. Our PEEK sample is supplied from a different vendor than that measured in Gottardi et al. [7] and the thermal conductivity difference may reflect intrinsic differences – such as the degree of crystallinity – between the samples. It is also possible that differences in experimental setup contributed to the disagreement. Our own measurements showed that it is important to isolate the thermometer blocks from the heaters and heatsinks due to the finite thermal boundary impedance between the copper clamps and the sample.
It is interesting to note the similarity in thermal conductivity of unfilled PEEK and 30% carbon–filled PEEK. Unlike Vespel, where the addition of graphite significantly changes the conductivity of the material, the addition of carbon fiber to PEEK seems to decrease its conductivity only marginally and the effective index is very similar to unfilled PEEK (see Figure 3). The addition of glass to PEEK appears to affect its conductivity mostly at temperatures above 1 K.
Reed and Golda [14] contains a review of the cryogenic properties of composite supports including measurements of the thermal conductivity of carbon fiber composites down to 4 K. Our measurement of 24 mW/m K for carbon fiber composite rod at 4 K agrees with the values of mW/m K in this review. Radcliffe and Rosenberg [13] report measurements down to K. Over the range of overlap ( K) our results are in very good agreement with their samples measured along the axis of the fibers for those samples with high fiber volume. Note that our sample has a fiber volume of 67% and we measure its thermal conductivity along the fiber direction. We are not aware of measurements of the thermal conductivity of carbon fiber composites below 1.5 K.
Roth and Anderson [15] measured Macor ceramic from 0.06 K up to K. Our data are consistent with these results. This reference also includes the data of Lawless [8] at temperatures above 2 K (corrected for a misscaling by a factor of 10) and we agree with these data as well. The thermal conductivity of the base Torlon 4203 PAI has been measured previously [16], but we are unaware of published conductivity measurements for Torlon 4301.
An upper– and lower–limit to the conductivity of Poco Graphite AXM–5Q is reported in Woodcraft et al. [18]. The limits of Woodcraft et al. [18] are consistent with our measurements. We also observe the leveling–off of the thermal conductivity at the low–temperature end. It is worth noting that the graphite sample is the only material we tested that has an effective index that rises significantly with increasing temperature rather than falling. As noted in Woodcraft et al. [18], this feature makes the material attractive for use as a passive heat switch. With a room–temperature conductivity of around 90 W/m K, the ratio of room–temperature to K conductivity is 34,000 for AXM–5Q.
Walker and Anderson [17] report a measurement of the thermal conductivity of G–10 and G–10CR (a “cryogenic grade” of G–10) along the plane of the glass fibers at temperatures between 0.1 and 4 K. Our measurements of the thermal conductivity of FR–4 along the plane of glass fibers are visually in good agreement with these results even though our sample contains the halogen flame retardant.
A quality of particular interest to designers of thermally–isolating cryogenic structural supports is the ratio of stiffness to heat flow of a material. This can be quantified as the ratio of the elastic modulus, EM, to the thermal conductivity, , of a material. This figure of merit is of particular interest for truss structures where the members are under tension and compression. It is difficult to come by measurements of the low–temperature moduli of materials. Although the increase in material stiffness with cooling can be significant for some materials (eg. Teflon), it is informative to plot the room temperature elastic modulus over low–temperature thermal conductivity. Figure 4 shows this ratio for the materials tested here. For fiber-containing composites, we use values of EM and along the axis of the fibers.

There are a number of noteworthy features in Figure 4. It is worth pointing out to designers on a budget that a number of materials performed better than the two varieties of Vespel tested here. Two of the materials that performed best (Macor and graphite rod) are brittle and care must be taken to avoid exceeding their rupture strengths. Note that the flexural strengths of Poco Graphite AXM–5Q (69 MPa) and Macor ceramic (94 MPa) are not far from the ultimate flexural strengths of Vespel SP–1 (110 MPa) and SP–22 (90 MPa). The carbon fiber rod surpasses the next closest material by nearly an order of magnitude in stiffness–to–conductivity at 4 K.
5 Conclusions
We have measured the thermal conductivity of a number of polymeric and composite materials between 0.3 and 4 K and fit the results to a parametric model. We then compare the ratio of the room–temperature elastic modulus and the low–temperature thermal conductivity to identify candidate materials for thermally–isolating structural support members. By this metric, a number of the inexpensive materials performed better than much more expensive advanced engineering polymers across the relevant temperature range. Of particular note is the pultruded carbon fiber Graphlite rod, which distinguishes itself at K, as well as Macor ceramic at low temperatures.
6 Acknowledgments
This work was supported under the Spider project by NASA Grant No. NNX07AL64G. The authors wish to thank Justin Lazear for his assistance with thermometer cross–calibration, Mike Zemcov for pointing us to Poco Graphite, and Warren Holmes for useful discussions.
References
- Barucci et al. [2005] M. Barucci, E. Olivieri, E. Pasca, L. Risegari, and G. Ventura. Thermal conductivity of Torlon between 4.2 and 300 K. Cryogenics, 45:295–299, April 2005.
- Corruccini [1957] R. J. Corruccini. Chemical Engineering Progress, 53:397, 1957.
- Crill [2008] B. P. Crill. Spider: a balloon-borne large-scale cmb polarimeter, in preparation. In The Proceedings of the SPIE, 2008.
- Duval et al. [1995] E. Duval, T. Achibat, A. Boukenter, B. Varrel, R. Calemczuk, and B. Salce. Low-energy excitations in polyvinyl chloride: Raman scattering and thermal properties. Journal of Non-Crystalline Solids, 190:258–263, 1995.
- Flynn [2005] T. M. Flynn. Cryogenic Engineering. CRC Press, 2005.
- Freeman and Anderson [1986] J. J. Freeman and A. C. Anderson. Thermal conductivity of amorphous solids. Phys. Rev. B, 34:5684–5690, October 1986. doi: 10.1103/PhysRevB.34.5684.
- Gottardi et al. [2001] E. Gottardi, G. Bianchini, I. Peroni, A. Peruzzi, and G. Ventura. Thermal conductivity of polyetheretherketone at low temperatures. In Proceedings of Tempmeco, Berlin, 2001.
- Lawless [1975] N. W. Lawless. Dielectric and thermal properties of a machinable glass ceramic at low temperatures. Cryogenics, 15:273–277, 1975.
- Locatelli et al. [1976] M. Locatelli, D. Arnaud, and M. Routin. Thermal conductivity of some insulating materials below 1 k. Cryogenics, 16:374–375, June 1976.
- MacTavish et al. [2007] C. J. MacTavish, P. A. R. Ade, E. S. Battistelli, S. Benton, R. Bihary, J. J. Bock, J. R. Bond, J. Brevik, S. Bryan, C. R. Contaldi, B. P. Crill, O. Doré, L. Fissel, S. R. Golwala, M. Halpern, G. Hilton, W. Holmes, V. V. Hristov, K. Irwin, W. C. Jones, C. L. Kuo, A. E. Lange, C. Lawrie, T. G. Martin, P. Mason, T. E. Montroy, C. B. Netterfield, D. Riley, J. E. Ruhl, A. Trangsrud, C. Tucker, A. Turner, M. Viero, and D. Wiebe. Spider Optimization: Probing the Systematics of a Large Scale B-Mode Experiment. ArXiv e-prints, 710, October 2007.
- Montroy et al. [2006] T. E. Montroy, P. A. R. Ade, R. Bihary, J. J. Bock, J. R. Bond, J. Brevick, C. R. Contaldi, B. P. Crill, A. Crites, O. Doré, L. Duband, S. R. Golwala, M. Halpern, G. Hilton, W. Holmes, V. V. Hristov, K. Irwin, W. C. Jones, C. L. Kuo, A. E. Lange, C. J. MacTavish, P. Mason, J. Mulder, C. B. Netterfield, E. Pascale, J. E. Ruhl, A. Trangsrud, C. Tucker, A. Turner, and M. Viero. SPIDER: a new balloon-borne experiment to measure CMB polarization on large angular scales. In Ground-based and Airborne Telescopes. Edited by Stepp, Larry M.. Proceedings of the SPIE, Volume 6267, pp. 62670R (2006)., volume 6267 of Presented at the Society of Photo-Optical Instrumentation Engineers (SPIE) Conference, July 2006.
- Olson [1993] J.R. Olson. Thermal-conductivity of some common cryostat materials between 0.05 and 2-k. Cryogenics, 33(7):729–731, 1993.
- Radcliffe and Rosenberg [1982] D. J. Radcliffe and H. M. Rosenberg. The thermal conductivity of glass-fibre and carbon-fibre/epoxy composites from 2 to 80 k. Cryogenics, 22(5):245–249, May 1982.
- Reed and Golda [1997] R.P. Reed and M. Golda. Cryogenic composite supports: a review of strap and strut properties. Cryogenics, 37(5):233–250, 1997.
- Roth and Anderson [1976] E. P. Roth and A. C. Anderson. Low-temperature thermal conductivity and specific heat of a machinable ceramic. Journal of Applied Physics, 47:3644–3647, August 1976.
- Ventura et al. [1999] G. Ventura, G. Bianchini, E. Gottardi, I. Peroni, and A. Peruzzi. Thermal expansion and thermal conductivity of torlon at low temperatures. Cryogenics, 39:481–484, September 1999.
- Walker and Anderson [1981] F. J. Walker and A. C. Anderson. Thermal conductivity and specific heat of a glass-epoxy composite at temperatures below 4 K. Review of Scientific Instruments, 52(3):471–472, March 1981.
- Woodcraft et al. [2003] A. L. Woodcraft, W. D. Duncan, and P. R. Hastings. A replacement for AGOT graphite? Physica B Condensed Matter, 329:1662–1663, May 2003.