THE CRAB NEBULA’S COMPOSITION
AND PRECURSOR STAR MASS
Abstract
We present results of new photoionization calculations for investigating gaseous regions that represent potentially expected stages of nuclear processing in the Crab Nebula supernova remnant. In addition to gas resulting from CNO-processing and oxygen-burning, as previously reported, a large component of the nebula appears to be carbon-rich. These results suggest that the precursor star had an initial mass 9.5 M⊙.
1 INTRODUCTION
The Crab Nebula (M1 = NGC1952) is generally recognized as the remnant of the core-collapse supernova SN1054. Estimates of the precursor star’s initial mass have been in the range M⊙ (see Davidson & Fesen 1985 and references therein). The visible remnant contains at least M⊙ of He-rich line-emitting gas (MacAlpine & Uomoto 1991)111Fesen et al. 1997 used global line photometry to suggest a higher nebular mass, approaching that once postulated by MacAlpine et al. 1989. However, as discussed in MacAlpine & Uomoto 1991, large spatial variations in the He/H ratio cause spuriously large mass estimates based on global line photometry. More accurate emitting gas estimates should take into account spatially resolved line photometry in order to allow for the effects of helium abundance variations on N(S)/N(H), which is used along with S II line intensities to estimate the amount of neutral gas present., the neutron star probably has about 1.4 M⊙, and the outer layers of the precursor may have left in a pre-supernova wind (Nomoto et al. 1982) or a shockwave (e.g., Chevalier 1977; Davidson & Fesen 1985).
Knowledge of the chemical composition of the remnant is vitally important for a better understanding of the precursor star’s initial mass and associated details of the core-collapse event. According to Nomoto et al. (1982), an M⊙ star would likely have undergone an O-Ne-Mg core collapse following electron capture, whereas a star more massive than 9.5 M⊙ would have developed an Fe-rich core. A distinguishing factor between these two possible scenarios would be the nebular carbon abundance. As pointed out by Nomoto (1985), for a precursor with initial mass less than about 9.5 M⊙, high N and low C mass fractions (compared with solar) would exist from CNO-cycle processing in the He-rich gas. On the other hand, for precursor mass 9.5 M⊙, helium-burning and nitrogen-processing via 14N(,)18F(-)18O(,)22Ne ought to have produced high C and low N. In addition, models for a roughly 10 M⊙ precursor (Woosley et al. 1980; Woosley & Weaver 1986) have suggested the existence of off-center neon and oxygen flashes just prior to the core collapse, whereas such events may not be expected in lower mass stars (Hillebrandt et al. 1984; Nomoto 1984).
The necessary chemical composition information should be obtainable. Because of its young age and location roughly 180 pc from the Galactic plane, the Crab Nebula is relatively uncontaminated by interstellar material. In addition, its line-emitting gas is ionized and heated primarily by locally-generated synchrotron radiation (rather than shock heating), so the ionization, thermal, and chemical characteristics of the gas can be accurately analyzed using numerical photoionization codes.
Although there has been a long history of observational and theoretical investigations aimed at understanding abundances in the Crab Nebula, to some extent the results have been inconclusive or contradictory. As summarized by Henry (1986), Henry and MacAlpine (1982) and Pequignot and Dennefeld (1983) compared measured line-intensity data available at the time with photoionization calculations. In both studies, the deduced C and N mass fractions were roughly solar or below, but there were problems with interpretation of near-infrared C I emission lines (see below). Davidson et al. (1982) and Blair et al. (1992) also obtained satellite observations of the ultraviolet C IV and C III lines for certain locations, and they concluded no definitive evidence for a carbon excess, although the latter study left open the possibility. More recently, using extensive long-slit spectroscopy covering much of the nebula, MacAlpine et al. (1996) deduced high nitrogen mass fractions in some filamants and also high abundances for products of oxygen-burning, such as sulfur and argon, at other locations. All of the above results, taken together, have generally been interpreted as suggestive of a precursor in the M⊙ range, although high sulfur and argon abundances would appear to argue for a more massive star.
In this paper, we report on the results of new photoionization computations (summarized by MacAlpine et al. 2007b), which were developed using new line-intensity measurements which extend to 1 µm (MacAlpine et al. 2007a, hereinafter Paper 1). These calculations suggest that strong N II 6548,6583 emission lines measured at many locations by MacAlpine et al. (1996, 2007a) do not necessarily imply high nitrogen abundances, while strong measured C I 9850 emission can be interpreted as indicative of high carbon mass fractions. In addition, high mass fractions for S and Ar in some locations are confirmed. These results argue consistently for a precursor star initial mass 9.5 M⊙.
2 PHOTOIONIZATION COMPUTATIONS AND NUCLEAR PROCESSING REGIONS
Photoionization models were produced using the numerical code Cloudy, version 06.02 (described in Ferland, G. J. et al. 1998). Guided by line-intensity measurements and correlations in Paper 1, we developed plane-parallel computations for a range of physical conditions and chemical abundances in efforts to investigate gaseous regions that may represent expected stages of nuclear processing for relevant stellar models (e.g., Woosley & Weaver 1995).
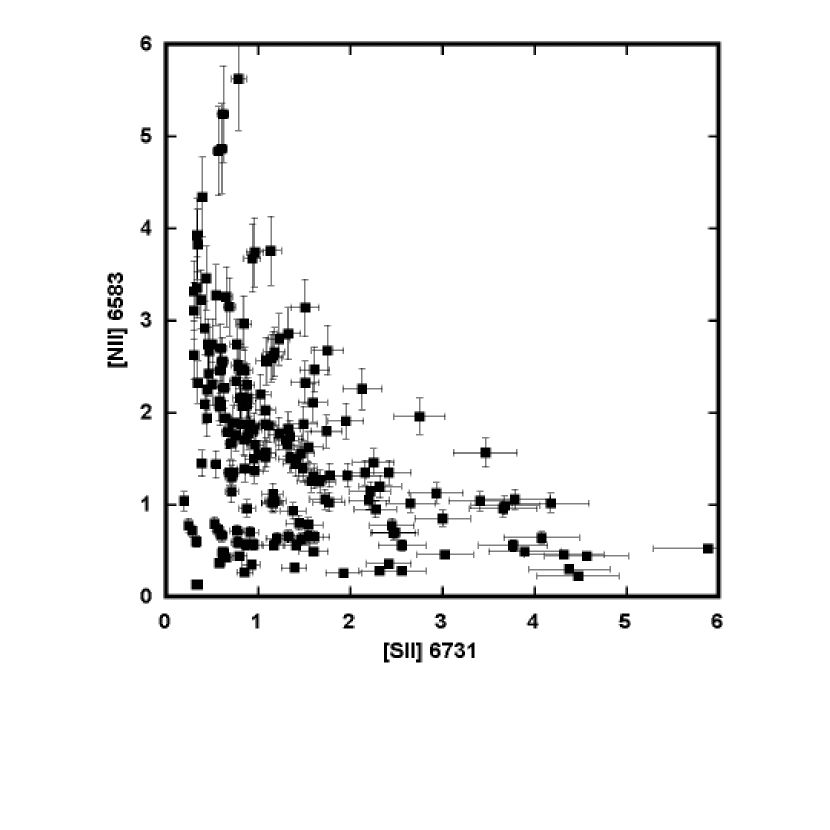
At least three nuclear processing domains may be inferred from the observations in Paper 1. Figure 1 of this paper (reproduced from Figure 4 of Paper 1) shows the correlation between measured, H-normalized, reddening-corrected N II6583 and S II6731 line intensities for 180 widely-distributed nebular locations. It was suggested in Paper 1 that the strongest nitrogen emission may represent gas which has progressed no further than the CNO-cycle, whereas the apparent majority of measurements (e.g., with normalized N II6583 over the range 1 to 2.5) could represent material in which some helium-burning has taken place and nitrogen has been converted into neon. The strongest sulfur emission was postulated to represent more advanced processing through oxygen-burning. In this paper, these regions of Figure 1 will be called nuclear processing “Domains 1, 2, and 3,” respectively.
2.1 DOMAIN 2 (HELIUM-BURNING AND NITROGEN DEPLETION)
We begin by discussing details of our analysis for Domain 2 because it involves the most prevalent nebular gas. In addition, the relevant photoionization models also help to understand the other domains.
First, we developed a representative “median observed spectrum” for Domain 2. This involved a subset of 19 spectra for which we have both optical and near-infrared measurements (see Paper 1) and for which the H-normalized N II6583 emission lies in the range 1–2.5. For each emission-line measurement, we identified a median value and combined those into a “median spectrum,” as given in Table 1. Then we adjusted photoionization model input parameters and chemical abundances in order to obtain a satisfactory fit to the observed data.
Following considerable experimentation, all models presented here employ the ionizing synchrotron radiation spectrum given by Davidson & Fesen (1985), with added points across the unobserved ultraviolet range as suggested in the documentation which accompanies the Cloudy code. In addition, we employed a constant hydrogen density of 3000 cm-3 and log ionization parameter = -3.2. The ionization parameter is defined as U = /cN, where is the flux of photons more energetic than 1 Rydberg striking the face of a cloud, c is the speed of light, and N is the total density of hydrogen. The ionizing spectrum did a good job of producing typically observed HeII/HeI line ratios (e.g., MacAlpine et al. 1989), the adopted hydrogen density led to calculated electron densities in S+ zones comparable with those measured by Fesen & Kirshner (1982), and the log U was necessary to obtain a consistent overall emission line spectrum that matches the observations, in particular the S III9069/S II6731 ratio.
The ionization parameter employed here is almost a factor of 10 lower than that which is necessary to account for far-ultraviolet C IV and C III lines (see Blair et al. 1992). Henry and MacAlpine (1982) noted similar ionization parameter differences when comparing photoionization calculations that could match optical and ultraviolet observations separately. We do not consider this to be a problem. As shown convincingly by Blair et al., much of the ultraviolet line emission probably comes from lower-density, more diffuse gas, compared with the gas in optical line-emitting filaments being analyzed here.
For our Domain 2 model, the helium abundance was set at 89% by mass fraction, consistent with some stellar model expectations (Woosley & Weaver 1995) for a region with partial helium-burning and also with numerous observations of He I5876 emission (e.g., Uomoto & MacAlpine 1987; MacAlpine et al. 1989; Paper 1).
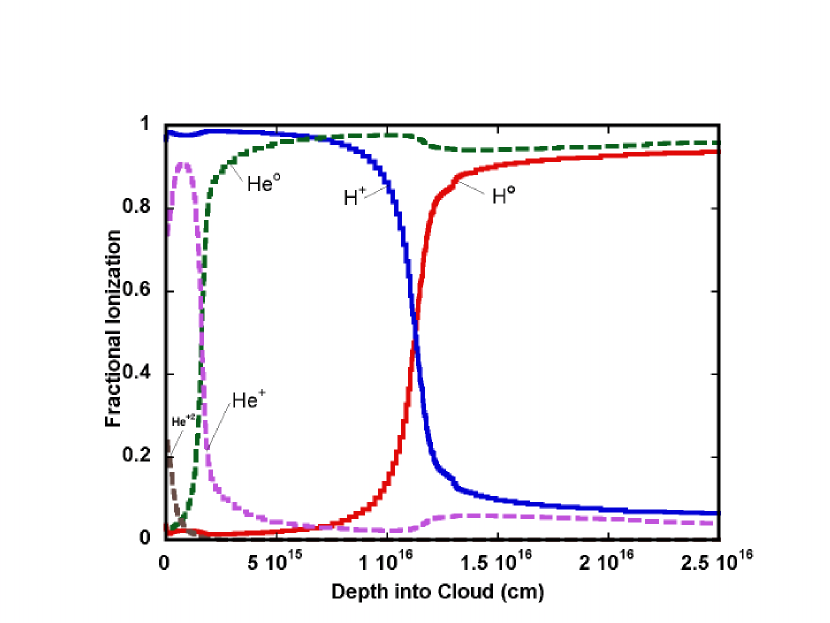
Figure 2 presents the computed Domain 2 hydrogen and helium ionization fractions as a function of depth into an emitting gas cloud, with ionizing radiation entering from the left. We note that the He+2 and He+ zones do not extend far into the cloud. Because of the high helium abundance, ionizing photons more energetic than 54.4 ev (the ionization potential of He+) and 24.6 ev (the ionization potential of He0) are absorbed before they can penetrate a substantial distance. The hydrogen ionized depth is about 1016 cm, which is consistent with observations for Crab Nebula filaments (see Davidson & Fesen 1985).
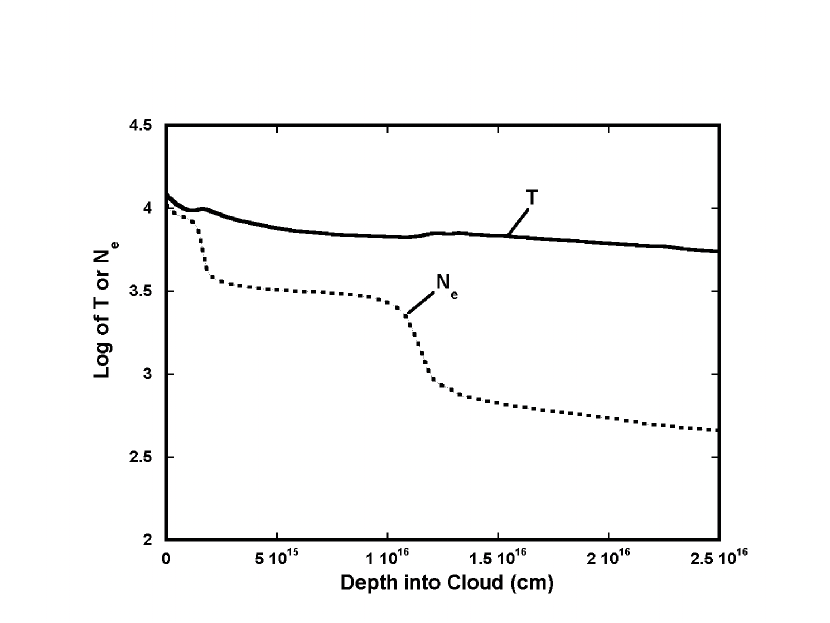
Figure 3 shows the computed electron temperature and density, plotted as a function of distance into the cloud. The electron density is roughly 8000 cm-3 where helium is ionized, drops to 3000 cm-3 through the H+ zone, and then falls to 400-800 cm-3. The temperature peaks near 1.2104 K, is about 6-8103 K through the H+ zone, and then remains above about 6000 K to the depth plotted.
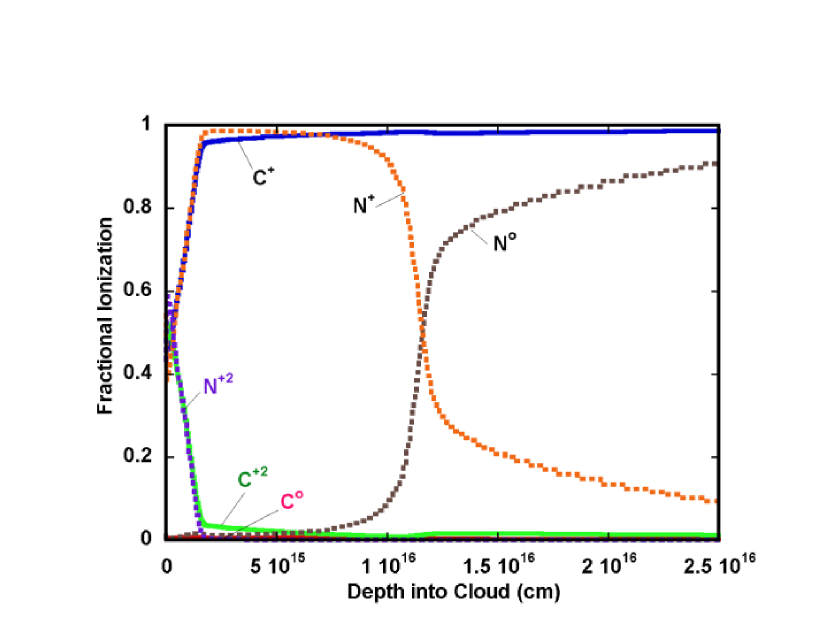
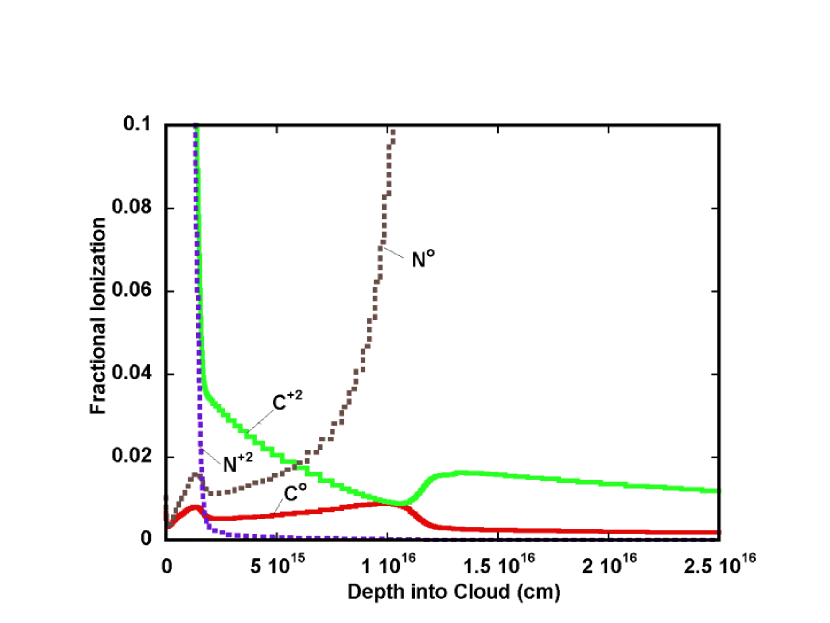
Figure 4 gives the modeled carbon and nitrogen ionization. Because the C+ ionization potential is comparable with that for He+, and the C0 ionization potential is below that for H0, the dominant ionization stage for carbon is C+, all the way from the He+ zone to where the calculations were stopped at a depth of approximately seven times the hydrogen ionization zone thickness. In addition, because the N+ and N0 ionization potentials are slightly above (within 5 ev of) those for He0 and H0, respectively, N+ occupies an extensive, very proficient “N II emitting zone,” in which the temperature and electron density effectively support collisional excitation.
Figure 5 presents an expanded view of the lower 10% of the vertical scale from Figure 4. This illustrates how a relatively small, but significant amount of C0 exists in the zones where helium and hydrogen are ionized. Progressing from left to right in the figure, there is a small peak in the C0 fraction where the electron density is highest due to ionized helium. Then there is a gradual C0 increase as the temperature declines, and finally there is essentially no C0 beyond the hydrogen ionization edge where the electron density becomes very low. These distribution characteristics for C0 are consistent what would be expected from C+C0 recombination.
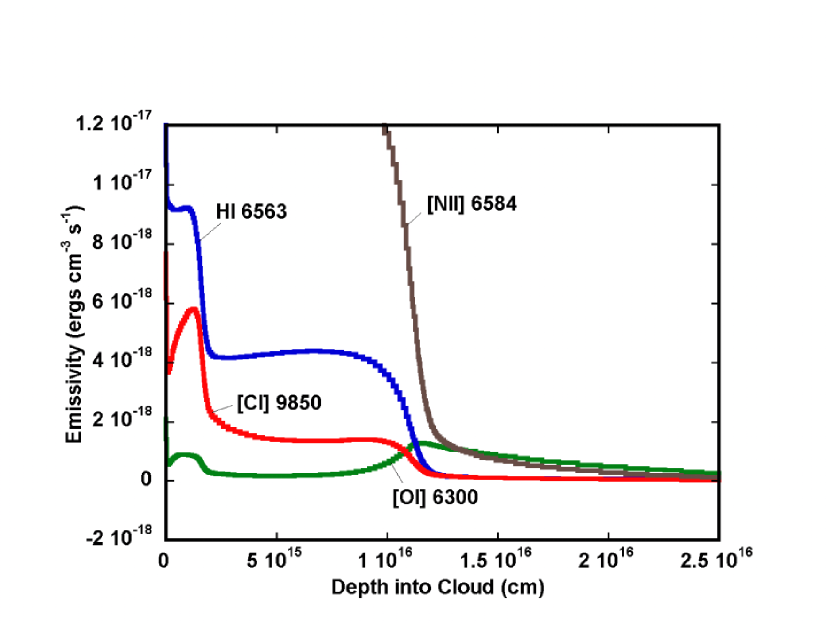
Figure 6 shows selected, computed line emissivities for this model, as a function of depth into the cloud. First, we note that N II 6584 is “off the chart” because of electron collisional excitation in the warm, high-electron-density N II emitting zone. H I 6563 illustrates what would be expected from recombination, and C I 9850 shows a similar distribution. As discussed above, the latter results from C+C0 recombination followed by electron collisional excitation. The O I 6300 line arises from collisional excitation of O0, and it is primarily important in the neutral hydrogen region because of charge exchange processes between hydrogen and oxygen.
Previously, high nitrogen mass fractions for many locations were deduced from observations of strong N II 6548,6583 emission and models using the Cloudy code in MacAlpine et al. (1996). However, those models did not adequately take into account very high helium abundance and its effect on broadening the N II emitting zone. The helium mass fraction over most of the nebula ranges from about 75% to greater than 90% (Uomoto & MacAlpine 1987). For such helium-rich regions, strong N II lines would not necessarily imply nitrogen mass fractions greater than solar.
It has been known for decades that C I 9850 emission is very strong in parts of the Crab Nebula (Dennefeld & Andrillat 1981; Henry et al. 1984). Pequignot & Dennefeld (1983) tried to match the observed strengths of this line by postulating a high dielectronic recombination rate, and Henry et al. (1984) postulated that collisional excitation by H0 could play an important role. Neither group was successful in using C I 9850 for reliable carbon abundance estimates. Therefore, difficult measurements of the ultraviolet C III and C IV emission were attempted as noted previously. However, production of those lines may not be well understood either, in the sense that model predictions can be wrong by as much as a factor of two depending on how He II L absorption is treated (Eastman et al. 1985). In the present calculations, we understand the production of C I 9850 emission as being due to thermal electron collisional excitation. This 1D23P2 transition is an analog of the O III 5007 line. Making use of effective collision strengths given by Pequignot & Aldrovandi (1976), we manually calculated emissivities at various locations and matched the model-computed emissivities exactly.
Predicted relative emission-line intensities from this model are shown in Table 1, where it may be seen that there is a reasonable match with the Domain 2 median spectrum for element mass fractions given in Table 2. The deduced Domain 2 nitrogen mass fraction is less than half of its solar value. We also note that the carbon mass fraction required to produce the observed median C I9850 emission in Domain 2 is roughly 6 times its solar value, and the deduced oxygen mass fraction is very close to solar. A surprising result is the sulfur mass fraction necessary to acount for the observed S II6731 and S III9069 emission, which is less than a third of its solar value.
2.2 DOMAIN 1 (STRONGEST NITROGEN EMISSION)
The photoionization calculations for Domain 1 gas employed the same ionizing spectrum, hydrogen density, and ionization parameter as discussed above; and the model characteristics are similar to those in Figures 2-6. The median measured spectrum and computed line intensities are shown in Table 1. The measured, normalized N II6583 values for Domain 1 range from 3.1 to 5.6, and the adopted median is 4.5. Unfortunately, the subset of near-infrared data with measurable C I9850 did not include any nebular locations with N II6583 2.5 (see Figure 10 of Paper 1). Therefore, no S III or C I line values are given for this domain in Table 1.
As may be seen in Table 2, the helium mass fraction required to match the observed He 15876 line is again 89 for Domain 1, which is consistent with expectations from stellar models in a zone containing largely CNO-processed material. However, we note that the inferred nitrogen mass fraction is only solar, because N II6583 arises so effectively in the N II emitting zone discussed above and illustrated in Figures 4 and 6. This implies some gas mixing or helium-burning. The deduced oxygen mass fraction is solar, while the data indicate that sulfur is significantly less than solar, as in Domain 2. The carbon mass fraction input to the Domain 1 model was assumed to be 0.5 solar. A lower-than-solar carbon mass fraction would be consistent for a region in which CNO-processing has taken place.
2.3 DOMAIN 3 (STRONGEST SULFUR EMISSION)
The measured spectrum and computed line intensities for Domain 3 are also shown in Table 1. By combining optical data for locations with measured S II6731 over the range 3-5.9 (see Figure 1) together with a subset of near-infared data, we derived a representative median spectrum for this domain. The best-fit photoionization model was similar to that for Domains 1 and 2, except it was necessary in this case to lower log U to -3.5 to match the S III9069/S II6731 ratio.
As seen in Table 2, the adopted helium mass fraction to match observed median He I 5876 is still 89% for Domain 3, which would seem to imply gas mixing for regions in which significant processing beyond helium-burning has taken place. As expected, the nitrogen mass fraction is now well below solar. The deduced carbon and oxygen mass fractions are both about 10 times solar. We note that the O I 6300 line emissivity plotted in Figure 6 illustrates that it arises in a different region from C I 9850, so the inferred, correlated carbon and oxygen mass fractions are not the result of high-optical-depth regions in the emitting gas. This also supports the idea that the C I 9850:O I 6300 line correlations in Figure 9 of Paper 1 result from carbon and oxygen abundances having been produced together by nuclear processing.
The sulfur mass fraction is roughly 4 times solar in this domain where it is hypothesized that oxygen-burning has taken place. Further support for oxygen-burning comes from the high inferred argon mass fraction in this domain, as well as Figure 6 of Paper 1, which shows a very tight correlation between Ar III and S II emission, supporting the idea that sulfur and argon are produced together by the same process. Finally, a correlation shown in Figure 8 of Paper 1 is consistent with the hypothesis that iron-peak nuclei like nickel are produced by “alpha-rich freeze out” (see Woosley & Weaver 1995; Jordan et al. 2003) in Domain 3 regions containing enhanced silicon-group elements from oxygen-burning.
3 SUMMARY AND DISCUSSION
The photoionization calculations presented here, compared with emission-line measurements from Paper 1, are suggestive of three nuclear processing “domains” for gas in the Crab Nebula.
1. Gas with the strongest N II lines has roughly solar nitrogen and oxygen mass fractions, probably a carbon mass fraction less than solar, and significantly less-than-solar sulfur and argon mass fractions. This domain with 89% helium may be largely CNO-cycle processed gas in which modest helium-burning and nitrogen depletion have taken place.
2. The majority of the emitting nebular gas, with N II6583/H in the range 1–2.5, also has 89% helium implied by its median observed spectrum. For this domain, the deduced nitrogen mass fraction is depleted to less than half its solar value. In addition, the carbon mass fraction is about 6 times solar, while oxygen is solar, and sulfur and argon have approximately a third to half of their solar values. It is postulated that this domain represents gas in which significant helium-burning has taken place.
3. The third domain examined here has the highest S II6731 measured line intensities. We find that the inferred helium mass fraction is still comparable with the other domains, and the nitrogen mass fraction is about a fourth of solar. The carbon and oxygen mass fractions are roughly 10 times solar, while the sulfur and argon mass fractions are about 4-6 times solar. This is considered to be a domain in which oxygen-burning has occurred and some mixing has taken place.
Gas resulting from the CNO-cycle and gas with products of oxygen-burning were noted previously (MacAlpine et al. 1996), where the former was assumed to be the primary component due to strong observed nitrogen emission throughout most of the nebula. However, the current computations indicate that strong N II6548,6583 emission does not necessarily imply high nitrogen abundance, whereas strong C I9823,9850 emission from much of the gas does imply high carbon abundance.
The finding of high carbon mass fraction throughout much of the Crab Nebula gas is particularly significant because it suggests that the supernova precursor star had an initial mass 9.5 M⊙. However, it is important to consider whether the near-infrared emission-line measurements presented in Paper 1, and used here, may be biased toward high C I9850 emission. As discussed in Paper 1, the near-infrared data were obtained during non-optimal seeing, and C I measurements were made only where potentially useful S III or C I line-emission could be identified in the two-dimensional, near-infrared spectral images. To investigate the possibility of consequent biasing, we compared the current measurements with C I9823,9850 emission reported by Henry et al. (1984). The ranges of measured 9850 from that study and this one are comparable, with marginally lower and higher values in the larger data set used here. However, we still suspect that the current median spectrum for Domain 2 may be biased toward stronger C I in view of how the measured positions were selected. That having been said, we note that the primary reason for the current finding of high carbon mass fractions is a photoionization calculation whereby we can derive potentially useful carbon abundances from C I emission. Furthermore, even though our 9850 median values may bias the inferred carbon mass fraction for a domain, the individual measurements do imply that carbon-rich gas exists at numerous loctions in the nebula. In any case, a more extensive set of near-infrared spectra would be very useful for understanding the overall nebular carbon.
We should also reflect here on the fact that the photoionization code gave results for plane-parallel geometrical situations, whereas line-emitting gas in the Crab Nebula may be immersed in ionizing synchrotron radiation from all directions. Therefore, we developed algorithms for converting the plane-parallel results to what would be expected for convex cylindrical and spherical clouds. Potentially noteworthy changes in H-normalized lines occurred for only S II6731 and O I6300 emission. In going from plane-parallel to spherical geometry, the computed 6731/H could be reduced by as much as 30%, and 6300/H could be reduced by about 40%.
Because adopted ionization parameters for the photoionization calculations involved matching the observed S III9069/S II6731 ratio, an employed ionization parameter could be slightly lower for a convex spherical geometry. However, we investigated this possibility and found that it would probably not have a significant effect on the conclusions presented here. We also considered whether convex spherical or cylindrical clouds might affect our deduced low sulfur mass fractions for Domains 1 and 2. By using a spherical gometry, we could increase a sulfur mass fraction by perhaps 30%, but it (and that for argon) would still be low in these domains. Finally, we note that Henry & MacAlpine (1982) also reported lower-than-solar sulfur for particular filaments. We believe the low sulfur mass fractions in Domains 1 and 2 to be valid results of this investigation.
References
- Blair et al. (1992) Blair, W. P., Long, K. S., Vancura, O., Bowers, C. W., Conger, S., Davidsen, A. F., Kriss, G. A., & Henry, R. B. C. 1992, ApJ, 399, 611
- Chevalier (1977) Chevalier, R. A. 1977, in Supernovae, ed. D. N. Schramm (Dordrecht: Reidel), 53
- Davidson & Fesen (1985) Davidson, K., & Fesen, R. A. 1985, ARA&A, 23, 119
- Davidson et al. (1982) Davidson, K., Gull, T. R., Maran, S. P., Stecher, T. P., Fesen, R. A., Parise, R. A., Harvel, C. A., Kafatos, M., & Trimble, V. L. 1982, ApJ, 253, 696
- Dennefeld & Andrillat (1981) Dennefeld, M., & Andrillat, Y. 1981, A&A, 103, 44
- Eastman et al. (1985) Eastman, R. G., MacAlpine, G. M., Kirshner, R. P., & Henry, R. B. C. 1985, in The Crab Nebula and Related Supernova Remnants, ed. M. Kafatos & R. B. C. Henry (Cambridge: Cambridge University Press), 19
- Ferland et al. (1998) Ferland, G. J., Korista, K. T., Verner, D. A., Ferguson, J. W., Kingdon, J. B., & Verner, E. M. 1998, PASP, 110, 761
- Fesen & Kirshner (1982) Fesen, R. A., & Kirshner, R. P. 1982, ApJ, 258, 1
- Fesen et al. (1997) Fesen, R. A., Shull, J. M., & Hurford, A. P. 1997, AJ, 113, 354
- Henry (1986) Henry, R. B. C. 1986, PASP, 98, 1044
- Henry & MacAlpine (1982) Henry, R. B. C., & MacAlpine, G. M. 1982, ApJ, 258, 11
- Henry et al. (1984) Henry, R. B. C., MacAlpine, G. M., & Kirshner, R. P. 1984, ApJ, 278, 619
- Hillebrandt et al. (1984) Hillebrandt, W., Nomoto, K., & Wolff, R. G. 1984, A&A, 133, 175
- Jordan et al. (2003) Jordan, G. C., Gupta, S. S., & Meyer, B. S. 2003, Phys. Rev. C., 68, 065801
- MacAlpine et al. (2007a) MacAlpine, G. M., Ecklund, T. C., Lester, W. R., Vanderveer, S. J., & Strolger, L.-G. 2007, AJ, 133, 81 (Paper 1)
- MacAlpine et al. (1996) MacAlpine, G. M., Lawrence, S. L., Sears, R. L., Sosin, M. S., & Henry, R. B. C. 1996, ApJ, 463, 650
- MacAlpine et al. (1989) MacAlpine, G. M., McGaugh, S. S., Mazzzarella, J. M., & Uomoto, A. 1989, ApJ, 342, 364
- MacAlpine et al. (2007b) MacAlpine, G. M., Satterfield, T., & Vanderveer, S. 2007, BAAS, 39, 915
- MacAlpine & Uomoto (1991) MacAlpine, G. M., & Uomoto, A. 1991, AJ, 102, 218
- Nomoto (1984) Nomoto, K. 1984, ApJ, 277, 791
- Nomoto (1985) Nomoto, K. 1985, in The Crab Nebula and Related Supernova Remnants, ed. M. Kafatos & R. B. C. Henry (Cambridge: Cambridge University Press), 97
- Nomoto et al. (1982) Nomoto, K., Sparks, W. M., Fesen, R. A., Gull, T. R., Miyaji, S., & Sugimoto, D. 1982, Nature, 299, 803
- Pequignot & Aldrovandi (1976) Pequignot, D., & Aldrovandi, S. M. V. 1976, A&A, 50, 141
- Pequignot & Dennefeld (1983) Pequignot, D., & Dennefeld, M. 1983, A&A, 120, 249
- Uomoto & MacAlpine (1987) Uomoto, A., & MacAlpine, G. M. 1987, AJ, 93, 1511
- Woosley & Weaver (1986) Woosley, S. E. & Weaver, T. A. 1986, in Nucleosynthesis and Its Implications on Nuclear and Particle Physics, ed. J. Audouze & N. Mathieu (Dordrecht: Reidel), 145
- Woosley & Weaver (1995) Woosley S. E., & Weaver, T. A. 1995, ApJS, 101, 181
- Woosley et al (1980) Woosley S. E., Weaver, T. A., & Tamm, R. E. 1980, in Type I Supernovae, ed. J. C. Wheeler (Austin: Univ. Texas), 96
| Domain 1 | Domain 2 | Domain 3 | ||||
|---|---|---|---|---|---|---|
| Line | Measured | Computed | Measured | Computed | Measured | Computed |
| He I 5876 | 0.26 | 0.27 | 0.28 | 0.26 | 0.28 | 0.25 |
| O I 6300 | 0.40 | 0.41 | 0.32 | 0.34 | 0.58 | 0.44 |
| N II 6583 | 4.5 | 4.8 | 1.6 | 1.9 | 0.50 | 0.52 |
| S II 6731 | 0.64 | 0.66 | 0.85 | 0.82 | 4.0 | 3.6 |
| Ar III 7136 | 0.05 | 0.05 | 0.11 | 0.10 | 0.45 | 0.35 |
| S III 9069 | — | 0.22 | 0.26 | 0.27 | 0.83 | 0.90 |
| C I 9850 | — | 0.04 | 0.45 | 0.45 | 0.74 | 0.70 |
| Domain 1 | Domain 2 | Domain 3 | |
|---|---|---|---|
| Element | Mass Fraction | Mass Fraction | Mass Fraction |
| Helium | 89 | 89 | 89 |
| Nitrogen | solar | 0.35 solar | 0.28 solar |
| Carbon | 0.50 solar | 6 solar | 11 solar |
| Oxygen | solar | solar | 10 solar |
| Sulfur | 0.21 solar | 0.28 solar | 4.2 solar |
| Argon | 0.24 solar | 0.55 solar | 6.0 solar |