Chandra Reveals Twin X-ray Jets in the Powerful FR II Radio Galaxy 3C 353
Abstract
We report X-ray imaging of the powerful FR II radio galaxy 3C 353 using the Chandra X-ray Observatory. 3C 353’s two ″-wide and ′-long jets allow us to study in detail the internal structure of the large-scale relativistic outflows at both radio and X-ray photon energies with the sub-arcsecond spatial resolution provided by the VLA and Chandra instruments. In a ks Chandra observation, we have detected X-ray emission from most radio structures in 3C 353, including the nucleus, the jet and the counterjet, the terminal jet regions (hotspots), and one radio lobe. We show that the detection of the X-ray emission associated with the radio knots and counterknots, which is most likely non-thermal in origin, puts several crucial constraints on the X-ray emission mechanisms in powerful large-scale jets of quasars and FR II sources. In particular, we show that this detection is inconsistent with the inverse-Compton model proposed in the literature, and instead implies a synchrotron origin of the X-ray jet photons. We also find that the width of the X-ray counterjet is possibly narrower than that measured in radio bands, that the radio-to-X-ray flux ratio decreases systematically downstream along the jets, and that there are substantial (kpc-scale) offsets between the positions of the X-ray and radio intensity maxima within each knot, whose magnitudes increase away from the nucleus. We discuss all these findings in the wider context of the physics of extragalactic jets, proposing some particular though not definitive solutions or interpretations for each problem. In general, we find that the synchrotron X-ray emission of extragalactic large-scale jets is not only shaped by the global hydrodynamical configuration of the outflows, but is also likely to be very sensitive to the microscopic parameters of the jet plasma. A complete, self-consistent model for the X-ray emission of extragalactic jets still remains elusive.
Subject headings:
galaxies: active — galaxies: jets — galaxies: individual (3C 353) — radiation mechanisms: nonthermal — X-rays: general1. Introduction
Extragalactic jets constitute the longest collimated structures in the Universe. They transport huge amounts of energy from the nuclei of active galaxies out to kpc or Mpc distances, significantly affecting the properties of the surrounding intracluster/intergalactic medium. Jets have been extensively studied in the radio domain on different scales since the very beginning of the development of modern radio interferometers (Bridle & Perley 1984, Begelman et al. 1984). More recently, the excellent spatial resolution of the Chandra X-ray Observatory (and, to a lesser extent, of other X-ray satellites like XMM-Newton) has allowed us to image large-scale structures in powerful extragalactic radio sources at X-ray frequencies as well, and thus has opened a new era in studying the high energy emission of these objects. More than 100 radio-loud AGNs are now known to possess X-ray counterparts to their radio jets, hotspots or lobes on kpc-to-Mpc scales (e.g., Harris & Krawczynski 2002; 2006, Stawarz 2003, Hardcastle et al. 2004, Sambruna et al. 2004, Kataoka & Stawarz 2005, Marshall et al. 2005a, Croston et al. 2005, Tavecchio et al. 2005, Hardcastle 2006, and references therein). The X-ray emission observed from the extended lobes is well understood and modeled in terms of the inverse Comptonization of the cosmic microwave background photons by the low-energy electrons (IC/CMB; see the discussion in Kataoka & Stawarz 2005, and Croston et al. 2005), providing strong evidence for approximate energy equipartition between the radiating electrons and the lobe magnetic field (with the particle pressure dominating over the magnetic pressure by up to one order of magnitude). However, the origin of the keV radiation detected from the large-scale jets and hotspots is still widely debated and, to some extent, controversial.
The X-ray emission of the terminal regions (the hotspots) of powerful jets is consistent with the synchrotron self-Compton (SSC) emission model, in which radio-emitting electrons accelerated at the terminal shock inverse-Compton-scatter synchrotron radio photons to keV energies (e.g., Hardcastle et al. 2004, Kataoka & Stawarz 2005, and references therein). Modeling of X-rays from this emission process allows us to extract several crucial jet parameters. In particular, the observations imply rough equipartition of the energy densities stored in radiating electrons, , and magnetic field, , and it has been argued that they indicate a dynamical role for non-relativistic protons in the outflow (see Stawarz et al. 2007 for the case of the radio galaxy Cygnus A). On the other hand, the X-ray emission of the hotspots in low-power jets is in disagreement with the predictions of the simple SSC model (see the discussion in Hardcastle et al. 2004). The complex X-ray morphology and spectral character of the broad-band hotspot emission in objects like 3C 227 or 3C 327 suggest instead that we are seeing synchrotron emission from high-energy electrons accelerated continuously in the extended and turbulent jet termination regions (Hardcastle et al. 2007a, Fan et al. 2008). The origin of the bright X-ray knots within the jets themselves (hereafter ‘jet knots’) is also a matter of a debate. In nearby, low-power FR I sources (like M 87 and Centaurus A), the typical radio-to-X-ray spectra of the jet knots are consistent with a single smoothly broken power-law continuum, indicating synchrotron radiation from a single electron population extending up to the highest energies (; e.g., Marshall et al. 2002, Hardcastle et al. 2003). Yet the particular acceleration processes involved, the multi-component character of the high-energy emission, and the main factors determining the spectral shape of the broad-band jet emission, are far from being understood (see the discussions in, e.g., Kataoka et al. 2006, Laing et al. 2006a, Honda & Honda 2007).
The most controversial issue, however, is the origin of the intense X-ray emission detected from knots in powerful quasar jets, such as PKS 0637752 or 3C 273 (Schwartz et al. 2000, Marshall et al. 2001, respectively). Here the X-ray knot spectra are much brighter than expected from a simple extrapolation of the radio-to-optical synchrotron continua, indicating that an additional or separate spectral component dominates the jet’s radiative output at high (X-ray) photon energies. Very often, this emission is modeled in terms of inverse-Comptonization of the CMB photon field by low-energy () electrons (Tavecchio et al. 2000, Celotti et al. 2001), which typically requires highly relativistic jet bulk velocities on kpc-Mpc scales in order to maintain rough equipartition between electrons and magnetic field and to fulfill the minimum power condition. The derived jet bulk Lorentz factors are comparable to those inferred for the pc-scale jets; (Harris & Krawczynski 2002, Sambruna et al. 2004, Marshall et al. 2005a). Unfortunately, the global dynamics of large-scale jets in powerful sources are largely unknown, and different arguments in favor of and against highly relativistic bulk velocities on kpc-Mpc scales (obtained by means of the analysis of the radio or optical jet emission; e.g., Wardle & Aaron 1997, Hardcastle et al. 1999, Scarpa & Urry 2002), are not conclusive. Thus, the IC/CMB model may be considered to be strong support for the idea that these outflows do indeed propagate from sub-pc scales with little energy dissipation, efficiently transporting energy in the form of bulk kinetic motion, and depositing it far away from the active nuclei (Tavecchio et al. 2004; 2007, Sambruna et al. 2006; but see the discussion in Hardcastle 2006). This important conclusion is often claimed to be consistent with the observed one-sideness of the extragalactic X-ray jets detected by Chandra, since jet one-sideness is a simple and natural consequence of relativistic beaming.
On the other hand, if there is significant beaming in powerful jets on large scales, then the detection of bright X-ray jet emission from FR II radio galaxies, which are believed to be analogous systems to radio loud quasars but to be viewed with the jets at large angles to the line of sight, should be considered as unlikely. Such emission has, however, been detected in several objects (e.g., 3C 303, 3C 15, Pictor A, or 3C 403; see Kataoka et al. 2003a,b, Hardcastle & Croston 2005, and Kraft et al. 2005, respectively). Obviously, detection of any X-ray counterjet would be of primary importance in this respect, since it would automatically exclude significant beaming, and thus impose very severe constraints on the jet emission models. In FR I sources, where the emission mechanism is generally supposed to be synchrotron, possible or likely detections of X-ray counterjets have been reported in 3C 270 and Centaurus A (Chiaberge et al. 2003, Hardcastle et al. 2007b, respectively). In the latter case the counterjet detection is almost certain, since extended X-ray emission coincident with the extended radio features in the receding jet rules out a claim that all of the observed X-ray counterparts to the radio counter-knots may be due to chance coincidence of the jet-related radio features with X-ray binaries of the Centaurus A host galaxy. However, in more powerful sources, there has been no definitive counterjet detection to date. Possible counterjets have been reported in the intermediate FR I/FR II object 4C 29.30 (Sambruna et al. 2004), as well as in the broad-line FR II radio galaxy Pictor A (Hardcastle & Croston 2005). In these cases, it is unclear whether the X-ray emission is non-thermal in nature, because with the available very limited photon statistics any detailed spectral analysis is impossible, and in addition it is rather difficult to claim one-to-one morphological correspondence between the X-ray and radio structures (especially since the counterjet in the prototype FR II source Pictor A is not detected at radio frequencies). In X-ray maps of the classical double (narrow-line FR II radio galaxy) Cygnus A, linear features aligned — but not co-spatial — with the radio jet and the counterjet have been noted, but their direct connection with the radio jet plasma is extremely vague (Smith et al. 2002, Steenbrugge et al. 2008). It is then possible that in this, and some other possible X-ray counterjet sources, the aligned X-ray structures on the counterjet side are due to thermal radiation of shocked galactic/intergalactic gas interacting with the jet plasma, as observed in the distant () radio galaxy PKS 1138-262 (Carilli et al. 2002). We note in this context that Cygnus A is located in the very center of a rich cluster environment, while the restarting 4C 29.30 radio galaxy is known to have clear signatures of the interaction between the radio jets and the ambient line-emitting gas (van Breugel et al. 1986, Jamrozy et al. 2007). A clear spatial association between the radio and X-ray jets and the capability to distinguish non-thermal and thermal emission are the key requirements for a convincing counterjet detection in a powerful source.
An alternative to the inverse-Compton model as an interpretation of the X-ray emission of powerful jets involves synchrotron emission from high-energy electrons, which, in order to be consistent with the constraints on optical emission, must often either be characterized by a ‘non-standard’ (concave) energy distribution, or must constitute a separate population to the ones emitting the radio-to-optical continuum. It has been noted that such an electron population can arise due to the continuous and efficient stochastic acceleration processes expected to take place within the extended jet volumes (Stawarz et al. 2004), and will be seen preferentially within turbulent jet boundary layers with significant velocity shear (Stawarz & Ostrowski 2002). A very strong support for the synchrotron hypothesis was recently provided by detailed multiwavelength observations of the jet in the quasar 3C 273 (Jester et al. 2006, 2007, Uchiyama et al. 2006). The observations showed in particular that the X-ray spectra are significantly softer than the radio spectra in most regions of the 3C 273 outflow, and that they are compatible with extrapolating the X-ray power law down to the polarized (and therefore synchrotron in origin) UV/optical continuum. These findings are in strong disagreement with the predictions of the IC/CMB model. In addition, a detailed analysis of the broad-band emission of several other quasar jets supports the synchrotron hypothesis, pointing out an important role of the jet velocity structure (consisting of a fast spine and a slower boundary layer/outer sheath) in shaping the jet high-energy radiation (e.g., Hardcastle 2006, Jester et al. 2006, Siemiginowska et al. 2007). Such jet velocity structure is in fact always seen in numerical modeling of the evolution and propagation of extragalactic relativistic jets (e.g., Aloy et al. 1999, Leismann et al. 2005, Mizuno et al. 2007), since it results inevitably from the non-linear growth of Kelvin-Helmholtz instabilities on the jet surface (see the recent studies by Perucho et al. 2007, Hardee 2007, Meliani & Keppens 2007, and references therein). It is not yet established, however, if the jet boundary layers are indeed the places of the enhanced acceleration of high-energy particles. Nor is the exact velocity profile at the jet boundaries precisely known; in fact, there are reasons to believe it may be far from the widely expected monotonic one, and may even exhibit a sharp increase in the bulk velocity of the outflow at the jet edges (Aloy & Rezzolla 2006, Mizuno et al. 2008). The radiative signatures of such ‘anomalous’ shear layers, in the context of the high-energy emission from extragalactic large-scale jets, were recently investigated by Aloy & Mimica (2008).
Observational studies of the velocity structure of extragalactic jets and its relationship to their broad-band emission are hampered by the difficulties in resolving the outflows transversely, especially at high energies. Detailed radio studies and sophisticated modeling of the polarization and total intensity in the radio of several nearby FR I sources (like 3C 31, NGC 315, or 3C 296; Laing & Bridle 2004, Laing et al. 2006a,b, respectively) do reveal jet radial velocity structures, and indicate that the flatter-spectrum radio regions are indeed often associated with the jet boundary shear layers. Unfortunately, only a few kpc-scale low-power jets, e.g., the one hosted by the radio galaxy Centaurus A, can be resolved at X-ray frequencies by the Chandra instrument. The Cen A observations show interestingly limb-brightened X-ray morphology, but there is no obvious relation with the spectral shape of the synchrotron X-ray continuum (Hardcastle et al. 2003, 2007b, Kataoka et al. 2006, Worrall et al. 2008). In particular, the diffuse component of the Centaurus A X-ray jet is characterized by a constant spectral index across the jet (Kataoka et al. 2006), while the X-ray spectra of isolated knots seem to be steeper within the jet sheath when compared to the X-ray spectra of the knots within the spine (Worrall et al. 2008). Recently, two ‘intermediate’ FR I/FR II jets in the BL Lacertae objects 3C 371 and PKS 2201+44 were also resolved transversely in X-rays (Sambruna et al. 2007). The observations indicated a synchrotron origin of the detected keV photons from all the jet components, and suggested slightly steeper X-ray spectra of the jet edges when compared with the jet spines. Interestingly, the width of the X-ray jets in these two sources is not smaller than the widths of their optical and radio counterparts. Needless to say, no quasar or powerful FR II jet has been resolved till now at X-ray frequencies. This is true even for the particularly bright and wide 3C 273 jet, which, although imaged in detail at optical and radio frequencies (Jester et al. 2005), cannot be resolved transversely at higher photon energies. For this source, however, the limits to the width of the X-ray jet are smaller than the sized measured in the optical and radio bands at the position of the bright knots (Jester et al. 2006), but not necessarily in the interknot regions (see Marshall et al. 2005b).
The FR II radio galaxy 3C 353 provides one of the best-known examples of FR II jets that can be resolved at both radio and X-ray wavelengths. 3C 353 () is the fourth strongest radio source in the 3C catalog, with a total flux density Jy at GHz, and a projected size . It exhibits hotspots and a pair of large-scale FR II-type jets, clearly visible within filamentary lobes (Swain et al. 1998). The jets in 3C 353, constituting about of the entire source luminosity, are well collimated trains of knots with an average width and jet-counterjet radio brightness asymmetry (Swain 1996). Both total and polarized intensity profiles across the jets indicate that the bulk of the jet radio emission is produced at the jet edges, and so presumably within a boundary shear layer (Swain 1996, Swain et al. 1998). Since these jets are among only a very few FR II jets wide enough to be resolved in X-rays, we planned and conducted a deep Chandra observation of 3C 353, in order to investigate the multiwavelength structure of powerful FR II outflows. We report on the results of these observations in the present paper.
| X-ray | associated | nearby | RA (J2000)a | DEC (J2000)a | Net countsb | Significance ()d |
|---|---|---|---|---|---|---|
| jet region | X-ray features | radio knot | ||||
| EJ1 | E21/E23 | J1 | 17 20 29.7 | 00 58 41.6 | 46.97.2 | 13.7 |
| EJ2 | E70/E73 | J4 | 17 20 32.8 | 00 58 26.6 | 12.04.0 | 3.8 |
| EJ3 | E88 | H | 17 20 33.8 | 00 58 23.7 | 32.26.3 | 8.2 |
| WJ1 | W47 | CJ2 | 17 20 25.0 | 00 58 55.1 | 32.06.0 | 10.0 |
| WJ2 | W120a/b | … | 17 20 20.3 | 00 59 09.9 | 12.33.7 | 4.8 |
A complication in X-ray studies of 3C 353 is the X-ray emission from its large-scale environment. 3C 353 is situated at the edge of the cluster Zw 1718.1-0108, which is a complex and dynamic system captured at the moment of an on-going merger (Iwasawa et al. 2000). Based on a ks ASCA observation, Iwasawa et al. reported that this cluster is characterized by a relatively low X-ray luminosity, erg s-1, high temperature, keV, and disturbed morphology, extended over . The small field of view of Chandra, together with the roll angle of Chandra during our observations, prevent us from carrying out detailed studies of the interaction between the radio source and the cluster. Therefore, in this paper we focus solely on the analysis of the non-thermal emission from the nucleus, jets, hotspots and lobes. Analysis of the X-ray emission from the cluster and lobes based on recent XMM-Newton observations is presented in Goodger et al. (2008: hereafter G08); they found slightly different temperatures for the southern and northern parts of the cluster, which supported the idea that these two components were originally separate features that are now undergoing a smooth merger, and also showed that the X-ray emission detected from the lobes of 3C 353 was non-thermal in origin, being consistent with the IC/CMB model prediction for the lobes if the magnetic field strength is slightly below the equipartition value, .
The present paper is organized as follows. In §2, we describe the Chandra observations we performed and the data reduction process, and give a brief overview of the X-ray image we have obtained. A detailed analysis of the jet structures based on the X-ray/radio maps is presented in §3, and spectral analyses of the nucleus, jets, and lobes are given in §4. In §5, we discuss our findings in the context of various jet emission/particle acceleration models. The final conclusions are presented in §6. Throughout this paper we adopt a modern cosmology with , and km s-1 Mpc-1, leading to a luminosity distance of = 131.6 Mpc and a conversion scale of kpc for the 3C 353 redshift, .
2. Observations and Data Reduction
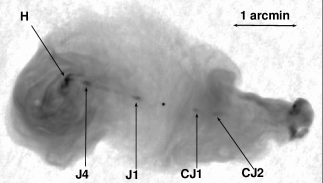
Before going into the details of the Chandra X-ray data, let us first remind the reader of the appearance of the jet of 3C 353 in high resolution radio maps. Figure 1 shows NRAO Very Large Array (VLA) images of 3C 353 produced by Swain (1996). The upper panel is a deep-cleaned L-band ( GHz) image with a resolution (FWHM of restoring convolving Gaussian) of , similar to that of the Chandra X-ray image. The lower panel shows a zoom in on the eastern jet region taken at GHz (X-band; resolution). Full details of the data reduction are described by Swain (1996). Note that the jet is well resolved and clearly extended in the transverse direction, as compared to the unresolved nucleus. Our goal in this section is to find out how the Chandra X-ray image differs from, or agrees with, these radio images and provide one-to-one identification of various jet structures. Although 3C353 is one of the brightest 3C sources, on the parsec-scale it is not as noteworthy. A “snap-shot” Very Long Baseline Array (VLBA) observation at 4.8 GHz only detected the source on the shortest baselines. Fomalont et al. (2000) conclude the core of 3C353 is only 150 mJy, with a size of 15 milli-arcseconds.
3C 353 was observed with Chandra in July 2007 with a total (requested) duration of ks (SeqNum 701549; ObsID 7886, 8565). The source was observed using the standard ACIS-S configuration, where the back-illuminated S3 chip was used to obtain maximal sensitivity to soft photons. After deleting a high background interval at the end of ObsID 7886 (Jul 04 18:22:1618:30:36 UT), the exposure times for the two observations were ks (ObsID 7886) and ks (ObsID 8565), respectively. The active nucleus was at the aim point, resulting in both sub-arcsecond resolution and good spectral sensitivity for the whole jet (including knots, hotspots and lobes). The roll angle was constrained to preclude the possibility that any readout streak from the nucleus ( erg cm-2 s-1; Iwasawa et al. 2000; G08; see also §4.1) could affect the imaging of the jet. Although the imaging capability of the High Resolution Mirror Assembly (HRMA) degrades substantially () for sources more than off-axis111See “Proposers’ Observatory Guide v.10” at http://asc.harvard.edu/proposer/POG/., the jet in 3C 353 extends over about in length, so that the encircled energy for a point source is contained within a diameter of all along the 3C 353 outflows222See, in this context, §3.2, for a detailed simulation using MARX software.. The level-2 data were reprocessed using the CXCDS software CIAO 3.4 and CALDB 3.4.3. We generated a clean data set by selecting the standard ASCA grades (0, 2, 3, 4 and 6) and energy band keV.
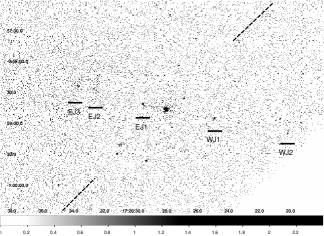
A co-added, raw image of the 3C 353 X-ray jet in the keV bandpass is shown in Figure 2. The dashed lines show the direction of the readout streak of the ACIS-S3 CCD chip, confirming that the bright nucleus does not affect our observations of the jet. The Chandra image shows that the X-ray emission consists of a bright nucleus, jet-knots, hotspots and diffuse emission possibly associated with the East radio lobe. Using a wavelet decomposition source-detection algorithm (wavdetect; Vikhlinin et al. 1995) to detect emission enhancements on angular scales of (wavelet radii of 1, 2, 4, 8, and 16 pixels) with more than significance, we find a total of 31 distinct X-ray sources or enhancements with a signal threshold (the threshold for identifying a pixel as belonging to a source333See http://cxc.harvard.edu/ciao3.4/download/doc/detect_manual/.) in the analysis region on the ACIS-S3 chip444A square region with physical (detector) coordinates 3500DETX4500 and 3600DETY4600, where the nucleus of 3C 353 is at (4086.7, 4131.6).. Among these, the brightest one is the nucleus of 3C 353, but five sources are closely aligned with radio-knots in 3C 353 as marked in Figure 2 (denoted as EJ1, EJ2, EJ3, WJ1, WJ2). The statistical significance of these features are 13.7, 3.8, 8.2, 10.0, and 4.8 , respectively (see Table 1). Most strikingly, the X-ray image clearly shows not only the East (main) jet-knots, but also a bright knot in the West counterjet (WJ1), that seems to be identified with the CJ2 radio knot as given in Swain et al. (1998). Also X-ray emission near the West hotspot region is detected in the image (WJ2).
Since there are some X-ray point sources in the field, it is important to ask whether the the counterjet feature (WJ1) detected in X-rays could just be a chance coincidence with a background or foreground object. Of the 26 sources without radio counterparts in the analysis region, 13 were coincident with optical stars in our Galaxy listed in the USNO-B1.0 catalogue (Monetet al. 2003)555See also http://www.nofs.navy.mil/data/fchpix/ for a Web version of the catalogue., and 13 were unidentified or newly found in this Chandra X-ray observation. We also checked the NASA/IPAC Extragalactic Database666NED; see http://nedwww.ipac.caltech.edu/. and found four galaxies within a radius of 3C 353, but none of these was detected in our Chandra X-ray image. This leads us to conservatively estimate a probability that the X-ray source detected in the vicinity of CJ2 (within radius) is just a chance coincidence (i.e., not related to the jet) is . An even stronger argument for WJ1 being different from the background point sources is that it is well resolved and broader than the point spread function, as we will show in §3.2 (see also Figure 9).
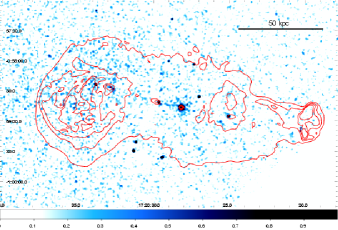
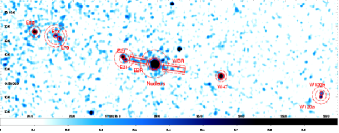
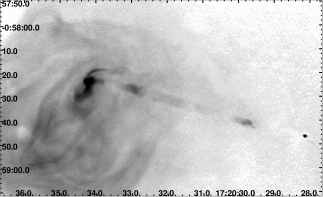
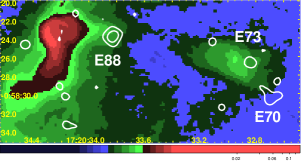
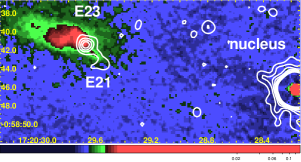
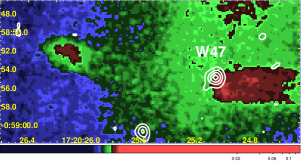
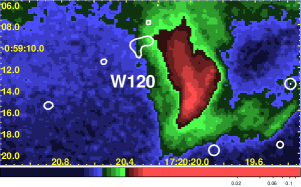
Figure 3 shows an exposure corrected image of 3C 353 in the energy band keV, with GHz radio contours (, , , and mJy beam-1) overlaid. The X-ray image has been smoothed with a two-dimensional Gaussian function with pixels (1 Chandra pixel is ) using DS9 version 4.0. The nucleus is located in the center of the image, and the jet extends to the East (main jet) and the West (counter jet) directions. Figure 4 shows the central region of 3C 353. The East jet (EJ1 and EJ2) shows rather complicated features with multiple enhancements or peaks even inside each source region. We therefore re-examined the source-detection algorithm by running wavdetect with a single wavelet radius, changing its value from 1 to 16 pixels. Interestingly, these jet features were repeatedly detected at various wavelet radii, suggesting that there is relatively narrowly peaked (i.e., point-source-like) emission embedded in an extended component, and/or there is another peak of emission very close to the primary peak. Furthermore, we note that the centroid of each detected regions exhibits a gradual shift as we move to larger wavelet radii, although the positions are in good agreement for background point sources. Unfortunately, the photon statistics are not good enough to fully describe the complexity of the detected jet features. We therefore approximate the EJ1 and EJ2 regions below as a composite of two emission peaks, as indicated in Figure 4 (denoted as E21/E23 and E70/73, respectively). Similarly, the EJ3 and WJ1 regions are denoted as E88, W47 according to the distance from the nucleus of 3C 353 (see Table 1 and Figure 4). A weak but rather complicated X-ray feature (W120 a,b: Figure 4) is also detected near the West (counterjet) termination region, but its nature is not obvious because it is rather close to the edge of the S3 CCD chip in the ACIS-S array. Net photon counts from these jet-related structures, after subtracting the background photons, are given in Table 1. In addition to the bright nucleus and knot-like (jet or hotspot-related) features, we can see weak diffuse emission that bridges the innermost jet knots and the nucleus, and that is only visible in the X-ray image (regions marked as EBR and WBR in Figure 4, detected at the level). No counterpart to this structure was found in the GHz radio map.
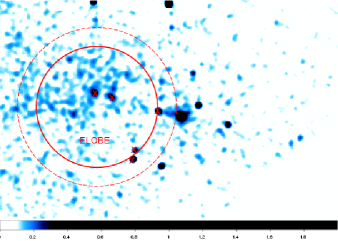
Figure 5 shows a more heavily smoothed image (smoothed with a Gaussian with pixels) of 3C 353. Some excess emission was found at the East lobe region, which corresponds to the detection of this region by G08, but no emission was detected exceeding the background level at the location of the West radio lobe in our Chandra image. This is simply due to the relatively poor photon statistics of Chandra compared to XMM-Newton; the expected flux in the West lobe region is less than a quarter of that of the east lobe region and hence is difficult to detect with our Chandra exposure. Although the primary purpose of this paper is to present the properties of the X-ray emission associated with the 3C 353 jet, we will also briefly present the analysis of the bright nucleus and East radio-lobe in later sections of the paper in order to compare our results with those obtained recently with XMM-Newton (G08).
3. Image Analysis
In order to understand the origin of X-ray emission associated with the 3C 353 jet knots, we first derive the intensity (photon counts) profile of the jet both in the longitudinal and transverse directions, which enables the direct comparison of X-rays from 3C 353 with the high resolution VLA images ( GHz and GHz: Swain et al. 1998). This allows us to study in detail the positional offsets between the radio and X-ray peaks, and differences in the jet width, as measured perpendicular to the main jet axis. Details of the radio/X-ray morphology for different jet features are shown again in Figure 6 (see also Table 1 for the nomenclature of radio and X-ray jet knots).
3.1. Longitudinal Jet Profile: Positional Offset
We first integrated the photon counts in a rectangular region of width around the main jet axis. Then the longitudinal intensity profiles were constructed from to (defined from the east to the west, where represents the position of the nucleus). Figure 7 shows the longitudinal jet profiles thus produced in both radio and X-ray. This profile confirms the detection of jet knots (E21, E23, E70, E73, W47), of X-ray features preceding the radio terminal regions (E88, W120a,b), and finally of excess emission in the East lobe regions. In the radio profiles, the intensity gradually increases toward the terminal hotspots, but the same trend is not so clearly observed in the X-ray intensity profile.
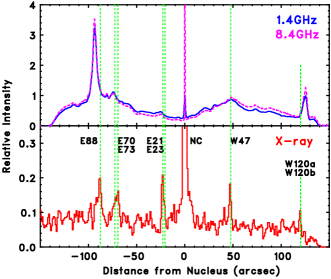
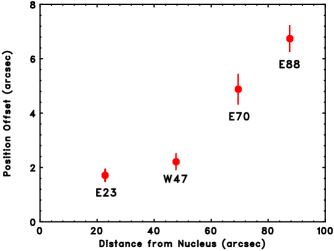
Figure 7 also makes it clear that there are substantial offsets between X-ray and radio knots/hotspots, with the centroids of the X-ray peaks being closer to the nucleus, a phenomenon that has previously been observed in several other jet sources studied with Chandra (see, e.g., Hardcastle et al. 2003; Siemiginowska et al. 2002; but see also Siemiginowska et al. 2007 for the revised analysis using new high S/N Chandra data). Figure 8 shows the positional offset between radio and X-ray peaks of the various jet knots and hotspot as a function of the distance from the nucleus. To measure the offsets we have used the GHz map, since its resolution is , close to the resolution of the Chandra X-ray image. Clearly, the measurements imply a smooth increase of offsets downstream along the jet, which possibly saturates at a maximum value at the East hotspot (E88; , consistent with the value measured using XMM-Newton by G08).777The X-ray feature W120 is not considered to quantitatively estimate an offset, since it lacks any obvious radio counterpart. The maximum observed offset () corresponds to large physical distance ( kpc) at the distance of 3C 353. It is important to mention in this context that there is no apparent mismatch or discrepancy of this trend between the main jet (E23, E70, E88) and counterjet (W47) suggesting the same physical origin for the X-ray production (see §5.2 for detailed discussion). Although the X-ray emission from the hotspot region is coincident with the start of the increase in the radio, the good (i.e., statistically significant) detection of the X-rays is more than upstream from the peak of the radio emission from the East hotspot. There is some weak radio emission closer to E88, so that it is plausible that E88 may not be a direct counterpart of the East hotspot, but rather a jet knot like the E23 and E73 X-ray features. This idea would be supported by the relatively similar spectral energy distributions (SEDs) of various jet knots, as we will see in §4.2. Similarly, the X-ray emission detected near the West hotspot (W120a,b) may not be related directly to the jet-termination structure in the radio. These open issues cannot be addressed even using the excellent resolution of both the Chandra and VLA images.
3.2. Transverse Jet Profile: Jet Width
We next integrate the photon counts across the jet at certain distances from the nucleus to construct transverse intensity profiles of the jets. Here we concentrate on the profiles of the relatively bright X-ray jet knots, E23, E73, and W47, perpendicular to the main jet axis. We define the regions of integration to be small boxes ( along the main jet axis) centered on each jet knot, so as to reduce the contamination from neighboring fainter jet knots, E21 and E70. Figure 9 shows the transverse jet profiles thus produced for (a) E23, (b) E73, and (c) W47 as compared with the corresponding radio intensity profiles taken from the same regions. In each panel, sub-panels show the profiles after subtracting smooth variations of underlying lobe emission. The peak of the intensity profile is normalized to unity in each panel for convenience of comparison of the radio and X-ray profiles.
As discussed in Swain (1996) and Swain et al. (1998), the width of the radio jet in all these figures is much broader than the resolution of the radio map ( for GHz and for GHz). The transverse profile in the radio cannot be well represented by a simple Gaussian function, but instead shows a flat-topped profile which is especially clear in E73 and W47. For quantitative comparison, the width of the jet, at which the intensity becomes half of the maximum (FWHM), are (E23), (E73), and (W47), where the widths are quoted for the GHz and GHz radio maps respectively (see Table 2). This flat-topped profile is characteristic of a situation in which the bulk of the jet radio emission is produced within the jet boundary (shear) layer, especially in the case of the counterjet knot W47 (corresponding to the radio feature CJ2 in Swain et al. 1998).
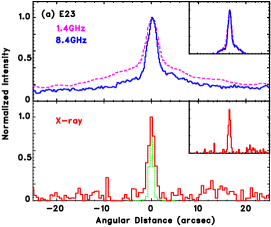
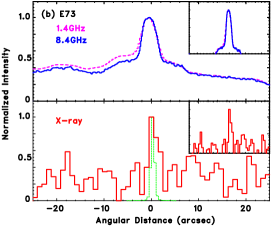
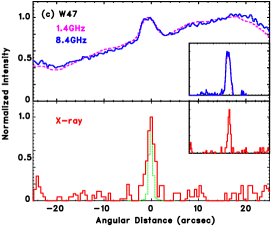
In contrast, the X-ray knots show no evidence for the flat-topped profiles seen in the radio images and are instead well represented by a smooth Gaussian function. To investigate any possible broadening of the point spread function (PSF) at the position of each jet knot, we performed Monte-Carlo simulations888See http://space/mit.edu/ASC/MARX/marx_4.0_manual.pdf. using MARX 4.0. We modeled a point source with a power-law X-ray spectrum with a photon index , modified by Galactic absorption cm-2, as indicated from modeling the observed X-ray spectra of the nucleus and jet knots (see §4.2). The resultant PSF is shown as a dotted green line in Figure 9. The FWHM of the X-ray jet (E23, E73) and the counterjet (W47) are broader than that predicted by the PSF and hence the jet is well resolved in X-rays. In fact, the observed FWHM of the X-ray jets are (E23), (E73), and (W47), respectively, as compared to the PSF width of (Table 2). Although the difference between the radio and X-ray jet widths is still marginal (a effect even for the most significant case, the jet knot W47), these results provide important information about the internal jet structures and the underlying jet physics, as we will discuss in §5.3.
| Name | beams widtha | |||
|---|---|---|---|---|
| GHz/ GHz/X-ray | ||||
| [′′] | [′′] | [′′] | [′′] | |
| E23 | 1.3/0.44/0.92 | 3.16 | 2.66 | 1.650.27 |
| E73 | 1.3/0.44/0.94 | 4.00 | 3.77 | 1.980.48 |
| W47 | 1.3/0.44/0.93 | 3.43 | 3.32 | 1.790.36 |
4. Spectral Analysis
We next present detailed results from the spectral analysis of 3C 353’s nucleus, jet knots and radio lobe. We find that the nucleus shows a complex X-ray spectrum with a heavily absorbed power-law component, while both the jets and radio lobe are well represented by a simple power law moderated by Galactic absorption. We find a smooth variation of radio ( GHz) to X-ray ( keV) flux density ratio as a function of distance from the nucleus for the jet. Finally, the spectral energy distributions of several bright jet knots are presented in order to investigate the origin of the X-ray emission from the counterjet knot W47.
4.1. Nucleus
We extracted the spectrum of the nucleus from a circular region with a radius of , while the background was estimated from a local background region with an annulus of an outer radius of and inner radius of (see also Figure 4). We obtained net photons from the nucleus, combining data from ObsIDs 7886 and 8565. During our Chandra observations, no variability was detected for the nucleus on day-to-week scale with a constant X-ray count rate of cts s-1 in the keV energy band. For the spectral fitting, an accurate estimate of the Galactic absorption () is obviously important. At this point, we note that the column density towards 3C 353 is uncertain, as has already been pointed out in the literature. Iwasawa et al. (2000) adopted a value of cm-2 based on the HI measurements of Dickey & Lockman (1990). The Dickey & Lockman value was questioned by G08, based on the Galactic dust measurements of Schlegel et al. (1998), which would provide a column density of a factor of higher ( cm-2). G08 argued that the true value is likely to lie somewhere between these two extremes; they used their new XMM-Newton data to directly estimate a column density from background sources and found a weighted mean cm-2. In this paper, we follow this ‘latest’ estimate of the value, fixed at cm-2, in our spectral analysis.
| Model | a | b | c | d | e | b | c | (dof) |
|---|---|---|---|---|---|---|---|---|
| [nJy] | [ cgs] | [ cm-2] | [nJy] | [ cgs] | ||||
| PL1 | 0.760.03 | 2.740.13 | 2024 | … | … | … | … | 2.94(221) |
| PL2 | … | … | … | 5.34 | 1.470.13 | 128 | 964 | 1.19(220) |
| PL1+2 | 1.620.13 | 14.3 | 11.21.9 | 6.25 | 1.620.13 | 195 | 1140 | 1.02(219) |
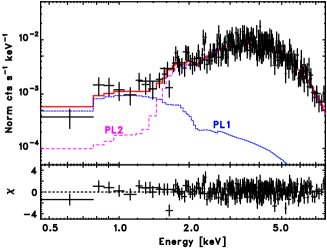
We first attempted to fit the nuclear spectrum with a single power-law function modified by Galactic absorption only. However, the fits were very poor: for degrees of freedom (see Table 3). An attempt to fit with a thermal bremsstrahlung model gave an even worse result, with for degrees of freedom (dof). We therefore fitted a model by adding an intrinsic absorption column density at the distance of the source ( = 0.0304). The fitting statistic was substantially improved, such that for dof, but still unacceptable in the sense that probability is less than (). Hence we adopted a model consisting of a power-law modified by only, plus an another power-law heavily absorbed by an intrinsic . We constrained the photon indices of both power-law components to the same value, so as to reduce the number of free parameters. This model represents the observed X-ray spectra very well, with for dof (). A summary of the spectral fitting parameters are shown in Table3, and the resultant best-fitting spectra are presented in Figure 10.
The power-law indices determined by our Chandra observations are consistent with those reported in G08 using the XMM-Newton data. There are two minor differences in the spectral fitting: (1) G08 determined both power-law indices ( and ) independently when fitting the spectrum, and (2) they added a thermal component ( = 1 keV) to provide a good fit, as was required for some other FR II sources in the study of Hardcastle et al. (2006). Regarding the first point, our constrained fitting is justified because G08 obtained nearly equal best-fitting parameters for both power-law indices, and , which are very close to our best-fitting value of (Table 3). Furthermore, our best-fitting value for the intrinsic column density, cm-2, is perfectly consistent with that determined using XMM-Newton ( cm-2). Although thermal emission is included in the G08 fit to the XMM-Newton data, it contributes less than of flux in the energy range between and keV (see Figure 4 of G08) and in any case may well have originated on scales larger than our Chandra extraction region given the much larger XMM-Newton PSF. We therefore do not regard the differences between the spectral models used as in any way significant.
Using our model, we determine the absorption corrected luminosity in the keV band for the heavily absorbed nucleus (PL2) is erg s-1. This is only lower than that reported for the XMM-Newton observations during the August 2006 and February 2007 observations ( erg s-1), suggesting only minor variability of the nucleus on a timescale of a year. By using the ASCA data, Iwasawa et al. (2000) reported a factor of two larger luminosity in the same keV band ( erg s-1; corrected for modern cosmology with with , and km s-1 Mpc-1) in their observations taken a decade earlier, in September 1996. We suspect that contamination from the neighboring cluster Zw 1718.1-0108 may be partly the reason for this diagreement, since the PSF of ASCA () is much larger than that of either XMM-Newton or Chandra, but it probably also indicates some real long-term variability in the AGN X-ray output.
4.2. Jet and Hotspots
We next carry out a spectral analysis of various structures (including jet knots and hotspots) related to the 3C 353 jet. The areas indicated by solid lines in Figure 4 mark regions from which spectra of the X-ray emission were extracted, while background spectra were extracted using the dashed regions. Parameters of the source extraction regions (distance from the nucleus to the center of the region, and source radius), as well as the results of spectral fitting, are summarized in Table 4. Due to the limited photon statistics, we binned the X-ray spectrum into three energy bands for both observations (ObsIDs 7886 and 8565): keV, keV and keV. A power-law function absorbed by the Galactic column density (fixed to cm-2; see above) gives acceptable fits with probability for or dof. The spectral photon index was fixed at to match the radio photon index, except for the relatively bright jet knots E23/W47 and hotspot E88. (The photon index determined for these bright jet knots is consistent with within the confidence range.)
| Name | Distancea | Regionb | Net countsc | d | e | g | (dof) |
| [′′] | [′′] | [nJy] | [ cgs] | ||||
| main jet | |||||||
| EBR | 11.9 | [12, 3] | 19.06.6 | 1.7f | 0.240.09 | 1.560.61 | 0.86(5) |
| E21 | 20.6 | 1.2 | 10.23.5 | 1.7f | 0.090.04 | 0.570.24 | 0.78(5) |
| E23 | 22.8 | 1.2 | 36.26.2 | 1.81 | 0.420.09 | 2.600.47 | 0.84(4) |
| E70 | 69.5 | 1.5 | 11.84.0 | 1.7f | 0.120.04 | 0.800.29 | 0.63(5) |
| E73 | 72.6 | 1.5 | 9.83.7 | 1.7f | 0.080.04 | 0.500.24 | 0.69(5) |
| E88 | 87.6 | 1.5 | 25.85.7 | 1.79 | 0.240.08 | 1.46 | 1.64(4) |
| ELOBEh | 83.6 | 60 | 62071 | 2.17 | 8.82 | 45.6 | 1.32(12) |
| counter jet | |||||||
| WBR | 14.1 | [16, 3] | 20.06.3 | 1.7f | 0.240.08 | 1.590.54 | 0.74(4) |
| W47 | 47.7 | 2.0 | 37.96.6 | 1.220.33 | 0.310.09 | 2.88 | 1.08(4) |
| W120ai | 120.3 | 1.2 | 10.23.5 | 1.7f | 0.090.04 | 0.590.23 | 0.54(5) |
| W120bi | 120.1 | 1.2 | 7.23.0 | 1.7f | 0.070.03 | 0.430.23 | 0.78(5) |
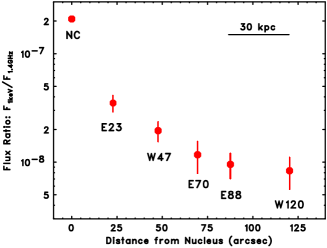
Figure 11 shows the variation of flux density ratio measured between keV and GHz, , as a function of distance from the nucleus. Clearly the X-ray-to-radio flux ratio decreases downstream along the jet, as is often (though not always) observed in many other radio sources (see §5.3.2). Remarkably, this is true even for the counterjet. Although X-ray counterjet detections were only made for W47 and, possibly, W120a,b, we believe this to be due to the limited sensitivity of Chandra even with our deep ks exposure. In fact, the detection limit for this observation corresponds to a flux limit nJy. Thus, assuming the jet-counterjet radio brightness asymmetry (Swain 1996) is also valid for the X-ray counterparts, most of the X-ray emission from the counterjet is not expected to be detected, with the exception of the brightest counterjet knot W47. We note that the flux ratio of the nucleus (; absorption corrected) is much larger than that for the jet-related structures. This is not surprising, given that the heavily absorbed component of the nuclear X-ray emission is believed to be dominated by the accretion disk corona, while the nuclear radio flux is supposed to be produced by the unresolved, self-absorbed inner portions of the jets.
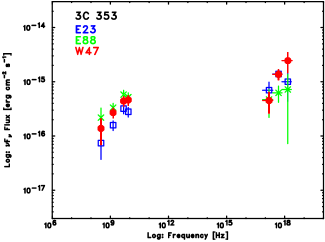
Finally, we constructed the spectral energy distributions of the bright jet knots E23, W47 and hotspot E88. For this, we took exactly same source regions for the radio and X-ray as defined in Figure 4. We derived multi-frequency radio spectral information using radio maps obtained at four different frequencies between MHz and GHz (adapted from Swain et al. 1998 for GHz, GHz images, and G08 for MHz and GHz radio maps). Since the resolutions of the radio maps are different at these frequencies and the contamination from the lobe is non-negligible, we made several trials assuming different choices of background regions. We estimate that the uncertainty in the radio flux measurements is typically , but this is not important for the discussion below. As before, the X-ray data were binned in three energy bands to reduce the statistical uncertainty; keV, keV, and keV, respectively. Figure 12 compares the spectral energy distributions (SEDs) thus produced, and shows that the overall spectral features are remarkably similar to each other, suggesting that the same physical process is at work for the X-ray production in the E23, E88 and W47 knots. Except in the case of W47, the X-ray spectral index obtained with Chandra is perfectly consistent with the radio synchrotron power-law slope (radio spectral index ). The X-ray spectrum of W47 seems to be slightly harder, but this is only a effect. One may note, however, that the X-ray spectral points cannot be connected smoothly with the extrapolation of the radio data, whether we assume either a single or a broken power-law form for the radio-to-X-ray continuum.
4.3. Lobe
Finally we consider the X-ray emission from the East radio lobe, for which the previous XMM-Newton observations confirm substantial diffuse emission (G08). We do not consider the West radio lobe since its emission was too weak to be detected within our Chandra exposure (see §2). The areas indicated by the solid line in Figure 5 mark the region from which the spectrum of the lobe X-ray emission was extracted (a circle of centered on RA=17:20:33.694, DEC =-00:58:37.77), but excluding the inner jet knots (E21/23, E70/73), hotspots (E88) as well as background point sources (marked as crosses) — these were approximated as circles of each. The dotted line shows a region of the background extraction with , excluding some background point sources. As discussed in detail by G08, the background emission from the cluster environment is the primary contributor to the uncertainty in the lobe flux density. We therefore adopted exactly the same regions for both the source and background extraction regions as those that were assumed for the XMM-Newton data analysis, enabling a direct comparison of the results.
A power-law model gave better fits than a thermal bremsstrahlung model, with for dof, for the East lobe (see Table 4). The best-fitting photon index was , which is consistent with that determined from the XMM-Newton data analysis (; G08). The measured keV flux density of the east lobe is nJy, which is slightly smaller than, but consistent within the error with, that determined from the XMM-Newton analysis ( nJy; G08). The origin of the possible (but small) discrepancy, however, is clear. In G08, only the contamination from the East hotspot (E88) was excluded to estimate the lobe X-ray emission because the remaining jet features (E21, E23, E70, E73) were not resolved from the diffuse lobe emission with the imaging capability of XMM-Newton. As seen in Table 4, integration of keV flux densities for E21, E23, E70 and E73 gives nJy in total, and hence we can account for a substantial fraction of the difference between the Chandra and XMM-Newton fluxes. Thus we conclude that the Chandra data confirm the detection of non-thermal X-ray emission from the East lobe of 3C 353 and the measurement of its parameters by G08.
5. Discussion
In the previous sections, we have shown that X-ray emission has been detected from the knots of both the jet and the counterjet of the radio galaxy 3C 353. As argued below, this emission is most likely non-thermal in origin. This is in fact the very first clear X-ray detection of an extragalactic counterjet (or, more accurately, of isolated counterjet knots) reported in the literature for a powerful FR II-type source (see the discussion in §1). We have shown (i) that the X-ray knots seem to be narrower than their radio counterparts, (ii) that the X-ray-to-radio flux ratio decreases downstream along the jets, and finally (iii) that the intensity maxima of the X-ray jet features are placed closer to the nucleus than the intensity maxima of the nearest radio components (and that these offsets are significant). Moreover, thanks to our deep ks Chandra exposure, the other components of 3C 353 have been successfully detected as well, including the nucleus and the extended East lobe. The nucleus and lobes will briefly be discussed further in §5.1 and §5.2 respectively, but since our major findings above are all related to the jets, the remainder of the paper mostly focuses on the interpretation of the observed X-ray jet emission. Before this, however, let us comment on the question of whether 3C 353 is indeed representative of other quasar/FR II jet sources.
5.1. Is It Indeed An FR II Source?
There are some reasons one might suspect that 3C 353 is not representative of other powerful FR II-type jets. First, 3C 353 is located in the outskirts of a merging cluster, which is not a typical environment for classical doubles or radio loud quasars. Second, one may note the apparent lack of the X-ray signatures for the cavity inflated in the cluster medium by the expanding lobes of 3C 353, like those observed in, e.g., Cygnus A (Smith et al. 2002). And third, the particular morphology of the radio hotspots in the discussed object might be thought to be unusual for an FR II radio galaxy: the East (main jet) hotspot is located in the middle — and not at the edge, as expected — of the fat East lobe, while the counterjet terminates in the elongated West lobe without forming a ‘classical’ hotspot, but instead splits into a mushroom-shaped vortex ring (see Figure 1). This type of jet morphology might rather be thought to resemble the ‘inner hotspots’, or ‘flaring regions’ observed in Narrow Angle Tailed (NAT) sources at the point where the substantially curved jets suddenly lose their collimation but continue to propagate away from the nucleus rather than terminating and forming backflow (see in this context Eilek et al. 2002). Interestingly, NAT sources are typically (exclusively) located in the outskirts of rich clusters. We therefore considered the possibility that 3C 353 is a NAT radio galaxy observed in projection, with the line of sight being almost in the jet bending plane.
The first reason to doubt the above interpretation is the very low probability that the line of sight would be exactly in the plane in which the NAT jet was bending. With any other orientation of the source in the sky, one should expect to observe some gradual curvature of the 3C 353 outflows, or at least some misalignment between the jet and the counterjet axes. By contrast, the jets in 3C 353 are very straight all over their lengths. As for the jet misalignment, we have carefully investigated the available radio maps, and found only a small difference between the two axes: if a line is drawn from the nucleus out to follow the West jet, and another from the nucleus to follow the East jet, the position angles of the lines differ by . If, instead, we aim for similar size ellipses, one fitting the hotspot region at the end of the counterjet and the other (of the same size) fitting the brightest jet termination feature of the main jet, the lines differ by only. The other problem is that the jets in NAT sources are of the FR I type, while both the jets in 3C 353 — extremely well collimated outflows with a half-opening angle — are clear examples of the type of jets seen in FR IIs (Swain 1996, Swain et al. 1998). Also, the apparent lack of any signatures for the X-ray cavity inflated in the ambient medium by the expanding lobes may be explained if 3C 353 is in reality located in front of or behind the cluster mid-plane, as was argued by G08 based on an analysis of pressure balance; even if the source were in the plane of the cluster it is unlikely that a strong cavity signature would be observed at the observed distance from the cluster center. Finally, the recessed hotspot observed in the East lobe of 3C 353 is not particularly unusual for classical doubles (Mullin et al., submitted).
There are also many positive reasons for believing 3C 353 is a fairly typical FR II object, and here we briefly summarize them: (i) the total radio power of 3C 353, W Hz-1, is an order of magnitude above the borderline between FR Is and FR IIs (Fanaroff & Riley 1974); (ii) the spectral properties of the X-ray nucleus in 3C 353, in particular a large intrinsic absorbing column density cm-2 (see §4.1 and G08), are typical to what is observed in powerful narrow line radio galaxies, i.e. classical doubles with narrow ionization lines999However, as noted by G08, the X-ray-to-radio flux ratio of the 3C 353 nucleus is much lower than observed in other narrow line radio galaxies (NLRGs), and is more consistent with what is seen in low-excitation radio galaxies (LERGs), so that the nature of 3C 353’s nucleus in the X-ray remains ambiguous. Many LERGs exhibit FR II large-scale radio morphology.; (iii) the position of 3C 353 in the host (optical) luminosity–radio luminosity domain is consistent with classifying 3C 353 as an FR II source (Swain et al. 1998); (iv) the detection of inverse-Compton X-rays from the lobes of 3C 353 is consistent with what is typically seen in other classical doubles (see §4.3 and G08). Thus, we conclude that 3C 353 should be considered as representative of the class of powerful jet sources, including both radio-loud quasars and FR II radio galaxies.
5.2. Origin of the Observed X-ray Emission
Although the constructed three-band X-ray spectra for the jet knots (§4.2) are consistent with power-law emission, a thermal origin of the detected X-ray features cannot be ruled out by means of spectral analysis, because of the limited photon statistics. In fact, one can fit the X-ray data for these knots with a thermal model (bremsstrahlung radiation), although the derived gas temperature is not well constrained. We therefore begin this section by checking whether the global parameters implied by a thermal interpretation are realistic.
The bolometric bremsstrahlung luminosity of a hypothetical source with volume and number densities of electrons and ions and , respectively, assumed to be characterized by a single temperature , is
| (1) |
where all the quantities are expressed in cgs units (Blumenthal & Gould 1970). If we assume keV (which is close to the temperature of the Zw 1718.1-0108 cluster; Iwasawa et al. 2000; G08), and consider a completely ionized thermal hydrogen plasma () uniformly distributed within the spherical volume of the radius kpc (as appropriate for, e.g., the W47 knot; see Table 4), then we find erg s-1. The observed keV luminosity of the W47 knot is erg s-1. This, in the framework of the thermal model, would imply a number density of the thermal gas cm-3, which is much higher than what is expected for the thermal gas density at the edge of the cluster. In addition, the corresponding thermal pressure of the hypothetical X-ray emitting cloud, erg cm-3, would be about two orders of magnitude higher than the non-thermal pressure of the lobe, erg cm-3, as estimated below. The presence of such a highly overpressured dense cloud of a hot gas, with a total mass of , within the lobes of a powerful radio galaxy and close to the radio jet, seems highly unlikely. We also emphasize that a clear discontinuity in the polarization properties of the jet, due to the rotation measure associated with the cloud ( rad m-2 rad m-2, for an expected magnetic field component parallel to the line of sight within the cloud G), although not large, should have been observable in the detailed analysis of the radio polarization maps presented by Swain (1996) and Swain et al. (1998), but was not seen. Finally, we note that decreasing the assumed gas temperature (in order to reduce the pressure of the postulated X-ray emitting cloud) would cause the derived gas number density, the total mass of the cloud, and the rotation measures to increase still further. Therefore, we rule out a thermal interpretation, and conclude that the X-ray emission of the jet-related knots detected by Chandra is non-thermal in origin.
As can be seen in Figure 12, the overall spectral energy distributions of different knots in 3C 353 are similar to each other, suggesting that the same physical process is responsible for production of the observed X-ray emission from the jet and the counterjet; thus, in what follows, we attempt to find a single emission process that can explain all the observations. In addition, as we have noted above, the X-ray spectra of all the knots are inconsistent with simple extrapolations of the radio (synchrotron) continua. In this situation, as discussed in §1, the X-ray emission may be synchrotron emission from a second electron population, or it may be some form of inverse-Compton emission. Since the X-ray/radio morphology of the 3C 353 jet knots, discussed in more detail in the next sections (in particular, the large positional offsets between the X-ray and radio intensity maxima, as well as the differences in the X-ray and radio jet widths), exclude any significant contribution of the synchrotron self-Compton (SSC) process to the observed X-ray radiative output, we do not consider the SSC process further. Instead we focus our examination of inverse-Compton processes on the IC/CMB model (§1). In core-dominated quasars, the spectral behavior seen in the jet and counterjet knots of 3C 353 is often believed to be a manifestation of the IC/CMB component dominating the observed X-ray emission, with corresponding high bulk Lorentz factors (Sambruna et al. 2004, Marshall et al. 2005). We will argue below that this cannot be the case in 3C 353, which substantially weakens the case for adopting the model in analogous FR II/quasar jet sources.
We begin by briefly discussing the global energetics of the 3C 353 jets, by utilizing our Chandra detection of the non-thermal X-ray emission from the East radio lobe (see §4.3 and ELOBE in Table 1), which is consistent with what was derived from the XMM-Newton data (G08). First, we measure the radio fluxes of the East lobe taking the same extraction region as for the Chandra/XMM-Newton flux measurements, obtaining Jy, Jy, Jy, and Jy, respectively for MHz, GHz, GHz, and GHz radio maps. This corresponds to a radio spectral index of . Assuming a spherical volume with a radius kpc (corresponding to ; see §4.3), the equipartition magnetic field strengths for the East lobe is G (e.g., Kataoka & Stawarz 2005)101010See equation (3) in Kataoka & Stawarz (2005), with minor changes made to mimic the IC/CMB model presented in G08 and Croston et al (2005). In particular, we assume here a broken power-law electron distribution with initial electron energy index , and the minimum electron Lorentz factor .. By assuming that all the lobe X-ray emission is due to inverse-Comptonization of the cosmic microwave background photons, the measured flux densities imply a magnetic field strength G. Therefore, the equipartition magnetic field intensity exceeds the value measured for the East lobe by a factor 2. This result is indeed in a very good agreement to what is observed in other FR II sources (see Croston et al. 2005, Kataoka & Stawarz 2005, and references therein) and consistent with what was measured by G08. Assuming further equal energies stored in the non-thermal electrons and protons, the total energy density of the 3C 353 lobes is erg cm-3. The total volume of the lobes is cm3. This gives a total energy erg, which is in fact a lower limit only. Finally, we estimate the radio source lifetime to be yrs, which corresponds to the observed jet length and the assumed advance velocity of the jet termination region , as appropriate for a typical FR II radio galaxy (see, e.g., Machalski et al. 2007). This constrains the jet kinetic power in the 3C 353 radio galaxy to be erg s-1.
The above order-of-magnitude calculations allow us to estimate the jet magnetic field, , by minimizing the total kinetic luminosity of the 3C 353 jets, (the sum of the kinetic powers carried by the jet protons, electrons, and the magnetic field, respectively), for a given jet synchrotron emission (Ghisellini & Celotti 2001). In particular, with , where kpc is the jet radius (Swain et al. 1998), is the jet bulk Lorentz factor, and is the comoving energy density of the jet magnetic field, one obtains
| (2) |
which is very close to the standard equipartition value (Swain 1996). From this, one may find the observer-frame ratio of the IC/CMB and synchrotron luminosities as
| (3) |
Here, erg cm-3 is the jet comoving energy density of the CMB radiation, erg cm-3 (see equation 2), and is the jet Doppler factor.
Based on their models of the jet total intensity and polarization profiles, Swain et al. (1998) constrained the jet inclination to the line of sight in 3C 353 to be ; these large angles to the line of sight are strongly supported by the observed two-sidedness of both the radio and X-ray jets. Accordingly, we can approximately substitute in equation 3, obtaining the observed luminosity ratio independently of the jet kinematic factors. The resulting value, , is in strong disagreement with the observed X-ray-to-radio luminosity ratio (see Figure 12). Note, that in the framework of the IC/CMB model with large jet inclinations such that , the electrons producing inverse-Compton emission at the observed keV photon energies have Lorentz factors , i.e., almost exactly the same as the electrons producing synchrotron photons at the observed GHz frequencies, , so one can write . Thus, we conclude that the IC/CMB model cannot explain the observed X-ray emission of the 3C 353 jets, unless very large departures from energy equipartition, G, are invoked. Such large deviations from the minimum power condition are not expected in the case of large-scale extragalactic jets (see in this context Stawarz et al. 2005, 2006) and they would imply very high total energy densities in the jet.
The only possibility left is therefore that the observed X-ray emission of 3C 353 results from the synchrotron radiation of some flat-spectrum high-energy electron population, most likely separate to the one producing the observed radio emission. The required Lorentz factors of the electrons emitting synchrotron photons with the observed keV energies are (assuming the scaling of the magnetic field as given in equation 2 above and, again, ). It has already been shown that stochastic acceleration processes taking place in large-scale extragalactic outflows may easily account for the production of electrons with these Lorentz factors (Stawarz & Ostrowski 2002, Uchiyama et al. 2006) and they are already invoked to explain observations of the hotspots of FR II sources and the jets of FR Is (§1). In the following section, by discussing in detail the X-ray/radio morphology of the 3C 353 jets, we aim to constrain several other aspects of the synchrotron scenario.
5.3. Radio/X-ray Jet Morphology
Before discussing in more details the radio/X-ray morphology of the 3C 353 jets, it is useful to summarize the main results of the extensive radio studies carried out on this source by Swain (1996) and Swain et al. (1998). By means of detailed modeling of the intensity and polarization properties of the jets in 3C 353, these authors concluded that:
-
•
most of the observed radio emission from the jet (as well as from the counterjet), is produced within the outer sheath of the outflow/jet boundary layer with a velocity shear; the contribution from the central jet spine is negligible;
-
•
the magnetic field within the jet boundary layer has no radial component, , but only random axial and toroidal components in equipartition, , both ordered by a velocity shear; the axial component of the magnetic field within the jet spine is negligible;
-
•
the outer sheath and the jet spine have constant half-opening angle all along the outflow, such that the radius of the spine is roughly half of the total jet radius kpc;
-
•
jet models with ordered large-scale magnetic field (helical structure, transverse flux ropes, etc.) cannot account for the observed flat-topped synchrotron intensity profiles across the jets and, at the same time, for the symmetric polarization profiles with measured degree of linear polarization .
5.3.1 The Widths of the Radio and X-ray Jets
As described in §3.2 of this paper, we have found that the X-ray knots in 3C 353 are possibly narrower than their radio counterparts (which are also situated further away from the active nucleus). This agrees with what is observed in powerful quasar jets detected by Chandra: the limits to the width of the (transversely unresolved) X-ray knots in these systems are always slightly smaller than the measured sizes in the radio band, and sometimes even in the optical band (Jester et al. 2006, 2007). In the framework of the IC/CMB model involving significant beaming, one would argue that since the comoving energy density of the CMB photons is proportional to the square of the bulk Lorentz factor of the emitting plasma, , the comoving IC/CMB emissivity of the slower jet boundary layer should be much smaller than the analogous emissivity of a fast jet spine, resulting in the X-ray jet being narrower than its radio/optical counterpart (for a fixed magnetic field energy density throughout the outflow). However, as discussed in the previous section, the detection of the X-ray counter-knot in 3C 353 and the established large inclination of this source exclude the IC/CMB model: only the synchrotron model is viable to explain these features. Thus, the observations imply that the presence of high-energy electrons producing the observed synchrotron X-ray jet emission must be restricted to the central spine of the jet rather than to the jet boundary layer, at least in the upstream portions of the bright knots, if our findings regarding the widths of the X-ray jet features are correct. We speculate that such a difference may be due to the different configurations of the small-scale magnetic field within different parts of the radially stratified outflow, as discussed by Swain et al. (1998).
It should be borne in mind, however, that with the current data the signal-to-noise ratio of the Chandra X-ray maps of 3C 353 is rather poor, and therefore all conclusions regarding the width of the X-ray jets in this object, or rather of the isolated jet knots, should be taken with extreme caution. Also, we emphasize that the multiwavelength structures and spectra of bright knots in other well-studied jet sources (3C 273, Centaurus A) do not necessarily correspond directly to the multiwavelength morphology and spectral properties of the interknot regions (Marshall et al. 2005b, Kataoka et al. 2006, Hardcastle et al. 2007b), but that it is the interknot regions (rather than the bright knots) that reflect closely the global, possibly stratified morphology of the outflow. Finally, the poorly known internal structure of the boundary layer in relativistic jets may be much more complicated than what is typically assumed, resulting in several non-intuitive radiative properties of the jet plasma (see in this context Aloy & Mimica 2008).
5.3.2 Decrease of the Flux Ratio Along the Jets
In the case of the jets in 3C 353, we observe a systematic decrease of the ratio along the outflow (see §4.2 and Figure 11). Similar behavior is observed in many (though not all) quasar jets detected by Chandra (e.g., Sambruna et al. 2004, Marshall et al. 2005a, Hardcastle 2006, Siemiginowska et al. 2007). In the framework of the IC/CMB model for the X-ray jet emission, it has been suggested that this behavior results from a smooth deceleration of the outflows on kpc-Mpc scales due to gradual mass entrainment (Georganopoulos & Kazanas 2004, Tavecchio et al. 2006). As pointed out by Hardcastle (2006), this idea faces several difficulties in explaining the multiwavelength morphology of powerful jets, and here we briefly summarize the arguments given: (i) no trend for the gradual bulk deceleration is observed in large-scale radio jets of FR II sources, but if only the jet spine is to be decelerated, the model should explain why the jet boundaries do not respond to the involved dramatic changes in the jet/spine kinematics; (ii) the amount of cold matter required to be entrained, and thus to decelerate powerful quasar jets, is in some cases too high when compared to the upper limits on the masses of the surrounding thermal gas. As discussed previously, the IC/CMB model is excluded in the case of 3C 353. On the other hand, in the previous subsection we have argued that the X-ray morphology implies that the synchrotron X-ray emission is associated with the faster jet spine rather than with the slower jet boundaries. Could the observed systematic decrease of the flux ratio therefore nevertheless be connected with a smooth jet/spine deceleration?
It is important to remark again in this context that the jets in 3C 353 are extremely well collimated all over their lengths, with a constant half-opening angle , and constant jet/counterjet brightness asymmetry ratio . This is in agreement with what is observed in other FR IIs: no evidence for gradual jet deceleration is provided by the jet radio morphology (Hardcastle 2006). Moreover, as pointed out by Swain et al. (1998), the fact that the boundary layer seems to be always restricted to the same parts of the outflow (i.e., that the boundary shear layer does not spread/expand toward the jet axis), coupled with the constancy of the observed level of linear polarization along the jets and the absence of radial component of the magnetic field, indicate that no large-scale turbulent eddies associated with mass entrainment are present in the 3C 353 jets. Since it is the jet boundary shear layer which mediates interaction of the jet with the surrounding medium, the absence of changes in the shear layer implies that there is no reason for the jet spine to decelerate. Thus, we must conclude that systematic mass entrainment on scales of tens of kpc is unlikely to be of any importance, at least in 3C 353. The only remaining possibility is thus that the particle acceleration conditions associated with microphysical plasma parameters — rather than with the global hydrodynamical configuration of the outflow — change within the central parts of the jets. Because those regions of the jet dominate the jet radiative output at X-ray frequencies but produce negligible radio emission when compared to the jet boundaries, the ratio of the observed X-ray and radio fluxes decreases systematically along the jet in 3C 353 and in other analogous systems. We might for example speculate that a gradually decaying chaotic component of the magnetic field in the jet spine leads to a lower efficiency in the acceleration (due to, e.g., magnetic reconnection processes) of the highest-energy electrons.
5.3.3 Positional Offsets Between the X-ray and Radio Knots
The apparent positional offsets between the intensity maxima of the X-ray and radio knots, as reported in this paper for 3C 353, are observed in several other jet sources detected by Chandra (see, e.g., Siemiginowska et al. 2007). As discussed by Hardcastle et al. (2003), they cannot be explained by simple models involving particle acceleration at a single extended shock front, which just exploit the difference between the cooling timescales for the electrons emitting synchrotron X-ray and radio photons (Bai & Lee 2003). In a wider context, the problem of such offsets relates directly to the question on the nature of the jet knots: are they separate moving portions of the jet matter, or rather stationary features produced by, e.g., reconfinement shocks? We note that formation of reconfinement shocks in relativistic outflows has recently been widely discussed in the context of the inner ( kpc) jets of -ray emitting blazars and radio galaxies (e.g., Jorstad et al. 2001, Cheung et al. 2007, Levinson & Bromberg 2008). Reconfinement shocks have been proposed to explain the global morphology of kpc-scale FR I jets (Laing & Bridle 2002), and also — which is the most interesting in the context of our discussion — the almost regularly spaced knots in FR II jets on scales of tens to hundreds of kpc (Komissarov 1994, Komissarov & Falle 1998). On the other hand, the frequency independence of the longitudinal profiles of the knots in the quasar jets observed by Chandra, among other observed jet properties, has led several authors to conclude that knots are instead separate moving portions of the jet with excess kinetic power, produced by intermittent or modulated activity of the central engine (Bridle et al. 1986, 1989, Clarke et al. 1992, Stawarz et al. 2004).
The results of the analysis of the radio data for the 3C 353 jets presented by Swain et al. (1998), in particular the reported constant opening angle of both the jet spine and the jet boundary layer, is hard to reconcile with the expected ‘diamond structure’ of the successive reconfinement shocks discussed by Komissarov & Falle (1998). In addition, the reconfinement shock scenario does not predict in a natural way the frequency-dependent position of the intensity maxima of the radiating plasma. Clearly, this problem cannot be addressed fully in our qualitative discussion, since detailed numerical simulations are needed to understand the complex structure of the reconfinement shocks in large-scale mildly-relativistic outflows. However, we believe that a more likely explanation for the observed X-ray/radio positional offsets can be given in the framework of the model in which knots are moving portions of the jet matter. For example, one may propose that portions of the jet produced by the central engine during a more active period, and hence characterized by excess kinetic power and/or higher bulk velocity, propagate within the ‘stationary’ (slower) outflow corresponding to the quasi-quiescent state of the active nucleus. Since the bulk velocities of the jet plasma are expected to be supersonic (although not necessarily ultrarelativistic), a double-shock structure is expected to form, due to collisions of the faster portions of the jet matter with the slower outflow.
Let us consider a model in which the forward shock propagating in the slower outflow (and thus characterized by a highly oblique geometry at the jet boundaries) is responsible for the brightening of the outer portions of the jet at radio frequencies (due to compression of the jet magnetic field, driving the turbulence, etc.), while the reverse shock propagating within the faster portion of the jet is associated with the intensity maximum of the synchrotron X-ray emission. In this case we may make some simple illustrative calculations of the expected magnitude of the offsets. Let be the bulk Lorentz factor of the slower (upstream) portion of the outflow, and be the bulk Lorentz factor of the faster (but otherwise identical) portion of the jet. After the collision, a symmetric double-shock structure forms within the outflow, for which the contact discontinuity propagates with the velocity in the observer’s frame. This is, of course, the bulk velocity of the radiating (downstream) jet plasma. Let us also assume that the slow portion of the outflow is at most mildly relativistic (see the discussion in the previous sections), i.e., that . With this assumption, the velocity of the shock in the observer frame is , where
| (4) |
and is the ratio of the specific heats of the jet plasma (see, e.g., Stawarz et al. 2004, Appendix E). The extent of the shocked region in the downstream plasma rest frame (denoted by primes) is , where , and is the comoving time since collision. Because for the moving source and , we obtain the expected separation of the radio and X-ray intensity maxima (i.e., the separation between the forward and reverse shock)
| (5) |
where we take as appropriate for a jet viewed at large inclinations . Note that in the framework of the proposed toy model, one should expect the spatial offset to increase with , that is, with the distance from the nucleus. This is in agreement with what is observed in 3C 353. Note also that the timescale required to explain the kpc-scale positional differences between the intensity maxima of the knots, yrs, is in a very good agreement with what has been proposed for the intermittent activity of the central engine in powerful FR II/quasar sources (Reynolds & Begelman 1997, Siemiginowska & Elvis 1997, Stawarz et al. 2004). In the above estimate we have assumed a very moderate bulk Lorentz factor for the jet (corresponding to a bulk velocity of the radiating plasma ), and the ratio of the specific heats . For these parameters we find , , and .
Several features of the observations are not explained by this scenario; for example, (i) there is no obvious reason why the forward and reverse fronts of the double shock structure should work substantially differently with respect to the acceleration of ultrarelativistic electrons; and (ii) it is not clear why similar positional offsets are observed in the jet knots and in the jet termination regions (hotspots), since the shock structures produced in the latter regions are expected to be completely different. These may suggest that the toy model considered above is over-simplified, and that some other physical picture has to be considered. Another possibility — still in the framework of intermittent jet activity — is that the central engine ejects heavy knots in yr-long flare-like activity periods. Due to the high (relativistic) mass load of the knot, the bulk velocity of one of these heavier portions of magnetized plasma is expected to be smaller than the velocity of the ‘weak jet’ formed in an epoch of quiescence. Interactions between the heavy/slower and light/faster portions of the jet would lead to formation of a single (reverse) shock at the upstream edge of a heavy knot (the forward shock, propagating within the heavy portion of the jet matter, would be expected to die away soon after its formation, as long as the density ratio between the two phases of the ejecta was high). Thus, the heavy portion of the jet outflow would behave like the reflecting walls used in ‘particle-in-cell’ simulations and would form a shock front that would propagate upstream. As a result, the positions of radio knots would coincide with the positions of heavy portions of the jet plasma, while the X-ray intensity maxima due to freshly accelerated electrons would be expected to coincide with the downstream region of the reverse shock. This model solves at least problem (i) noted above; however, discussions based on more sophisticated numerical simulations are clearly essential to confirm this or other similar speculations.
6. Conclusions
We have presented a detailed analysis of the data for the powerful FR II radio galaxy 3C 353 obtained with the Chandra X-ray Observatory. In a deep, ks Chandra observation, we have detected the X-ray emission from most of the radio structures in this source, including the nucleus, isolated knots in the jet and the counterjet, the terminal jet regions (hotspots), and one radio lobe. Our major findings are as follows:
-
(i).
Non-thermal X-ray emission associated with a knot in the counterjet of a powerful FR II source has been detected for the first time. This detection, in agreement with the established large inclination of 3C 353, strongly disagrees with the inverse-Compton model proposed in the literature, and points to a synchrotron origin for the X-ray jet photons.
-
(ii).
We find that the width of the X-ray knots is narrower ( effect) than that measured at radio wavelengths, suggesting that the production of the X-ray emission is associated with the central jet spine rather than with the jet boundaries. This conclusion, however, must be confirmed with X-ray data with a much better signal-to-noise ratio.
-
(iii).
The radio-to-X-ray flux ratio decreases systematically downstream along the outflows, as is often observed in other extragalactic sources. We argue that this is due to the fact that the particle acceleration conditions associated with microphysical plasma parameters changes within the central part of the jet, rather than being due to a gradual decrease of the jet bulk velocity resulting from a smooth jet deceleration.
-
(iv).
Substantial (kpc-scale) offsets between positions of the X-ray and radio intensity maxima within each knot are found, with the magnitude of the offsets increasing away from the nucleus. We have speculated that these offsets can be explained if radio knots are moving portions of jet material which are produced by the central engine during an epoch of enhanced activity. Depending on the velocity and density ratio between these knots and the outflow produced at times of quiescence, a complex double-shock structure may form as a result of the interaction between the two phases of the ejecta, with the reverse shock (propagating within the faster portion of the jet) being associated with the peak of the X-ray emission.
Although we cannot provide definitive solutions or interpretations for each problem, we argue that the 3C 353 data strongly suggest that the synchrotron X-ray emission of extragalactic large-scale jets is not simply shaped by the global hydrodynamical configuration of the outflows, but is also very sensitive to the microphysical parameters of the jet plasma.
References
- (1) Aloy, M.A., & Rezzolla, L., 2006, ApJ, 640, L115
- (2) Aloy, M.A., & Mimica, P., 2008, ApJ, in press (arXiv:0803.2693)
- (3) Aloy, M.A., Ibanez, J.M., Martì, J.M., Gómez, J.-L., & Müller, E., 1999, ApJ, 523, L125
- (4) Bai, J.M., & Lees, M.G., 2003, ApJ, 585, L113
- (5) Begelman, M.C., Blandford, R.D., & Rees, M.J., 1984, Rev.Mod.Phys., 56, 255
- (6) Blumenthal, G.R., & Gould, R.J., 1970, Rev.Mod.Phys., 42, 237
- (7) Bridle, A.H., & Perley, R.A., 1984, ARA&A, 22, 319
- (8) Bridle, A.H., Perley, R.A., & Henriksen, R.N., 1986, AJ, 92, 534
- (9) Bridle, A.H., Fomalont, E.B., Byrd, G.G., & Valtonen, M.J., 1989, AJ, 97, 674
- (10) Carilli, C.L., Harris, D.E., Pentericci, L., Rottgering, H.J.A., Miley, G.K., Kurk, J.D., & van Breugel, W., 2002, ApJ, 567, 781
- (11) Celotti, A., Ghisellini, G., & Chiaberge, M., 2001, MNRAS, 321, L1
- (12) Cheung, C.C., Harris, D.E., & Stawarz, Ł., 2007, ApJL, 663, 65
- (13) Chiaberge, M., Gilli, R., Macchetto, F.D., Sparks, W.B., & Capetti, A., 2003, ApJ, 582, 645
- (14) Clarke, D.A., Bridle, A.H., Burns, J.O., Perley, R.A., & Norman, M.L., 1992, ApJ, 285, 173
- (15) Croston, J.H., Hardcastle, M.J., Harris, D.E., Belsole, E., Birkinshaw, M., & Worrall, D.M., 2005, ApJ, 626, 733
- (16) Dickey, J.M., & Lockman, F.J., ARA&A, 28, 215
- (17) Eilek, J.A., Hardee, P.E., Markovic, T., Ledlow, M., & Owen, F.N., 2002, NewAR, 46, 327
- (18) Evans, D.A., Worrall, D.M., Hardcastle, M.J., Kraft, R.P., & Birkinshaw, M., 2006, ApJ, 642, 96
- (19) Fomalont, E.B., Frey,S., Paragi, Z., Gurvits, L. I., Scott, W. K., Taylor, A. R., Edwards, P. G., & Hirabayashi, H. 2000, ApJS, 131, 95
- (20) Fan, Z.-H., Liu, S., Wang, J.-M., Fryer, C.L., & Li, H., 2008, ApJL, 673, L139
- (21) Fanaroff, B.L., & Riley, J.M., 1974, MNRAS, 167, 31
- (22) Georganopoulos, M., & Kazanas, D., 2004, ApJ, 604, 81
- (23) Ghisellini, G., & Celotti, A., 2001, MNRAS, 327, 739
- (24) Goodger, J.L., Hardcastle, M.J., Croston, J.H., Kassim, N.E., & Perley, R.A., 2008, MNRAS, 386, 337 [G08]
- (25) Hardcastle, M.J., et al., 1999, MNRAS, 304, 135
- (26) Hardcastle, M.J., Worrall, D.M., Kraft, R.P., Forman, W.P., Jones, C., & Murray, S.S., 2003, ApJ, 593, 169
- (27) Hardcastle, M.J., Harris, D.E., Worrall, D.M., & Birkinshaw, M., 2004, ApJ, 612, 729
- (28) Hardcastle, M.J., & Croston, J.H., 2005, MNRAS, 363, 649
- (29) Hardcastle, M.J., 2006, MNRAS, 366, 1465
- (30) Hardcastle, M.J., Evans, D. A., & Croston, J. H., 2006, MNRAS, 370, 1893
- (31) Hardcastle, M.J., Croston, J.H., & Kraft, R.P., 2007a, ApJ, 669, 893
- (32) Hardcastle, M.J., et al. 2007b, ApJL, 670, L81
- (33) Hardee, P.E., 2007, ApJ, 664, 26
- (34) Harris, D.E., & Krawczynski, H., 2002, ApJ, 565, 244
- (35) Harris, D.E., & Krawczynski, H., 2006, ARA&A, 44, 463
- (36) Honda, M., & Honda, Y.S., 2007, ApJ, 654, 885
- (37) Iwasawa, K., Ettori, S., Fabian, A.C., Edge, A.C., & Ebeling, H., 2000, MNRAS, 313, 515
- (38) Jamrozy, M., Konar, C., Saikia, D.J., Stawarz, Ł., Mack, K.-H., & Siemiginowska, A., 2007, MNRAS, 378, 581
- (39) Jester, S., Röser, H.-J., Meisenheimer, K., & Perley, R. 2005, A&A, 431, 477
- (40) Jester, S., Harris, D.E., Marshall, H.L., & Meisenheimer, K., 2006, ApJ, 648, 900
- (41) Jester, S., Meisenheimer, K., Martel, A.R., Perlman, E.S., & Sparks, W.B., 2007, MNRAS, 380, 828
- (42) Jorstad, S.G., Marscher, A.P., Mattox, J.R., Wehrle, A.E., Bloom, S.D., & Yurchenko, A.V., 2001, ApJS, 134, 181
- (43) Kataoka, J., Edwards, P., Georganopoulos, M., Takahara, F., & Wagner, S., 2003a, A&A, 399, 91
- (44) Kataoka, J., Leahy, J. P., Edwards, P.G., Kino, M., Takahara, F., Serino, Y., Kawai, N., & Martel, A.R., 2003b, A&A, 410, 833
- (45) Kataoka, J., & Stawarz, Ł., 2005, ApJ, 622, 797
- (46) Kataoka, J., Stawarz, Ł., Aharonian, F., Takahara, F., Ostrowski, M., & Edwards, P.G., 2006, ApJ, 641, 158
- (47) Komissarov, S.S., 1994, MNRAS, 266, 649
- (48) Komissarov, S.S., & Falle, S.A.E.G., 1998, MNRAS, 297, 1087
- (49) Kraft, R.P., Hardcastle, M.J., Worrall, D.M., & Murray, S.S., 2005, ApJ, 622, 149
- (50) Laing, R.A., & Bridle, A.H. 2002, MNRAS, 336, 1161
- (51) Laing, R.A., & Bridle, A.H., 2004, MNRAS, 348, 1459
- (52) Laing, R.A., Canvin, J.R., Cotton, W.D., & Bridle, A.H., 2006a, MNRAS, 368, 48
- (53) Laing, R.A., Canvin, J.R., Bridle, A.H., & Hardcastle, M.J., 2006b, MNRAS, 372, 510
- (54) Leismann, T., Antòn, L., Aloy, M.A., Müller, E., Martí, J.M., Miralles, J.A.; & Ibánez, J.M., 2005, A&A, 436, 503
- (55) Levinson, A., & Bromberg, O., 2008, in Proc. “High Energy Phenomena in Relativistic Outflow”, Dublin, Ireland, September 24-28, 2007 (astro-ph/0712.2664v1)
- (56) Machalski, J., Chyży, K.T., Stawarz, Ł., & Kozieł, D., 2007, A&A, 462, 43
- (57) Marshall, H. L., et al., 2001, ApJ, 549, L167
- (58) Marshall, H.L., Miller, B.P., Davis, D.S., Perlman, E.S., Wise, M., Canizares, C.R., & Harris, D.E., 2002, ApJ, 564, 683
- (59) Marshall, H.L., Schwartz, D.A., Lovell, J.E.J., Murphy, D.W., Worrall, D.M., Birkinshaw, M., Gelbord, J.M., Perlman, E.S., & Jauncey, D.L., 2005a, ApJS, 156, 1
- (60) Marshall, H.L., Jester, S., Harris, D.E., & Meisenheimer, K., 2005b, in Proc. ‘The X-ray Universe 2005’, San Lorenzo de El Escorial, Spain, 26-30 September 2005 (astro-ph/0511145)
- (61) Meliani, Z., & Keppens, R., 2007, A&A, 475, 785
- (62) Mizuno, Y., Hardee, P., & Nishikawa, K.-I., 2007, ApJ, 662, 835
- (63) Mizuno, Y., Hardee, P., Hartmann, D.H., Nishikawa, K.-I., & Zhang, B. 2008, ApJ, 672, 72
- (64) Monet, D., et al. 2003, AJ, 125, 984
- (65) Mullin, L.M., Riley, J.M., & Hardcastle, M.J., 2008, MNRAS, submitted
- (66) Perucho, M., Hanasz, M., Martí, J.-M., & Miralles, J.-A., 2007, PhRvE, 75, 6312
- (67) Reynolds, C.S., & Begelman, M.C., 1997, ApJ, 487, 135
- (68) Sambruna, R.M., Gambill, J.K., Maraschi, L., Tavecchio, F., Cerutti, R., Cheung, C.C., Urry, C.M., & Chartas, G., 2004, ApJ, 608, 698
- (69) Sambruna, R.M., Gliozzi, M., Tavecchio, F., Maraschi, L., & Foschini, L., 2006, ApJ, 652, 146
- (70) Sambruna, R.M., Donato, D., Tavecchio, F., Maraschi, L., Cheung, C.C., & Urry, C.M., 2007, ApJ, 670, 74
- (71) Scarpa, R., & Urry, C.M., 2002, NewAR, 46, 405
- (72) Schlegel, D.J., Finkbeiner, D.P. & Davis, M. 1998, ApJ, 500, 525
- (73) Schwartz, D.A., et al., 2000, ApJ, 540, L69
- (74) Siemiginowska, A., & Elvis, M., 1997, ApJ, 482, 9
- (75) Siemiginowska, A., Bechtold, J., Aldcroft, T.L., Elvis, M., Harris, D.E., Dobrzycki, A., 2002, ApJ, 570, 543
- (76) Siemiginowska, A., Stawarz, Ł., Cheung, C.C., Harris, D.E., Sikora, M., Aldcroft, T.L., & Bechtold, J., 2007, ApJ, 657, 145
- (77) Smith, D.A., Wilson, A.S., Arnaud, K.A., Terashima, Y., & Young, A.J., 2002, ApJ, 565, 195
- (78) Stawarz, Ł., 2003, ChJAS, 3, 383
- (79) Stawarz, Ł., & Ostrowski, M., 2002, ApJ, 578, 763
- (80) Stawarz, Ł., Sikora, M., Ostrowski, M., & Begelman, M.C., 2004, ApJ, 608, 95
- (81) Stawarz, Ł., Siemiginowska, A., Ostrowski, M., Sikora, M., 2005, ApJ, 626, 120
- (82) Stawarz, Ł., Kneiske, T. M., & Kataoka, J., 2006, ApJ, 637, 693
- (83) Stawarz, Ł., Cheung, C.C., Harris, D.E., & Ostrowski, M., 2007, ApJ, 662, 213
- (84) Steenbrugge, K.C., Blundell, K.M., & Duffy, P., 2008, in Proc. ”High Energy Phenomena in Relativistic Outflows”, Dublin, Ireland, September 24-28, 2007 (astro-ph/0712.3024v1)
- (85) Swain, M.R., 1996, Ph.D. Thesis, University Rochester
- (86) Swain, M.R., Bridle, A.H., & Baum, S.A., 1998, ApJL, 507, L29
- (87) Tavecchio, F., Maraschi, L., Sambruna, R.M., & Urry, C.M., 2000, ApJL, 544, L23
- (88) Tavecchio, F., Maraschi, L., Sambruna, R.M., Urry, C.M., Cheung, C.C., Gambill, J.K., & Scarpa, R., 2004, ApJ, 614, 64
- (89) Tavecchio, F., Cerutti, R., Maraschi, L., Sambruna, R.M., Gambill, J.K., Cheung, C.C., & Urry, C.M., 2005, ApJ, 630, 721
- (90) Tavecchio, F., Maraschi, L., Sambruna, R.M., Gliozzi, M., Cheung, C.C., Wardle, J.F.C., & Urry, C.M., 2006, ApJ, 641, 732
- (91) Tavecchio, F., Maraschi, L., Wolter, A., Cheung, C.C., Sambruna, R.M., & Urry, C.M., 2007, ApJ, 662, 900
- (92) Uchiyama, Y., et al., 2006, ApJ, 648, 910
- (93) Wardle, J.F.C., & Aaron, S.E., 1997, MNRAS, 286, 425
- (94) Worrall, D.M., et al., 2008, ApJ, 673, L135
- (95) van Breugel, W.J.M., Heckman, T.M., Miley, G.K., & Filippenko, A.V., 1986, ApJ, 311, 58
- (96) Vikhlinin, A., Forman, W., Jones, C., & Murray, S. 1995, ApJ, 451, 542