The 2006-2008 Oil Bubble and Beyond
Abstract
We present an analysis of oil prices in US$ and in other major currencies that diagnoses unsustainable faster-than-exponential behavior. This supports the hypothesis that the recent oil price run-up has been amplified by speculative behavior of the type found during a bubble-like expansion. We also attempt to unravel the information hidden in the oil supply-demand data reported by two leading agencies, the US Energy Information Administration (EIA) and the International Energy Agency (IEA). We suggest that the found increasing discrepancy between the EIA and IEA figures provides a measure of the estimation errors. Rather than a clear transition to a supply restricted regime, we interpret the discrepancy between the IEA and EIA as a signature of uncertainty, and there is no better fuel than uncertainty to promote speculation!
Since 1995, the US markets have lived through three major episodes, now recognized by most professionals and regulators and a growing number of academics as bubbles: the new economy ICT (Internet-Communication-Technology) frenzy culminating in 2000, the real-estate surge peaking in the US in mid-2006 and the subprime NIV (new instrument vehicle) boom, which topped in 2007. In finance and economics, the term bubble refers to a situation in which excessive expectations of future price increases cause prices to be temporarily elevated without justification from fundamental valuation.
Since approximately March 2008, a growing number of journalists, pundits Soros , bankers Credit_Suisse and academics Wharton ; krugman have been discussing the pros and cons of the hypothesis that commodities, and in particular oil, have entered a bubble regime. One key question is to explain the quadrupling of oil prices since 2003. Some attribute it mainly to the pricing of the growing demand (in particular from the emergent China and India markets) imperfectly balanced by the increasingly apparent limits of world oil production. Others are raising the specter of rising speculation Soros .
Based on analogies with statistical physics and complexity theory, we have developed in the last decade an approach that diagnoses bubbles as transient super-exponential regimes Sorbookcrash . In a nutshell, our methodology aims at detecting the transient phases where positive feedbacks operating on some markets or asset classes create local unsustainable price run-ups. The mathematical signature of these bubbles is a log-periodic power law (LPPL) SJ1998 ; JS1999 ; JSL1999 ; JLS2000 ; SJ2001 . The power law models the faster-than-exponential growth culminating in finite time. The log-periodic oscillations reflect hierarchical structures JSL1999 ; JLS2000 as well as competition between the trading dynamics of fundamental value and momentum investors Ide-Sornette .
Here, we present a brief synopsis of an extended analysis that we have performed to address the question of whether oil prices exhibit a bubble-like dynamics, which may be symptomatic of speculative behavior. We have obtained robust and reliable diagnostics (i) by comparing different implementations of the LPPL theory, called the simple LPPL model SJ2001 , the second-order Weierstrass model Weirstrass and the second-order Landau model JS_Landau2 ; JS_Landau2-3 ; JS_japan_eval , (ii) by performing extensive sensitivity analyses with respect to many different time windows used to calibrate the models and (iii) by using bootstrap methods to resample the residues over monthly time scales so as to keep as much as possible the statistical properties of the time series in the bootstrap scenarios. In our detailed analysis, we condition the calibration on a certain number of additional constraints that ensure the statistical significance of the LPPL structure, which include bounds on the key parameters informed from previous analyses SJ2001 ; JS_endo-exo , and the statistical significance of the power law and log-periodic components ZS_stat_sign-02 . In addition, to address the question of a possible interplay between oil price increase and US-dollar depreciation, we perform the same analysis for oil price expressed in euro and in other major currencies.
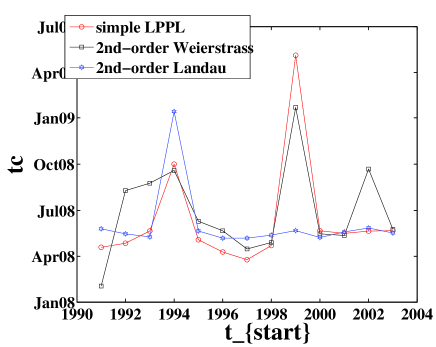
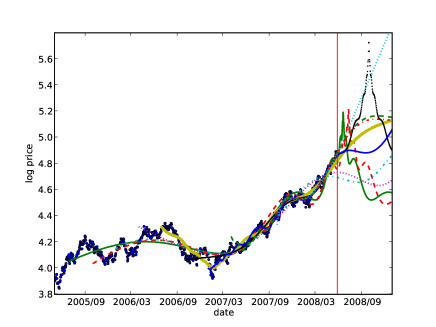
Figure 1 shows a typical result of the calibration of the simple LPPL model to the oil price in US$ in shrinking windows with starting dates moving up towards the common last date May 27, 2008. One particular useful feature of the LPPL models is that, in contrast with most econometric models, they describe transient regimes ending at a critical time beyond which the bubble is supposed to cross-over to another regime, either by crashing or through a more progressive transition JS_endo-exo ; forecasting . Figure 2 shows the predicted critical time obtained using the three LPPL models (simple LPPL, second-order Weierstrass and second-order Landau) as a function of the beginning time for the fixed May 27, 2008. Extensive scanning of and confirms the main messages of figures 1 and 2 of (a) a reliable detection of a LPPL regime confirming the existence of a bubble in oil price expressed in US$ and (b) a robust and stable diagnostic that the bubble is close to a local peak (and actually may have already reached it). We cannot however exclude the possibility that the proximity to a critical time is only a temporary process embedded in a larger-scale bubble, that could develop in the coming months and years.
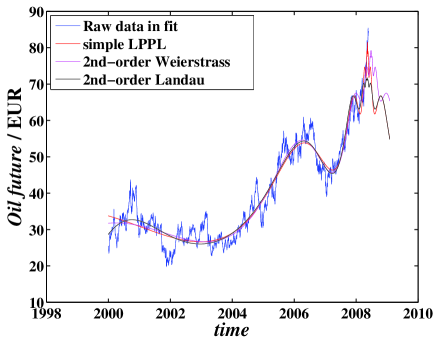
Figure 3 shows the three fits with the simple LPPL, second-order Weierstrass and second-order Landau model of the oil price expressed in euro. This confirms that the bubble is genuine, and not solely a consequence of the weakening of the US$. The values of the critical time determined from these and other calibrations in different time windows and using other major currencies are found similar to those reported in figure 2, confirming the existence of a bubble phenomenon. In addition, our analysis points to a distinct change of regime in the oil price dynamics in US$ occurring between the last quarter of 2005 and the first quarter of 2006, beyond which a net acceleration can be observed, perhaps correlated with the deregulation of Intercontinental Exchange (ICE) oil futures in US markets by the U.S. Commodity Futures Trading Commission.
One last issue needs to be addressed: could the faster-than-exponential price rises demonstrated here result from a faster-than-exponential rise in demand which is not met by supply? If the answer is positive, our interpretation that we are seeing speculation unfolding would be incorrect arXiv Blogger . Could it indeed be that the recent price surges are explained for instance by a faster-than-exponential rise in demand from economies such as China and India? The recent paper JiangZemin by former President Jiang Ze-Min himself debunks this hypothesis at least for China (see Fig. 3 with caption in English in JiangZemin ).
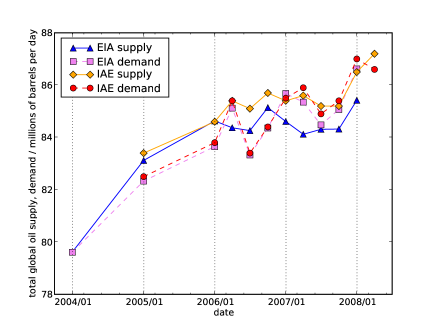
To investigate this issue further, we took the values on World liquid fuel supply and demand reported by the International Energy Agency in its May, 13, 2008 Oil Market report IEA08 (see Table 1, p. 51) and by the US Energy Information Administration (EIA) (http://www.eia.doe.gov/emeu/international/oilother.html). Figure 4 shows the World total liquid fuel demand and total World supply, as estimated by these two agencies (IEA and EIA).
While the two agencies report approximately consistent demand figures over this time period, there is a more worrisome discrepancy between the supply values, with the EIA reporting a supply value about one Mb/d smaller than the IEA, since 2006. The EIA data suggests that oil demand has exceeded supply over the last 5 quarters shown here, suggesting that fundamentals play a major role in the price run up. In contrast, the IEA data suggests a much weaker effect. We tried to understand the causes of these different values. For one, each of these estimated numbers aggregate global statistics coming from many sources and countries. Second, there is also a degree of extrapolation and guess work, which is handled differently in the two agencies. There are often revisions coming later (not unlike revision of GPD estimates in macro-economics) that close the gap between these differences. It seems to us that one message is that the discrepancy between the EIA and IEA provides in fact a measure of the estimation errors. In other words, these numbers are not to be believed at face value given the uncertainties.
Given these uncertainties, one feature seems to emerge with a certain degree of certainty: until the end of 2005, both agencies were in line and supply was systematically exceeding demand. Since 2006, this deterministic fact has broken down with the ushering into an epoch of uncertainty. In our opinion, one should not conclude that demand has exceeded supply or vice-versa since 2006, but rather that the oil market has entered an opaque regime. Rather than a clear transition to a supply restricted regime, we interpret the discrepancy between the IEA and EIA as a signature of uncertainty. Here, we should immediately stress that there is no better fuel than uncertainty to promote speculation!
In conclusion, the present study supports the hypothesis that the recent oil price run-up, when expressed in any of the major currencies, has been amplified by speculative behavior of the type found during a bubble-like expansion. The underlying positive feedbacks, nucleated by rumors of rising scarcity, may result from one or several of the following factors acting together: (1) protective hedging against future oil price increases and a weakening dollar whose anticipations amplify hedging in a positive self-reinforcing loop; (2) search for a new high-return investment, following the collapse of real-estate, the securitization disaster and poor yields of equities, whose expectations endorsed by a growing pool of hedge, pension and sovereign funds will transform it in a self-fulfilling prophecy; (3) the recent development since 2006 of deregulated oil future trading, allowing spot oil price to be actually more and more determined by speculative future markets deregulation and thus more and more decoupled from genuine supply-demand equilibrium.
Acknowledgements: We express our gratitude to Didier Darcet from Renaissance Investment Management for useful discussions and Tam Hunt from the Community Environmental Council of Santa Barbara for a stimulating correspondence. WXZ acknowledges financial supports from the National Natural Science Foundation of China (Grant Nos. 70501011), the Fok Ying Tong Education Foundation (Grant No. 101086), and the Program for New Century Excellent Talents in University (Grant No. NCET-07-0288).
References
- (1) Zumbrun, J., Soros tells congress to pop an oil bubble, Forbes, 3rd June 2008.
- (2) Credit Suisse, The Investment Committee Meeting of 27 May 2008.
- (3) Siegel, J. and W. Henisz, What’s Behind the Flare-ups in Oil Prices? Jeremy Siegel and Witold Henisz Weigh In, Knowledge@Wharton, May 28, 2008.
- (4) Krugman, P., More on oil and speculation (The Conscience of a Liberal), The New York Times, May 13, 2008.
- (5) Sornette, D., Why Stock Markets Crash? Princeton University Press (2003).
- (6) Sornette, D. and A. Johansen, A hierarchical model of financial crashes, Physica A 261 (Nos. 3-4), 581-598 (1998).
- (7) Johansen, A. and D. Sornette, Critical crashes, Risk 12 (1), 91-94 (1999).
- (8) Johansen, A., D. Sornette and O. Ledoit, Predicting financial crashes using discrete scale invariance, Journal of Risk 1 (4), 5-32 (1999).
- (9) Johansen, A., O. Ledoit and D. Sornette, Crashes as critical points, International Journal of Theoretical and Applied Finance 3 (2), 219-255 (2000).
- (10) Sornette, D. and A. Johansen, Significance of log-periodic precursors to financial crashes, Quantitative Finance 1, 452-471 (2001).
- (11) Ide, K. and D. Sornette, Oscillatory finite-time singularities in finance, population and rupture, Physica A 307 (1-2), 63-106 (2002).
- (12) Zhou, W.-X. and D. Sornette, Renormalization group analysis of the 2000-2002 anti-bubble in the US S&P 500 index: Explanation of the hierarchy of five crashes and prediction, Physica A 330, 584-604 (2003).
- (13) Sornette, D. and A. Johansen, Large financial crashes, Physica A 245 (3-4), 411-422 (1997).
- (14) Johansen, A. and D. Sornette, Financial “anti-bubbles”: Log-periodicity in Gold and Nikkei collapses, Int. J. Mod. Phys. C 10(4), 563-575 (1999).
- (15) Johansen, A. and D. Sornette, Evaluation of the quantitative prediction of a trend reversal on the Japanese stock market in 1999, Int. J. Mod. Phys. C Vol. 11 (2), 359-364 (2000)
- (16) Johansen, A. and D. Sornette, Shocks, crashes and bubbles in financial markets, Brussels Economic Review (Cahiers economiques de Bruxelles), 49 (3/4), Special Issue on Nonlinear Analysis (2006) (http://ideas.repec.org/s/bxr/bxrceb.html) (http://arXiv.org/abs/cond-mat/0210509)
- (17) Zhou, W.-X. and D. Sornette, Statistical significance of periodicity and log-periodicity with heavy-tailed correlated noise, Int. J. Mod. Phys. C 13 (2), 137-170 (2002).
- (18) Sornette, D. and W.-X. Zhou, Predictability of large future changes in major financial indices, International Journal of Forecasting 22, 153-168 (2006).
- (19) United States Senate Permanent Subcommittee on Investigations, 109th Congress 2nd Session, The Role of Market speculation in Rising Oil and Gas Prices: A Need to Put the Cop Back on the Beat; Staff Report, prepared by the Permanent Subcommittee on Investigations of the Committee on Homeland Security and Governmental Affairs, United States Senate, Washington D.C., June 27, 2006. p. 3.
- (20) http://arxivblog.com/?p=462
- (21) Jiang, Ze-min, Reflections on energy issues in China, Journal of Shanghai Jiaotong University 42 (3), 345-359 (March 2008) (in chinese, but english abstract and figure captions in english).
- (22) International Energy Agency, Oil Market Report, Issue 13 May 2008, www.oilmarketreport.org and http://omrpublic.iea.org/