Dependence of geosynchrotron radio emission on the energy and depth of maximum of cosmic ray showers
Abstract
Based on CORSIKA and REAS2 simulations, we investigate the dependence of geosynchrotron radio emission from extensive air showers on the energy of the primary cosmic ray and the depth of the shower maximum. It is found that at a characteristic lateral distance, the amplitude of the bandpass-filtered radio signal is directly proportional to the energy deposited in the atmosphere by the electromagnetic cascade, with an RMS uncertainty due to shower-to-shower fluctuations of less than 3%. In addition, the ratio of this radio amplitude and that at a larger lateral distance is directly related to the atmospheric depth of the shower maximum, with an RMS uncertainty of –20 g cm-2. By measuring these quantities, geosynchrotron radio emission from cosmic ray air showers can be used to infer the energy of the primary particle and the depth of the air shower maximum on a shower-to-shower basis.
keywords:
cosmic rays , extensive air showers , electromagnetic radiation from moving charges , computer modeling and simulationPACS:
96.50.S- , 96.50.sd , 41.60.-m , 07.05.Tp, ,
1 Introduction
During the last few years, the technique of radio detection of cosmic ray air showers has experienced an impressive renaissance [FalckeNature2005, ; HuegeCris2006, ; ArdouinBelletoileCharrier2005, ; vandenBergIcrc2007, ]. The activities are driven by the prospect of establishing a new observing technique with nearly 100% duty cycle and very good angular resolution, which would complement the existing particle detectors and air fluorescence telescopes. Due to the coherent nature of the radio emission, i.e. an approximately quadratic scaling of the emitted radio power with the energy of the primary cosmic ray, the technique is particularly well-suited for the detection of ultra-high energy cosmic rays.
One important question is how the observables measured with the radio technique can be related to the energy and mass of the primary cosmic ray particle. In this article, we use the geosynchrotron model for radio emission from cosmic ray air showers [HuegeFalcke2003a, ; HuegeFalcke2005a, ; HuegeFalcke2005b, ; HuegeUlrichEngel2007a, ] to demonstrate how shower parameters could be derived from radio-only measurements that allow one to estimate the primary energy and composition. It is shown that the characteristics of the lateral distribution function of the radio emission can be exploited to estimate on a shower-to-shower basis both the energy deposited in the atmosphere and the depth of the shower maximum. The energy determination can be performed with a measurement at an optimum lateral distance which is independent of the energy of the primary particle in the considered energy range from to eV — it only depends on the air shower geometry and radio observing frequency. Combining this measurement with an additional measurement at a different lateral distance provides a handle on the depth of the shower maximum and consequently yields information related to the mass of the primary particle.
All results presented in this simulation study were derived with the geosynchrotron model as implemented in the REAS2 code [HuegeUlrichEngel2007a, ]. Additional mechanisms which can contribute to the radio signal, such as Cherenkov-like emission from a charge excess and contributions from the net charge variation during the air shower evolution [WernerScholten2008, ; MeyerVernetLecacheuxArdouin2008, ], are the subject of current investigations and are not included in the analysis presented here. A direct comparison between the implementations of different emission models by various authors is difficult due to the very different calculational approaches. In contrast to other available models, however, the geosynchrotron model implemented in the REAS2 code allows us an absolute, parameter-free calculation of the emission from individual air showers, accounting for realistic shower-to-shower fluctuations and detailed spatial, angular and energy distributions of the shower particles. If radio emission from air showers is dominated by geomagnetic effects — an assumption supported by experimental data showing strong correlations between the strength of the radio signal and the orientation of the air shower axis to the Earth’s magnetic field [FalckeNature2005, ; HornefferArena2005, ; PetrovicApelAsch2006, ] — the results of this analysis can be considered generally applicable.
In the following we first describe the methodology applied throughout the present analysis. We then investigate the case of air showers with 60∘ zenith angle, where the effects are very prominent and could be well exploited experimentally. Afterwards we demonstrate that the same qualitative behaviour is fulfilled for air showers with 45∘ zenith angle, where it would, however, be harder to use experimentally, followed by our conclusions.
2 Methodology
We investigate four air shower geometries: showers with 60∘ zenith angle coming from the south (180+90 showers), from the east (180 showers) and from the north (180 showers) as well as air showers with 45∘ zenith angle coming from the south (180 showers). Each set of 180 showers covers the energy range from eV to eV according to a power-law with spectral index of and consists of 60 proton-induced, 60 iron-induced and 60 photon-induced showers. The additional set of 90 showers has been simulated for a fixed energy of eV, induced in equal parts by proton, iron and photon primaries.
For each of these 810 showers, a complete simulation with CORSIKA 6.710 [HeckKnappCapdevielle1998, ] using the hadronic interaction models QGSJETII-03 [Ostapchenko2005, ; Ostapchenko2006b, ] and UrQMD 1.3.1 [Bass1998, ; Bleicher1999, ] was performed to produce detailed histogram information to be used for the radio simulations as described in [HuegeUlrichEngel2007a, ]. The magnetic field was set to a strength of 0.23 Gauss with an inclination angle of -37.3∘, corresponding to the values valid for the southern site of the Pierre Auger Observatory [AugerNIM2004, ] in Argentina. Particle thinning within CORSIKA was set to 10-6 with optimised weight limitation according to [Kobal2001, ]. Electromagnetic particles were tracked down to kinetic energies of 400 keV using EGS4 [EGS4, ]. For photon-primaries with energies eV, pre-showering in the Earth’s magnetic field was taken into account. Also, the LPM effect [LandauPomeranchuk1953a, ; LandauPomeranchuk1953b, ; Migdal1956, ] as implemented in CORSIKA is accounted for in the simulations.
In a second step, the radio emission for each of the 810 CORSIKA-simulated air showers was calculated with REAS 2.58 [HuegeUlrichEngel2007a, ; REAS-Webpage, ] for a regular grid of observer locations at a height of 1400 m above sea level, again adequate for the southern Pierre Auger Observatory. For the 45∘ and 60∘ zenith angle showers coming from the south, in addition, the radio signal at sea level was calculated.
The resulting unlimited bandwidth time-series pulses were then digitally filtered with three idealised rectangle filters: 16–32 MHz, 32–64 MHz and 64–128 MHz. (The filtered pulses correspond to signals that experiments with the given frequency bandwidths would measure; the bandwidth of 32–64 MHz is closest to the one employed in current experimental approaches.) The absolute values (vectorial sum of all three polarisation components) of the peak amplitudes of these filtered pulses, derived for each observer location and air shower, form the basis for the following discussion.
3 The 60∘ zenith angle case
We first discuss the important characteristics of the radio signal for the case of 60∘ zenith angle. In a first step we shall consider showers of eV energy and later show that the results also apply to the energy range from to eV.
3.1 Characteristics of lateral profiles
Earlier analyses [HuegeFalcke2005b, ] have shown that the slope of the radio lateral distribution function is correlated with the depth of the air shower maximum, , and consequently contains information on the mass of the primary particle [HuegeIcrc2005a, ].
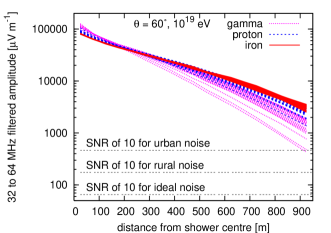
In Fig. 1, we show the lateral distribution of the 32–64 MHz filtered peak radio amplitude derived for the 90 air showers with fixed energy of eV. The lateral distance is given in ground coordinates111We use ground-distances rather than shower-distances throughout this article, as shower-distances would not remove the intrinsic asymmetries of the radio signal and ground distances are experimentally relevant in the end. in the direction defined by the continuation of the air shower axis (i.e., in this case to the north, as the showers are coming from the south). Measurements at distances up to one km should be feasible for ultra-high energy cosmic rays, as the comparison with continuous noise estimates based on ITU/CCIR measurements taken from [MeinkeGrundlach2007, ] illustrates.
There is an important feature in these lateral distributions: while the slopes of the individual lateral profiles differ significantly, all profiles intersect in a small region around m. This essentially arises from the strong forward collimation of the radio emission in combination with the integration over the course of the air shower evolution.
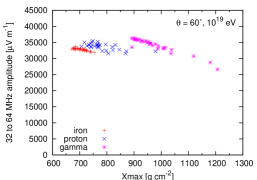
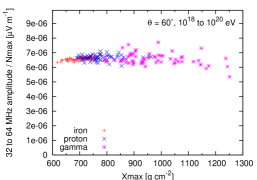
A more quantitative view of the 32–64 MHz filtered peak amplitudes in this region and their relation to the individual shower values is given in Fig. 3. The distribution of filtered field strengths is approximately independent of — and thus almost independent of shower to shower fluctuations. We call the distance region of the intersection, characterised by the minimum in the RMS spread of the amplitudes, flat region from now on. (The location of this region depends on several parameters, in particular the shower zenith angle and window of observing frequency, but also the chosen normalisation applied to the radio amplitudes, as will be discussed in the following.) Although the amplitude distribution is approximately flat, there are visible “steps” between the values for the different types of primary particles. The reason for these “steps” is the fact that the radio emission is generated only by the electromagnetic cascade of an air shower, and depending on the type of the primary particle, a different fraction of the energy of the primary particle is transferred to the electromagnetic cascade [SongCaoDawson2000, ; BarbosaCatalaniChinellato2004, ].
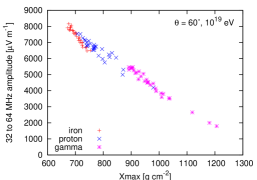
At large lateral distances, e.g. around 700 m, the lateral profiles for the individual air showers plotted in Fig. 1 lead to very different filtered electric field strengths. Such a region will be called steep region from now on. A quantitative look at the filtered electric field strengths as a function of is given in Fig. 3. In a steep region, the filtered electric field strength is directly correlated with the of the air shower.
3.2 Energy determination
With experimental measurements, the arrival direction and core position of an air shower can be deduced from radio-only measurements [ArdouinBelletoileCharrier2006, ]. The energy of the primary particle, on the other hand, is a priori unknown. The correlations discussed in the previous section can, however, be generalized for a range of energies.
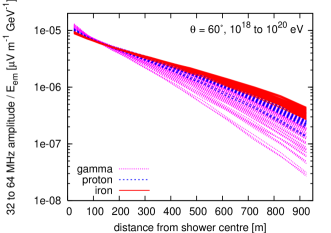
In Fig. 4, the lateral radio emission profiles of the 180 simulated air showers spanning the energy range from to eV are shown after filtering to the observing bandwidth of 32–64 MHz. To make shower signals comparable we have scaled them with the energy that the electromagnetic cascade of the air shower deposits in the atmosphere. While the absolute electric field amplitudes of the 180 showers span three orders of magnitude, the normalised lateral distribution profiles exhibit the same qualitative behaviour as those of the monoenergetic showers depicted in Fig. 1. In particular, there exists again a well-defined region for all showers (and thus all energies), in which the normalised lateral profiles intersect. As will be discussed later, the location of the intersection region and the spread of the normalised field strengths at this distinctive lateral distance depends on the quantity with which the profiles are scaled.
Already in [HuegeIcrc2007a, ], we have demonstrated that the radio signal correlates with the sum of the number of electrons and positrons in the air shower maximum, . This correlation is illustrated in Fig. 6, where the filtered electric field strength per in the appropriate flat region of all 180 showers with 60∘ zenith angle coming from the south, spanning the energy range from eV to eV, is plotted against . Regardless of the energy and type of the primary particle and the value of , the filtered peak electric field strength per yields approximately the same value. In particular, the “steps” between the different types of primary particles seen in Fig. 3 have been reduced considerably by the normalisation with the maximum number of particles in the electromagnetic cascade.
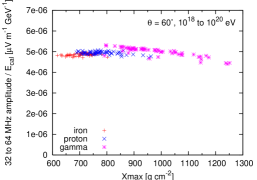
Another quantity with which the radio signal could be normalised is the “calorimetric energy” in the air shower, . (This is the quantity with which the fluorescence light correlates best, cf. [BarbosaCatalaniChinellato2004, ; RisseHeck2004, ].) The calorimetric energy of each simulated air shower is calculated from the total energy deposited in an infinitely thick atmosphere. As demonstrated in Fig. 6, for 60∘ zenith angle showers, the calorimetric energy has an even better correlation with the radio signal in the appropriate flat region than . The reason is that fluctuates less from shower to shower than the value of .
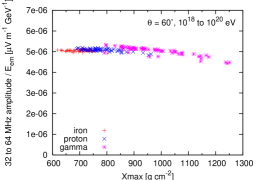
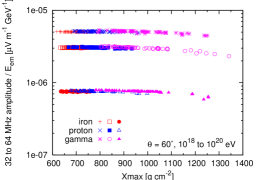
From a theoretical point of view, however, the quantity with which the radio signal should correlate best is the “energy deposited in the atmosphere by the electromagnetic cascade”, . In contrast to , neither includes energy deposited by muons or hadrons (which do not contribute to the radio signal) nor takes into account the energy deposited by particles in the ground. The high quality of the correlation with is illustrated in Fig. 8, which shows the normalised radio amplitudes at 175 m north of the shower core, where the corresponding flat region lies (see also Fig. 4).
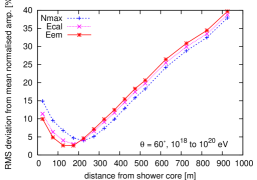
In Fig. 8 we compare the width of the correlation with the three discussed quantities, , and . As mentioned earlier, the location of the flat region, i.e., the minimum of the RMS distribution, depends on the chosen normalisation. In addition, it becomes clear that yields the best correlation, with an RMS deviation from the mean normalised amplitude of 3% at a ground distance of m. We therefore apply the normalisation of the radio signal with in the following.
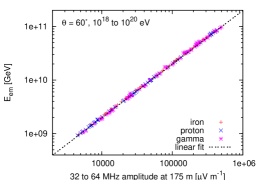
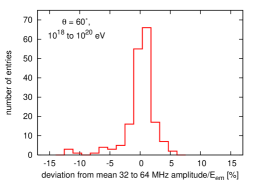
Once the value of the normalised, energy-independent radio amplitude per in the flat region is known for a given geometry and observing frequency — either from simulations or from measurements — a measurement of the peak filtered radio amplitude in the flat region can be used to immediately read off the value of in a linear relation,
| (1) |
where is a shower geometry dependent parameter, see Fig. 10. In Fig. 10, the distribution of the 32–64 MHz filtered peak radio amplitudes per around their mean value is illustrated. As discussed earlier, the RMS of this distribution amounts to 3%. In principle, i.e. not considering experimental uncertainties, the value can therefore be inferred with a theoretical uncertainty of 3%. It should be stressed that this theoretical accuracy would be achievable on a shower-to-shower basis, unhindered by shower-to-shower fluctuations and without a priori knowledge of the mass of the primary particle. The derived value of can in turn be related to the energy of the primary particle with an additional uncertainty of the order 5-7% [AlvarezMunizEngelGaisser2004, ].
3.3 Composition determination
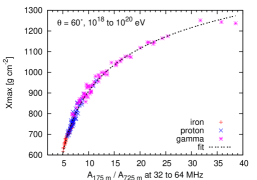
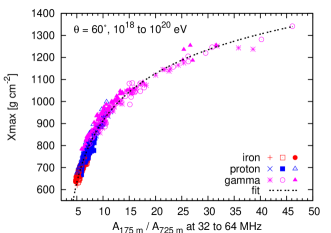
The ratio of the measured field strengths in the flat region and steep region can be used to infer the value on a shower-to-shower basis, which can in turn be related to the mass of the primary particle. This is demonstrated in Fig. 12. The correlation of with the ratio can be described well with the fit function
| (2) |
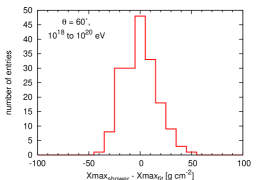
The deviations of the values of individual showers from this fit are depicted in Fig. 12. The RMS spread of these deviations for the 180 showers shown here amounts to 15.9 g cm-2.
Note that this spread only accounts for intrinsic shower-to-shower fluctuations and does not include any measurement errors. For comparison, fluorescence telescopes, which measure directly, reach an experimental resolution of the order of 35 to 20 g cm-2 [AbbasiAbuZayyadArchbold2005, ; DawsonICRC2007, ].
3.4 Influence of observing frequency
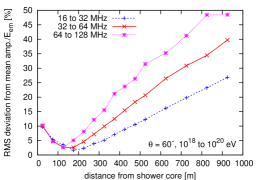
The characteristic lateral distance at which the flat region is located depends strongly on the zenith angle of the air shower. The frequency window of the radio observations, however, also influences its location. For the case of zenith angle air showers and normalisation with , this is illustrated in Fig. 14. A clear minimum of the RMS with values 3% can be deduced for each frequency band separately. The corresponding distance of the flat region amounts to the aforementioned m in case of the 32–64 MHz band. For higher frequencies, it lies at smaller distances, while for lower frequencies, it shifts to larger distances. From an experimental point of view, larger distances are favourable because they require less densely equipped radio antenna arrays. Multi-frequency observations including lower observing frequencies would thus allow an even better exploitation of measurements in the flat and steep regions for the determination of and .
3.5 Influence of observation altitude
The position of the flat region is also influenced by the observer’s height above sea level. This is due to the fact that the geometrical distance from the shower maximum to the radio antennas changes with the observer position, which influences the lateral distributions of the radio emission [HuegeFalcke2005b, ].
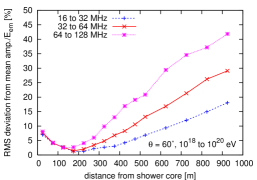
In Fig. 14, the RMS deviation from the mean filtered radio amplitude per is shown for observers at sea level, in contrast to the 1400 m above sea level used as standard value in this analysis. While the difference to an observer at 1400 m above sea level (Fig. 14) is not dramatic for 60∘ zenith angle showers, there is a clear trend for the flat regions to move to larger lateral distances, as can be expected from the flattening of the lateral profiles.
3.6 Influence of observer azimuth angle
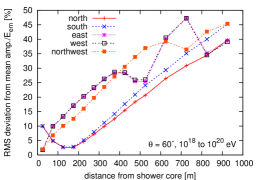
Radio emission from inclined air showers exhibits a significant asymmetry for observer positions along the azimuthal direction given by the air shower axis and positions perpendicular to the air shower axis. For inclined air showers, part of this asymmetry is caused by geometrical effects and can be taken out by changing from ground coordinates to shower coordinates [HuegeFalcke2005b, ]. The geosynchrotron model, however, also predicts an intrinsic asymmetry that is present even for vertical air showers [HuegeUlrichEngel2007a, ]. In Fig. 15, we illustrate the RMS spread of the 32–64 MHz filtered peak amplitudes per for observers along different azimuthal directions in case of air showers coming from the south. The behaviour is almost identical for observers along the two azimuthal directions defined by the shower axis, in this case to the north and to the south, except for a small asymmetry caused by the inclination of the geomagnetic field.
For an observer in the north-west, i.e. at 45∘ azimuth to the shower axis, the flat region shifts to a very small lateral distance, which is no longer resolved in the simulations. This is the behaviour expected from the model-predicted asymmetries of the radio “footprint”. In addition, there is a local minimum in the RMS distribution around m. On a closer look, such additional local minima are also visible in the north direction, especially at 64–128 MHz (cf. Fig. 14). These local minima are dependent on the window of observing frequency and therefore related to interference effects arising from the bandpass filtering.
For the east or west directions, i.e. perpendicular to the shower axis, the flat region also lies at distances too small to be resolved by the simulations. At the same time, additional prominent local minima occur at large distances.
From an experimental point of view, large lateral distances for the flat region are preferred, and measurements would thus be easiest in the azimuthal directions given by the air shower axis.
3.7 Influence of shower azimuth angle
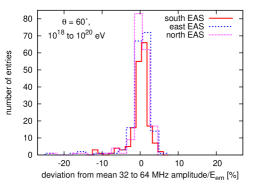
So far, we have only treated the case of 60∘ zenith angle showers coming from the south. The qualitative behaviour of the radio signal, however, is independent of the shower azimuth angle. This is illustrated in Fig. 17, where the peak filtered radio amplitude per in the flat region is plotted for the three sets of air showers coming from the south, east and north. (The flat region is then, correspondingly, found at m to the north, west and south of the shower core.) While the absolute value of the filtered peak radio amplitude per varies with the angle between the shower axis and the Earth’s magnetic field (called geomagnetic angle, corresponding to 67.3∘, 107.6∘ and 172.7∘ for the three cases), the values for a given geometry are again approximately equal over all showers. Once this constant value is known for a given geometry — from simulations or measurements — the determination can again be performed with a measurement in the flat region. As illustrated in Fig. 17, the RMS spread is still 3% in all three cases.
The determination of values via the ratio of filtered radio amplitudes in the flat region and steep region also works regardless of the shower azimuth angle. As the calculation of this ratio removes the absolute strength of the radio signals, the correlation of with this ratio is (to first order) universal and independent of the shower azimuth angle. This is illustrated in Fig. 18, which contains all 540 showers of the three geometries in the same diagram. (The change of the fit parameters and RMS compared to Fig. 12, however, illustrates that there are minor systematic differences between the three geometries.)
4 The 45∘ zenith angle case
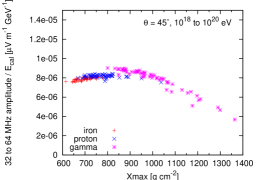
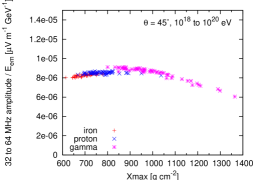
When going from 60∘ zenith angle to 45∘ zenith angle, the qualitative behaviour of the radio signal stays the same, but the lateral distance scales get significantly smaller. One effect which becomes, however, more important, is the inclusion or exclusion of energy deposited in the ground. For 45∘ zenith angle, the ground at 1400 m above sea level corresponds to a slant atmospheric depth of g cm-2. Especially for photon-induced showers that penetrate very deep due to the LPM effect and have values of g cm-2, a large fraction of the energy is then deposited in the ground. The importance of this aspect is illustrated by the comparison of Fig. 20 and Fig. 20. Signals from showers with very high values of are weighted down too much if is used for normalisation, i.e., the energy deposit in the ground is included. The normalisation with , on the other hand, works better, as the energy deposit in the ground is excluded.
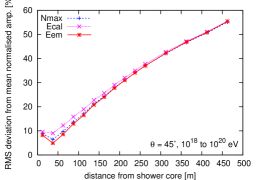
The quality of the different normalisations (with , and ) is further illustrated in Fig. 21. In contrast to the 60∘ zenith angle case, the normalisation with is now worse than that with .
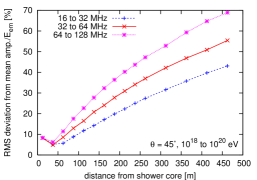
If the normalisation with is kept, the qualitative behaviour is the same as in the 60∘ zenith angle case. This is illustrated by Fig. 23, which again shows the RMS spread of the peak filtered radio amplitude per as a function of lateral distance along the north (for showers coming from the south) for different windows of observing frequency. A clear minimum in RMS, caused by the intersection of the normalised lateral radio profiles, is again present, but the corresponding flat region now lies at distances around 50 m, depending on the observing frequency. The achievable resolution is %.
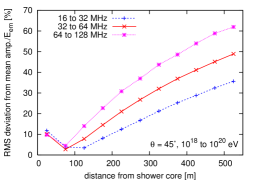
When comparing the radio emission for observers at 1400 m above sea level (Fig. 23) and at sea level (Fig. 23), it becomes obvious that the changes in the 45∘ zenith angle case are much more dramatic than for 60∘ zenith angle, as expected from the behaviour of the lateral profiles with the geometric distance between observer and shower maximum [HuegeFalcke2005b, ]. For observers at sea level, the flat region lies at ground distances between 50 and 150 m, which comprises a suitable range for densely equipped antenna arrays such as LOPES [HornefferArena2005, ] or LOFAR [FalckevanHaarlemdeBruyn2007, ].
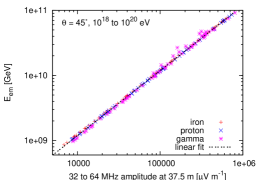
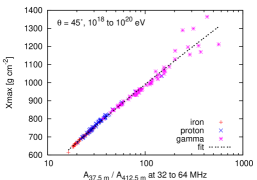
Again, can be determined from a measurement in the flat region (Fig. 25) and can be deduced from a combined measurement in the flat region and a steep region (Fig. 25). The outliers at the extreme values of are again caused by the LPM effect in high-energy gamma-ray showers, being more prominent in the 45∘ zenith angle case than for 60∘ zenith angle showers.
5 Conclusions
Based on Monte Carlo simulations performed with CORSIKA and REAS2, we have shown that geosynchrotron radio emission from air showers of cosmic rays is sensitive to the primary particle energy and mass, and that this information content can be extracted from radio data on a shower-to-shower basis.
For a given observing frequency and zenith angle, there is a well-defined lateral distance region in which the filtered radio peak amplitude is directly proportional to the energy deposited in the atmosphere by the electromagnetic cascade of an air shower, . Once the proportionality constant is known, can be derived from a radio measurement in this so-called flat region. The RMS spread of the values due to shower-to-shower fluctuations amounts to less than 3% in case of an ideal radio signal measurement. Relating to the energy of the primary particle introduces an additional uncertainty of to 7%.
The peak field strength in the flat region can be combined with a field strength measured in a steep region, found at a larger lateral distance and/or higher observing frequency. The ratio of these field strengths can then be directly related to the atmospheric depth of the air shower maximum, , on a shower-to-shower basis. The RMS spread of the values around the corresponding fit function due to shower-to-shower fluctuations amounts to –g cm-2, not including any instrumental resolutions.
Exploitation of these signal characteristics with an experimental measurement requires antenna spacings dense enough to allow reconstruction of the electric field strengths in the flat region. As the location of the flat region shifts to larger lateral distances for increasing zenith angles, application of this strategy is particularly interesting for inclined showers with at least 45∘, better 60∘, zenith angle. (At smaller zenith angles, the flat region will shift to distances very close to the shower core, and an extrapolation of the electric field strength to the core region will become necessary.) In the case of 60∘ zenith angle and for an observing frequency of 32–64 MHz, the flat region lies at a (ground-coordinate) distance of m in the azimuthal direction defined by the shower axis. Decreasing the observing frequency, if technically possible, increases this distance considerably. In addition, observations at lower heights above sea level increase the distance, especially for zenith angles smaller than 60∘.
Assuming that the geosynchrotron model accounts for the dominant part of radio emission from extensive air showers, exploitation of these characteristics could thus make radio detection a powerful tool for the determination of the primary energy of cosmic rays and the depth of shower maximum of air showers, which in turn is related to the mass of the primary particle.
References
- [1] H. Falcke, W. D. Apel, A. F. Badea et al., Nature 435 (2005) 313–316.
- [2] T. Huege, W. D. Apel, T. Asch et al., Nuclear Physics B (Proc. Suppl.) 165 (2007) 341–348.
- [3] D. Ardouin, A. Bellétoile, D. Charrier et al., Nucl. Instr. Meth. A 555 (2005) 148–163.
- [4] A. van den Berg et al., in: Proceedings of the 30th ICRC, Merida, Mexico, 2007, astro-ph/0708.1709.
- [5] T. Huege, H. Falcke, Astronomy & Astrophysics 412 (2003) 19–34.
- [6] T. Huege, H. Falcke, Astronomy & Astrophysics 430 (2005) 779–798.
- [7] T. Huege, H. Falcke, Astropart. Phys. 24 (2005) 116.
- [8] T. Huege, R. Ulrich, R. Engel, Astropart. Physics 27 (2007) 392–405.
- [9] K. Werner, O. Scholten, Astroparticle Physics submitted (2008), astro-ph/0712.2517.
- [10] N. Meyer-Vernet, A. Lecacheux, D. Ardouin, Astronomy & Astrophysics in press (2008), astro-ph/0712.1533.
- [11] A. Horneffer, W. D. Apel, A. F. Badea et al., Int.J.Mod.Phys. A 21S1 (2006) 168–181.
- [12] J. Petrovic, W. D. Apel, T. Asch et al., Astronomy & Astrophysics 462 (2007) 389–395.
- [13] D. Heck, J. Knapp, J. N. Capdevielle, FZKA Report 6019, Forschungszentrum Karlsruhe (1998).
- [14] S. Ostapchenko, Phys. Rev. D74 (2006) 014026.
- [15] S. Ostapchenko, Phys. Lett. B636 (2006) 40–45.
- [16] S. A. Bass et al., Prog. Part. Nucl. Phys. 41 (1998) 225.
- [17] M. Bleicher et al., J. Phys. G 25 (1999) 1859.
- [18] J. Abraham, M. Aglietta, I. C. Aguirre et al., Nucl. Instrum. Meth. A523 (2004) 50–95.
- [19] M. Kobal et al., Astroparticle Physics 15 (2001) 259–273.
- [20] W. R. Nelson, H. Hirayama, D. W. O. Rogers, SLAC Report 265, Stanford Linear Accelerator Center, http://www.slac.stanford.edu/pubs/slacreports/slac-r-265.html (1985).
- [21] L. D. Landau, I. Pomeranchuk, Dokl. Akad. Nauk Ser. Fiz. 92 (1953) 735–738.
- [22] L. D. Landau, I. Pomeranchuk, Dokl. Akad. Nauk Ser. Fiz. 92 (1953) 535–536.
- [23] A. B. Migdal, Phys. Rev. 103 (1956) 1811–1820.
- [24] http://www-ik.fzk.de/~huege/reas.
- [25] T. Huege, W. D. Apel, A. F. Badea et al., in: Proc. of the 29th ICRC, Pune, India, Vol. 7, 2005, p. 107.
- [26] H. H. Meinke, F.-W. Grundlach, Taschenbuch der Hochfrequenztechnik, Vol. 1, Springer Verlag, 2007.
- [27] C. Song, Z. Cao, B. R. Dawson et al., Astropart. Physics 14 (2000) 7–13.
- [28] H. M. J. Barbosa, F. Catalani, J. A. Chinellato et al., Astropart. Physics 22 (2004) 159–166.
- [29] D. Ardouin, A. Bellétoile, D. Charrier et al., Astropart. Physics 26 (2006) 341–350.
- [30] T. Huege, R. Ulrich, R. Engel, in: Proceedings of the 30th ICRC, Merida, Mexico, 2007, astro-ph/0707.3761.
- [31] M. Risse, D. Heck, Astropart. Physics 20 (2004) 661–667.
- [32] J. Alvarez-Muñiz, R. Engel, T. K. Gaisser et al., Phys. Rev. D 69 (10) (2004) 103003–+.
- [33] R. U. Abbasi, T. Abu-Zayyad, G. Archbold et al., ApJ 622 (2005), 910–926.
- [34] B. R. Dawson for the Pierre Auger Collaboration, in: Proceedings of the 30th ICRC, Merida, Mexico, 2007, astro-ph/0706.1105
- [35] H. D. Falcke, M. P. van Haarlem, A. G. de Bruyn et al., Highlights of Astronomy 14 (2007) 386–387.