G. S. Adams
M. Anderson
J. P. Cummings
I. Danko
D. Hu
B. Moziak
J. Napolitano
Rensselaer Polytechnic Institute, Troy, New York 12180, USA
Q. He
J. Insler
H. Muramatsu
C. S. Park
E. H. Thorndike
F. Yang
University of Rochester, Rochester, New York 14627, USA
M. Artuso
S. Blusk
S. Khalil
J. Li
R. Mountain
S. Nisar
K. Randrianarivony
N. Sultana
T. Skwarnicki
S. Stone
J. C. Wang
L. M. Zhang
Syracuse University, Syracuse, New York 13244, USA
G. Bonvicini
D. Cinabro
M. Dubrovin
A. Lincoln
Wayne State University, Detroit, Michigan 48202, USA
P. Naik
J. Rademacker
University of Bristol, Bristol BS8 1TL, UK
D. M. Asner
K. W. Edwards
J. Reed
Carleton University, Ottawa, Ontario, Canada K1S 5B6
R. A. Briere
T. Ferguson
J. S. Y. Ma111present address: Department of Physics, University of Texas, Austin, Texas 78712, USAG. Tatishvili
H. Vogel
M. E. Watkins
Carnegie Mellon University, Pittsburgh, Pennsylvania 15213, USA
J. L. Rosner
Enrico Fermi Institute, University of
Chicago, Chicago, Illinois 60637, USA
J. P. Alexander
D. G. Cassel
J. E. Duboscq
R. Ehrlich
L. Fields
R. S. Galik
L. Gibbons
R. Gray
S. W. Gray
D. L. Hartill
B. K. Heltsley
D. Hertz
J. M. Hunt
J. Kandaswamy
D. L. Kreinick
V. E. Kuznetsov
J. Ledoux
H. Mahlke-Krüger
D. Mohapatra
P. U. E. Onyisi
J. R. Patterson
D. Peterson
D. Riley
A. Ryd
A. J. Sadoff
X. Shi
S. Stroiney
W. M. Sun
T. Wilksen
Cornell University, Ithaca, New York 14853, USA
S. B. Athar
R. Patel
J. Yelton
University of Florida, Gainesville, Florida 32611, USA
P. Rubin
George Mason University, Fairfax, Virginia 22030, USA
B. I. Eisenstein
I. Karliner
S. Mehrabyan
N. Lowrey
M. Selen
E. J. White
J. Wiss
University of Illinois, Urbana-Champaign, Illinois 61801, USA
R. E. Mitchell
M. R. Shepherd
Indiana University, Bloomington, Indiana 47405, USA
D. Besson
University of Kansas, Lawrence, Kansas 66045, USA
T. K. Pedlar
Luther College, Decorah, Iowa 52101, USA
D. Cronin-Hennessy
K. Y. Gao
J. Hietala
Y. Kubota
T. Klein
B. W. Lang
R. Poling
A. W. Scott
P. Zweber
University of Minnesota, Minneapolis, Minnesota 55455, USA
S. Dobbs
Z. Metreveli
K. K. Seth
A. Tomaradze
Northwestern University, Evanston, Illinois 60208, USA
J. Libby
A. Powell
G. Wilkinson
University of Oxford, Oxford OX1 3RH, UK
K. M. Ecklund
State University of New York at Buffalo, Buffalo, New York 14260, USA
W. Love
V. Savinov
University of Pittsburgh, Pittsburgh, Pennsylvania 15260, USA
H. Mendez
University of Puerto Rico, Mayaguez, Puerto Rico 00681
J. Y. Ge
D. H. Miller
I. P. J. Shipsey
B. Xin
Purdue University, West Lafayette, Indiana 47907, USA
(June 3, 2008)
Abstract
We report the first observation of the decay .
The signal has a statistical significance of 6
and corresponds to a branching fraction of
,
in which the errors are statistical and systematic, respectively.
The measurement uses events acquired
with the CLEO-c detector
operating at the CESR collider.
pacs:
13.20.Gd, 12.38.Qk
††preprint: CLNS 08-2027††preprint: CLEO 08-10
Ortho-positronium (oPs), the bound state,
decays to almost exclusively and has long been
a fertile ground for precision QED tests ops .
The analog to oPs for quantum chromodynamics (QCD),
three-photon vector quarkonium decay, has not yet been observed.
The rate of three-photon decays
acts as a probe of the strong interaction volo ,
most effectively when expressed in relation to
, , or
due to similarities
at the parton level.
Hence, measurements of , , , and
relative to one another
(where )
provide crucial experimental grounding for QCD
predictions volo ; qcd ; kwong .
In this Letter we report the first observation of .
Rate measurements for other rare or forbidden all-photon decays,
, , , and with ,
are also described.
Previous searches for and decay to have yielded
branching fraction upper limits
of 1.910-4 and 5.510-5, respectively PDG2006 .
As with oPs, -parity symmetry suppresses vector quarkonia decays to
an even number of photons, and two-photon
decays are forbidden by Yang’s theorem yang .
Ref. bes:2gamma reports the limit
2.210-5 at 90% confidence level (C.L).
Five-photon decays are suppressed by an
additional factor of (at least) ; c.f.,orthopfivegamma .
Ignoring QCD corrections altogether,
Ref. kwong predicts
,
and
.
Using the precisely measured PDG2006
in the first prediction implies 10-5.
The latter two suffer the uncertainty of what
value of to employ at the charmed quark mass scale volo .
Assuming =0.3 and inserting the result
from a recent CLEO measurement besson
( and ) into the
latter two predictions gives -10-5.
The first-order perturbative QCD corrections kwong to these
estimates are large, so these predictions
should only be considered as approximate.
Events were acquired at the CESR
collider with the CLEO detector CLEO ,
mostly in the CLEO-c configuration (95%) with the balance
from CLEO III. The dataset
corresponds to 27106 produced
mesons and (9.590.07)106
decays xnext .
Event selection requires the tracking system to find exactly two
oppositely charged particles, corresponding to the
recoiling from the , and that the
calorimeter have at least 2, 3, 4, 5, and 3
photon showers for the , , , ,
and samples, respectively.
Photon candidates must have energy exceeding 36 MeV
and, with respect to any shower associated with one
of the charged pions, either be located more
than 30 cm away, or between 15 cm and 30 cm from it
and have a photon-like lateral shower profile.
We require that photon candidates not be located
near the projection of either pion’s trajectory
into the calorimeter nor be aligned with the initial momentum
of either pion within 100 mrad.
A two-step kinematic fit first constrains the beam spot
and the two charged pion
candidates to a common vertex, and then the
vertexed and the most energetic photon candidates to the
mass PDG2006 and initial
three-momentum, including the effect of the
3 mrad crossing angle between the
and beams. Tight quality restrictions are
applied to the vertex (/d.o.f.3) and
four-momentum (3) fits.
The mass recoiling against the must lie inside
a window around the mass,
3087-3107 MeV. Non-
backgrounds are estimated by keeping
a separate tally of events with
inside 2980-3080 MeV or 3114-3214 MeV, ranges which
together are ten times wider than the signal window.
Events with any of the photon pairs in the mass windows
0.10-0.16 GeV, 0.50-0.60 GeV, or 0.90-1.00 GeV
are rejected to eliminate contributions from decays with
’s, ’s, or ’s, the dominant
sources of photons in decays.
For the 3 selection only, we require
all photon pair masses be less than 2.8 GeV to
eliminate potential contamination from .
This requirement effectively restricts
the smallest energy photon to have energy exceeding
200 MeV. For the 4 and 5 samples only,
the smallest shower energy must be above 120 MeV,
and all lateral shower profiles must be photon-like.
This last restriction on shower shape avoids
feed-up from ,
events with one or more photon conversions
between the tracking chambers and the calorimeter:
in such cases the two showers from the conversion
and overlap one another, thereby distorting
both of their lateral profiles.
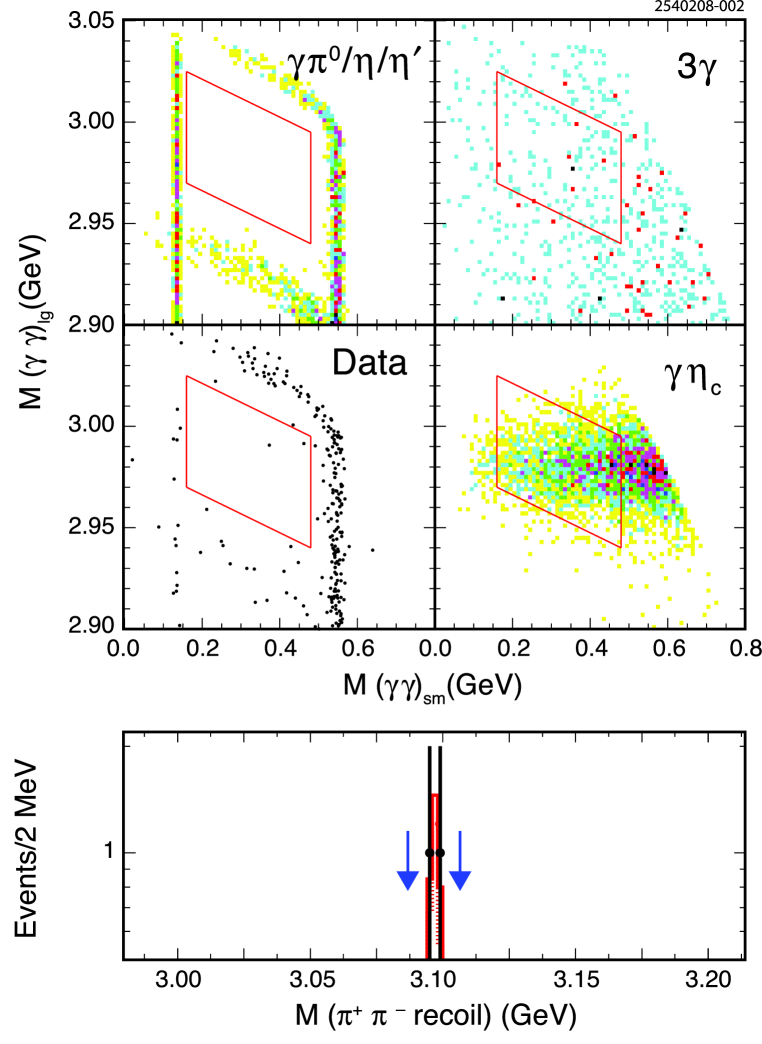
For the channel only,
we restrict the search region to large
and small , which
are, respectively, the largest and smallest
of the three two-photon mass combinations
in the event. The signal region is chosen this way so as
to keep backgrounds small. Specifically, the signal box
is defined, in units of GeV,
by 0.160.48, 2.9853.040.
Signal and background decay modes are modeled
with Monte Carlo (MC) samples that were generated using the
EvtGen event generator evtgen ,
fed through a Geant-based geant detector simulation,
and then exposed to event selection criteria.
For signal decays, final state photon momenta are distributed
according to phase-space. For , the
lowest order matrix element for ortho-positronium ore is used
as an alternate; compared to phase space, it modestly
magnifies the configurations that are
two-body-like and those with
three nearly-equal-energy photons (at the expense
of topologies lying between these two extremes).
For the process , an mass and width of
2979.8 MeV and 27 MeV, respectively, are used (both
are close to the PDG values PDG2006 ) to generate
a Breit-Wigner -mass distribution; alternate
widths from 23-36 MeV and different lineshapes ryan are
explored as systematic variations.
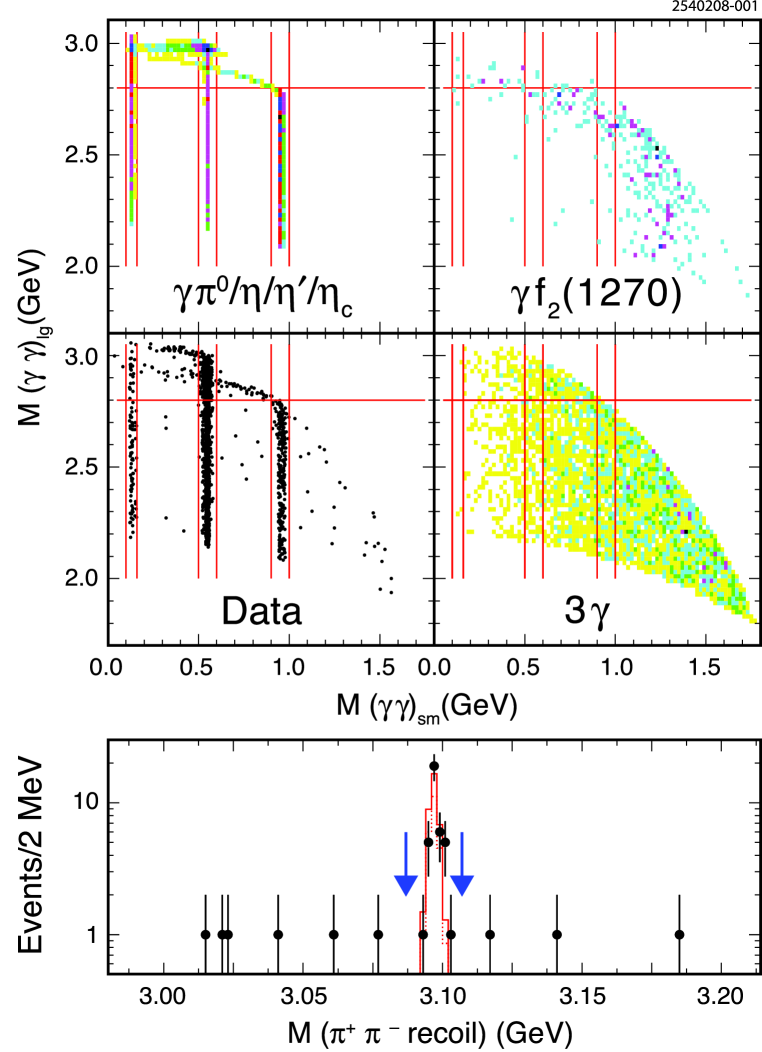
Distributions in vs. and for the
and samples are shown for data, signal MC samples,
and likely background decays in Figs. 1 and 2,
respectively.
In all modes, non- backgrounds are small and are
subtracted statistically
using sidebands in the data.
We determine the backgrounds from decays
with an exhaustive study of Monte Carlo samples.
Decays with
(where signifies any of the many
isoscalar mesons in the mass range from 600-2500 MeV),
followed by pose a negligible threat
for any of the target modes because
the product branching fractions are extremely small
(e.g., 210-8 for ,
).
The predominant source of backgrounds to the 3
sample is the
final state. This type of event can survive the selection by
having both decay axes nearly parallel to
their lines of flight, such that one photon of each pair has very low
energy in the laboratory frame,
and is therefore
nearly irrelevant to conservation of four-momentum.
An analysis by BES bes:5gamma found that the largest sources
of are from decays,
specifically through and , followed in
importance by , , and a
number of much smaller contributions from nearby resonances.
However, not all relevant product branching fractions
for , have been
measured, those that are measured have
large uncertainties, and interference effects
among overlapping may not be small.
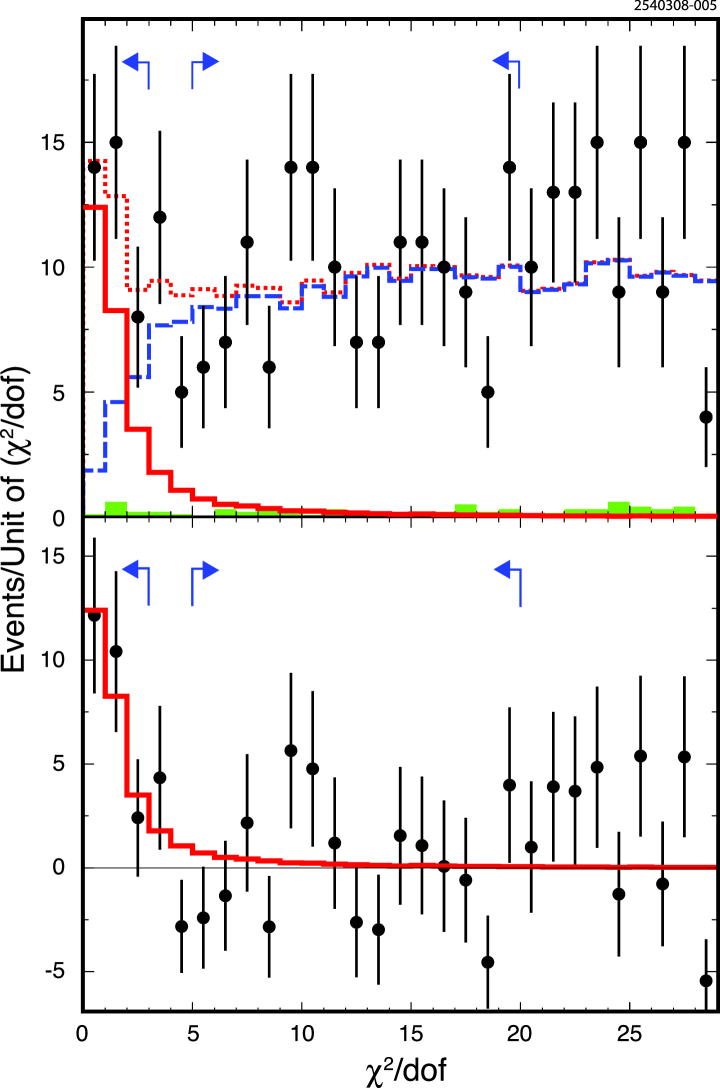
A method to normalize
other than using measured branching fractions
is employed to reduce systematic uncertainty. The
distribution for decays has a characteristic
shape, nearly independent of mass,
as shown in Fig. 3: the region
=5-20, where almost no signal is present,
is used to establish the level of .
Figure 4 shows the distribution
from data, MC signal and MC background and the
small contribution from non- decays obtained
from the sidebands.
The 142 data events with =5-20 contain signal (3.4 events),
non- background (3.2), and, using known branching fractions,
, (1.7),
, (1.2),
, (1.2),
, , (0.6),
and (0.2). The remainder (130.5 events)
serves to normalize the background component,
which has a relative 8% statistical uncertainty.
As a cross check on the background normalization,
we perform a maximum likelihood fit to data in
the entire =0-30 region with
the combination of shapes from MC of
and signal with floating normalizations for each,
and a fixed -sidebands contribution from data,
scaled by a factor of 0.1. Using this method with
different sources of the
taken one at a time as 100% of the background
results in an average signal size of 23.3 events
(with variation from 22.8 to 24.1), which is 0.9
events smaller than our nominal technique.
Based on these numbers we assign
a systematic error of 0.9 events, or 5% relative,
for signal extraction and background estimation for .
The fit just described is repeated with
the signal shape weight fixed to zero. The
likelihood difference with respect to the nominal
fit provides a measure of the statistical
significance of the signal. This significance varies
from 5.9 to 6.6 when using any one of the
backgrounds , ,
, , (phase space)
as the sole contributor to the background shape.
MC studies indicate the following primary sources of backgrounds
for the other modes: for the 2 sample,
(3.3 events) and , (2.7);
for the 4 sample,
, (0.9) or
(0.8),
, (0.3) or
, (0.9) or
, (0.3);
for the 5 sample,
, (0.2)
and , , (0.3);
for ,
, (0.3),
, (0.2),
and our newly found signal, (0.3).
Numerical results appear in Table 1.
Net yield uncertainties and upper limits on event counts include
the effects of statistical fluctuations in signal and background estimates.
Signal efficiencies range from 2% () to
22% (), and is the only mode
with a clear signal: 37 events observed on a background of
12.8.
Statistics dominate the overall uncertainties for all decay modes.
The efficiencies for pure phase-space
and the oPs matrix element are equal to within (0.20.1)%;
nevertheless, a 15% systematic error is assigned
to allow for different behavior in the much heavier
system. For , uncertainties in the lineshape,
background, and dominate the systematic error.
Using the recently determined
= (1.980.090.30)% ryan ,
the branching fraction can be calculated as
=(0.60.1)10-4, or
310-4 at 90% C.L.
This value is consistent with the PDG PDG2006
fit value of (2.70.9)10-4
at the level of 1.3, although making
a meaninful comparison is difficult because the PDG
number depends indirectly upon previous, considerably smaller
values for .
In conclusion, we have investigated decays
with , where the photons are produced in direct decay,
not through an intermediate resonance. For =3, a signal of
6 significance is found with branching fraction
=(1.20.30.2)10-5.
This value lies between the zeroth order
predictions kwong for
and and is consistent
with both,
but is a factor of 2.5 below that of .
This measurement represents the first observation of
a three-photon meson decay.
No signal is seen for =2, 4, or 5, and upper limits are set
on the branching fractions,
each of which is the most precise or only measurement.
We also measure
=
(1.20.3)10-6 or
an upper limit of 610-6 at 90% C.L.,
both consistent with other determinations PDG2006 .
We gratefully acknowledge the effort of the CESR staff
in providing us with excellent luminosity and running conditions.
This work was supported by
the A.P. Sloan Foundation,
the National Science Foundation,
the U.S. Department of Energy,
the Natural Sciences and Engineering Research Council of Canada, and
the U.K. Science and Technology Facilities Council.
References
(1) S.G. Karshenboim, Int. J. Mod. Phys. A 19, 3879
(2004); S. Asai et al., arXiv:0805.4672v1 [hep-ex] (2008).
(2) M.B. Voloshin, arXiv:0711.4556v3 [hep-ph] (2007),
and Prog. Part. Nucl. Phys (in press).
(3) A. Petrelli et al., Nucl. Phys. B514, 245 (1998).
(4) W. Kwong, P. B. Mackenzie, R. Rosenfeld and J. L. Rosner,
Phys. Rev. D 37, 3210 (1988).
(5) W.-M. Yao et al. (Particle Data Group), J. Phys. G33, 1 (2006) and 2007 partial update for 2008.
(7) M. Ablikim et al. (BES Collab.), Phys. Rev. D
76, 117101 (2007).
(8) T. Matsumoto et al., Phys. Rev. A
54, 1947 (1996); Erratum A 56, 1060 (1997).
(9) D. Besson et al. (CLEO Collab.), arXiv:0806.0315v1 [hep-ex] (2008).
(10)
Y. Kubota et al. (CLEO Collab.),
Nucl. Instrum. Meth. A 320, 66 (1992);
M. Artuso et al.,
Nucl. Instrum. Meth. A 554, 147 (2005);
D. Peterson et al.,
Nucl. Instrum. Meth. A 478, 142 (2002);
CLEO-c/CESR-c Taskforces & CLEO-c Collab.,
Cornell University LEPP Report No.
CLNS 01/1742 (2001), unpublished.
(11) H. Mendez et al. (CLEO Collab.), arXiv:0804.4432v1
[hep-ex] (2008). Accepted for publication in Phys. Rev. D.
(13) R. Brun et al.,
Geant 3.21, CERN Program Library Long Writeup W5013 (1993), unpublished.
(14) A. Ore and J.L. Powell, Phys. Rev. 75, 1696 (1949);
G.S. Adkins, arXiv:hep-ph/0506213v1 (2005).
(15) R.E. Mitchell et al. (CLEO Collab.), arXiv:0805.0252v1 [hep-ex] (2008).
(16) M. Ablikim et al. (BES Collab.),
Phys. Lett. B 642, 441 (2006).
Table 1: Results for the five decay modes,
showing the raw number of
signal candidate events, estimated background levels,
statistical significance of each signal, the net event yield and its
90% C.L. upper limit (UL), the signal efficiency,
different sources of systematic error and their
quadrature sum, expressed
in percent of the central value (, )
or of the UL (others), the branching
fraction [first error is statistical, second is systematic],
and the corresponding 90% C.L. upper limit UL,
including effects of systematic errors.
Signal candidates (events)
9
37
5
0
2
Background estimates (events)
backgrounds
6.2
11.9
3.2
0.5
0.8
Non- backgrounds
0.9
0.9
0.5
0
0
Background sum (events)
7.1
12.8
3.7
0.5
0.8
Statistical significance ()
1.1
6.3
1.0
0.0
1.0
Net yield (68% C.L. interval) (events)
1.9
24.2
1.3
0
UL @ 90% C.L. (events)
7.7
33.5
6.0
2.3
4.7
Efficiency (%)
19.2
21.8
8.71
1.90
10.9
Systematic uncertainties (%)
Matrix element
0
15
15
15
15
background
15
5
10
0
15
counting
0.7
0.7
0.7
0.7
0.7
Detector modeling
4.5
6.4
8.3
10
6.4
0
0
0
0
12
Quadrature sum (%)
16
17
20
18
25
[]
1.2
UL on @ 90% C.L. []
5
19
9
15
6
Figure 1: Top four plots:
in data (lower left) and MC events for
different decays
(top row and lower right), the largest vs. the
smallest two photon mass combination per event.
In the MC plots, darker shading of each bin
signifies higher event density than lighter shading;
in the data plot, each dot represents an event.
The solid lines demarcate regions excluded from
the selection.
Bottom plot: distribution of
for the data events (points with error bars)
overlaid with the signal MC prediction (dotted line histogram)
and MC background plus signal (solid line histogram)
normalized to the data population. The arrows indicate
the region of accepted recoil mass.
Figure 2: As in Fig. 1, except
zoomed in on the region, and
the overlaid parallelogram indicates the
signal region.
The
distribution is for
candidates.
Figure 3: The distribution of
for (lower right) and several sources
of background.
Figure 4: The distribution of
for , in the top plot showing data (points with error bars)
overlaid with the sum (dotted line histogram) of three components:
non- background from scaled data sidebands (shaded histogram)
and MC predictions for signal (solid) and
background (dashed). The bottom plot shows
the same distribution, but with the MC and non- background
subtracted from the data. The arrows indicate the values
for signal selection and background normalization.