11email: cft@astro.livjm.ac.uk 22institutetext: Royal Observatory, Greenwich, London SE10 9NF 33institutetext: Institute of Astronomy, Madingley Road, Cambridge CB3 0HA 44institutetext: School of Physics and Astronomy, The University of Nottingham, University Park, Nottingham NG7 2RD 55institutetext: Department of Astronomy, University of Virginia, Charlottesville, VA 22903, USA
Star-forming galaxies in low-redshift clusters: Data and integrated galaxy properties
Abstract
Aims. This paper is a continuation of an ongoing study of the evolutionary processes affecting cluster galaxies.
Methods. Both CCD R band and H narrow-band imaging was used to determine photometric parameters (, , H flux, and equivalent width) and derive star formation rates for 227 CGCG galaxies in 8 low-redshift clusters. The galaxy sample is a subset of CGCG galaxies in an objective prism survey (OPS) of cluster galaxies for H emission.
Results. It is found that detection of emission-line galaxies in the OPS is 85%, 70%, and 50% complete at the mean surface brightness values of , , and W m-2 arcsec-2, respectively, measured within the R band isophote of 24 mag for the galaxy.
Conclusions. The CCD data, together with matched data from a recent H galaxy survey of UGC galaxies within km , will be used for a comparative study of R band and H surface photometry between cluster and field spirals.
Key Words.:
galaxies: clusters: general – galaxies: evolution – galaxies: interactions1 Introduction
While the transformation of cluster disc galaxies from predominantly spiral to mainly lenticular galaxies over the past 5 Gyr is well established (e.g. Butcher & Oemler 1978, 1984; Dressler et al. 1997; Fasano et al. 2000), the mechanism or mechanisms that have affected this transformation are not so clear. However, a comparative study of the rate, distribution, and morphological dependence of star formation between cluster and field spirals appears to be a promising enquiry that can help to disentangle some of the suggested transformation processes. For example, ram-pressure stripping of the cold interstellar gas of spirals by the hot ionised intracluster medium (e.g. Gunn & Gott 1972; Quilis, Moore & Bower 2000) should be most effective in the centres of rich clusters, and may lead to a rapid truncation of the star forming disc, but provides no obvious mechanism to promote circumnuclear star formation. On the other hand, strangulation, i.e. the stripping of an hypothesised hot halo gas of spirals (e.g. Larson et al. 1980; Bower & Balogh 2004) should be a more gradual process; simulations by Bekki et al. (2002) have shown that this would lead to anemic spirals rather than truncation. Tidal interactions with the cluster potential can induce star formation across both bulge and disc (e.g. Byrd & Valtonen 1990), whereas low-velocity interactions between galaxies can be efficient at triggering star formation in central regions (e.g. Kennicutt et al. 1987; Mihos et al. 1992; Iono et al. 2004). In contrast, galaxy harassment, i.e. frequent galaxy high-speed encounters within a cluster, are expected to trigger modest disc-wide response of star formation for giant spirals (see Moore et al. 1999; Mihos 2004).
Systematic comparative studies of the massive star formation properties of cluster and field galaxies have already produced interesting results. Moss & Whittle (2000, 2005) undertook an objective prism survey (OPS) of a complete magnitude-limited sample of 727 CGCG galaxies (Zwicky et al. 1960–68) in 8 low-redshift clusters. These authors show an enhancement of circumnuclear starburst emission in cluster spirals associated with a disturbed morphology that is attributed to slow galaxy–galaxy encounters and major and minor mergers (see also Moss 2006). Koopmann & Kenney (2004a,b) have pioneered a comparative study of the massive star formation properties of Virgo cluster and isolated bright () S0–Scd galaxies via analyses of R and H surface photometry. They show that the median total normalised massive star formation rate is reduced by a factor of 2.5 for cluster galaxies as compared to the field. Few of the cluster or isolated galaxies are anemic, suggesting that strangulation is not a major contributory factor in the reduced star formation rates of Virgo spirals; rather, this reduction is caused by spatial truncation of the star forming discs. In addition, several of the truncated galaxies show evidence of recent tidal interaction or minor mergers, such as enhanced central star formation rates and disturbed stellar discs.
It is intended to extend the analyses of Koopmann & Kenney to the clusters studied by Moss & Whittle using R band and narrow-band H imaging obtained for a 227 subset of CGCG galaxies of mainly types Sa + later in the OPS. Clusters in the OPS include those of greater central galaxy density (most especially Abell 1367 and the Coma cluster) where on-going environmental effects on galaxy morphology and transformation may be expected to be even more pronounced than for the Virgo cluster. In the present paper, we discuss observational data and data reduction for imaging data, and present global photometric properties and derived star formation rates. Completeness limits for the OPS are also determined. A second paper (Bretherton et al., in preparation) will give results of a comparative study of R band and H surface photometry between the sample of 227 CGCG cluster galaxies, and sets of galaxies, matched according to morphology and absolute magnitude to the cluster sample, taken from the recent H galaxy survey of UGC galaxies within km (HGS, Shane 2002; James et al. 2004).
In the present paper, sample selection and observations of the cluster data are discussed in section 2. The data reduction procedures and photometry are outlined, and global parameters derived for all sample galaxies, in sections 3 and 4 respectively. Section 5 uses a complete sample of Sa–Sc galaxies within the cluster data to investigate the completeness of the objective prism survey (OPS, see Moss & Whittle 2000, 2005) on which present sample selection is based. Conclusions of this paper are given in section 6.
2 Sample selection and observations
2.1 Selection of cluster sample
The galaxy samples chosen for the present study are sub-samples of low-redshift cluster galaxies previously surveyed by Moss & Whittle (2000; 2005). These authors undertook an extensive objective prism survey of combined H + [NII] emission for CGCG galaxies (Zwicky et al. 1960–68) in 8 low-redshift Abell clusters (viz. Abell 262, 347, 400, 426, 569, 779, 1367, and 1656). This objective prism survey (hereafter, OPS) comprised a total of 727 CGCG galaxies, including double galaxy components (), and is essentially complete within Abell radii of the cluster centres. (The Abell radius, = 2.00 Mpc, assuming a Hubble constant, km , see Abell 1958). For convenience, Table 1 summarises basic data for the clusters surveyed, adapted from Moss & Whittle (2000) and Moss (2006).
| Cluster | Cluster centre | |||||||||||
|---|---|---|---|---|---|---|---|---|---|---|---|---|
| R.A. (1950) Dec. | (arcmin) | (Mpc) | () | (km ) | ||||||||
| Abell 262 | 1h | 499 | 35∘ | 54′ | 13659 | -2509 | 105 | 1.83 | 0.86 | 0.0167 | 537 | 38 |
| Abell 347 | 2 | 22.7 | 41 | 39 | 141.17 | -17.63 | 91 | 1.87 | 0.87 | 0.0192 | 550 | 14 |
| Abell 400 | 2 | 55.0 | 5 | 50 | 170.25 | -44.93 | 72 | 1.32 | 0.62 | 0.0227 | 392 | 10 |
| Abell 426 | 3 | 15.3 | 41 | 20 | 150.39 | -13.38 | 96 | 3.67 | 1.72 | 0.0177 | 1076 | 55 |
| Abell 569 | 7 | 5.4 | 48 | 42 | 168.58 | 22.81 | 88 | 1.42 | 0.66 | 0.0198 | 417 | 26 |
| Abell 779 | 9 | 16.8 | 33 | 59 | 191.07 | 44.41 | 75 | 0.98 | 0.46 | 0.0232 | 290 | 11 |
| Abell 1367 | 11 | 41.9 | 20 | 7 | 234.81 | 73.03 | 80 | 2.58 | 1.21 | 0.0216 | 762 | 62 |
| Abell 1656 | 12 | 57.4 | 28 | 15 | 58.09 | 87.96 | 74 | 3.01 | 1.41 | 0.0232 | 890 | 131 |
† E–S0/a galaxies only
Cluster centres are taken from Abell, Corwin & Olowin (1989). The Abell radius (Abell 1958), , corresponds to Mpc. Values for the virial radius, , are from Moss (2006), where is assumed. Cluster mean redshifts, , and velocity dispersions, , are based on redshifts of galaxies of types E–S0/a only. These objects are more likely to be in dynamic equilibrium with the cluster potential and follow a Gaussian distribution, as expected for virially relaxed galaxies within the cluster (see Moss 2006). The mean redshift has been corrected to the centroid of the Local Group following RC2 (de Vaucouleurs, de Vaucouleurs & Corwin 1976).
The sub-samples of the OPS were restricted to galaxies with velocities within of the cluster mean, and excluded known AGNs since the present study is mainly concerned with star formation properties. Two principal sub-samples were chosen: (a) galaxies of types Sa–Sc; this sample is complete for six clusters (viz. all clusters of the OPS except Abell 262 and 347), and (b) emission-line galaxies (ELGs) of the OPS of types S0/a and later (including ‘peculiar’ galaxies whose types are outside the Hubble sequence, see Moss & Whittle 2000).
2.2 Observations
The observations of the cluster sample were taken on the 1.0m Jacobus Kapteyn Telescope (JKT) and the 2.6m Nordic Optical Telescope (NOT) both situated on the island of La Palma. The JKT data consist of 2 weeks of observations taken in 1994 and 1998, some data taken in 1997, and a handful of galaxies observed in earlier service time, although the majority of the service galaxies were also observed in subsequent runs. Altogether, the JKT runs provided H and R band data for 143 sample galaxies, with repeat measurements for 14 of these. A 3 night observing run using ALFOSC (Andalucia Faint Object Spectrograph and Camera) on the NOT in January 2005 provided data for a further 87 galaxies, plus repeat measurements for eight JKT galaxies and two NOT galaxies.
The galaxies in the cluster sample have recession velocities in the range km . Therefore, in order to cover the redshifted H emission in all objects, it was necessary to use a series of narrowband filters. These have a typical passband width of 40–55 Å, with peak wavelengths ranging from 6626–6788 Å. Their transmission profiles for the JKT and NOT observations are shown in Figures 1a and 1b respectively.


The majority of the JKT observations made use of pixel TEK4 CCD camera, with field of view arcmin; for the few galaxies surveyed in the early service observations, a pixel EEV7 CCD camera was used, with field of view arcmin. R band continuum observations were taken using a Harris R band filter, with central wavelength of 6373 Å and passband width of 1491 Å.
The more recent NOT observations utilised the standard ALFOSC CCD8 pixel back-illuminated device with a field of view approximately arcmin. R band continuum observations were taken using a Bessell R filter with central wavelength of 6500 Å and passband width of 1300 Å. The broad R band filter is used for continuum subtraction, rather than off-band H filters, due to the much shorter exposure times required. James et al. (2004) found that scaled R band exposures gave excellent continuum subtraction when taken in dark sky conditions. The R band data are also used to trace the older, underlying stellar population of the sample galaxies in subsequent analysis.
As well as the galaxy images, a number of calibration frames were also taken. These included bias frames taken at the start and end of each night, sky flats (at least three observations of blank areas of sky, in each filter used, taken at twilight every night), and photometric standards observed throughout the night in the R band filter to monitor photometric conditions and calibrate the galaxy data. Spectrophotometric standards were also observed nightly through each filter.
2.3 The final observed cluster sample
Combining data from all runs, a total of 230 CGCG galaxies were observed. These galaxies are listed in Table 2, where the first three columns of the table give the CGCG number of the galaxy, the observing run, and narrow-band filter used to obtain the H data respectively.
The observed galaxies include all Sa–Sc galaxies in six Abell clusters (A400, 426, 569, 779, 1367, 1656) and emission-line galaxies of types S0/a and later in the 8 clusters of the OPS. Selection criteria for the galaxies (see section 2.1 above) are a velocity within of the cluster mean, a magnitude, , a radial distance from the cluster centre, , and that the galaxies are not known AGNs. Some 18 galaxies are listed in Table 2 that do not strictly meet these selection criteria: 13 galaxies have velocities greater than from the cluster mean (viz. CGCG 415-028, 415-031, 415-033, 415-035, 415-051, 415-58, 540-058, 540-071, 181-017, 181-023, 126-075, 127-002, and 127-012B) and 5 galaxies are fainter than (viz. CGCG 540-112B, 234-088B, 127-025B, 97-092A and 127-051B). These were observed in the preliminary phase of the project and have been included for completeness, but are not included in any of the statistical analyses in the present or subsequent papers. Twenty-four more galaxies (mainly in Abell 1367) lie beyond 1.5 Abell radii from the cluster centre.
3 Data reduction
3.1 Continuum subtraction
Standard IRAF and Starlink tasks were used to debias, flat-field and remove cosmic ray defects from all images, as well as to align pairs of R band and H images. Some galaxies in the cluster sample had uneven sky backgrounds after processing. For the NOT data this was simply a gradient across the H images. The JKT data were more variable, with some images having smooth, even backgrounds, whilst others showed gradients, marks or rings. Background variability was reduced by fitting a surface to the sky in affected images. All stars and galaxies in a frame were identified and masked out, and a polynomial fit was made to the remaining background using the Starlink KAPPA command surfit. This was subtracted from the original image, removing much of the variability and typically reducing sky background errors in affected frames by a factor of 15.
A critical stage in the data reduction process is the scaling and subtraction of the continuum contribution from the narrowband H images. Scaling factors were calculated from a comparison of 9 field stars in each galaxy image pair and from standard star observations. A mean scaling factor was then found for each filter pair across the full dataset. Scaling factors were consistent for all objects observed in the same H filter during photometric conditions.
The scaled continuum images were subtracted from the H images to leave continuum-free H emission. This latter includes a contribution from the neighbouring [NII] lines ( 6548, 6585Å) that lie within the filter bandpass.
3.2 Calibration
Images were calibrated by using R band standard star observations to determine extinction corrections and zeropoints for each night. Six galaxies (viz. CGCG 415-033, 522-011, 522-021, 522-053, 522-072, and 539-031) were observed in non-photometric conditions on the second night of the NOT run. For these galaxies separate R band calibration exposures were taken under photometric conditions on the following night and used to calibrate the non-photometric data.
Calibrated images were normalised to 1 count = 25 mag. The apparent magnitude of each galaxy in a given filter, , is then simply given by,
where is the number of sky-subtracted counts measured directly from the R band or continuum subtracted H images, and is a correction for Galactic extinction. Values of were based on the Galactic extinction maps of Schlegel et al. (1998) converted to R band extinction using the methods of Cardelli et al. (1989).
For narrow-band images, the measured magnitude, , of a galaxy can be considered as an equivalent magnitude in the R band. Following the calibration of R(Cousins) from Bessell (1979), corresponds to a flux density of W ; this relation was used to determine H flux values. Finally these flux values were corrected both for the centering of the H emission in the narrow-band filter, and for slight over-subtraction of the continuum due to the wavelength overlap of the R and narrow-band filters, to obtain final H flux values used for the subsequent analysis. Values of the H equivalent width (EW) for individual galaxies were obtained by dividing the H flux by the corresponding R band flux density.
3.3 Photometry
Photometry of individual galaxies was performed using a series of apertures of increasing radius/semi-major axis for each galaxy. Typically between 25 and 60 apertures were used to cover the full galaxy and measure out into the sky background. Elliptical apertures were generally used with major to minor axis ratio taken from NED or from Moss & Whittle (unpublished), and with position angles determined from the images themselves using the Starlink function Object Detection in GAIA. For some objects with no published axis ratio values, or for which the given axis ratio did not appear to fit well the outer isophotes of the galaxy, axis ratios were estimated from the data. For face-on galaxies, or those with peculiar shapes, circular apertures were employed.
The centre of each galaxy was generally found by centroiding on the nucleus of the R band image in GAIA. In a few cases it was found necessary to determine the centre by eye. The R band was preferred for the centroiding process due to the relative smoothness of the R band emission compared to the clumpier H data.
Before photometry was carried out, all stars or stellar residuals were masked from each image. Counts were then measured in each aperture, with sky subtraction performed using an annular sky region outside the largest galaxy aperture. These were converted to H flux or R band flux density according to the procedure given in section 3.2, and were then combined to create growth curves for R band flux density, H flux and EW (H flux/R flux density), which form the basis of the remainder of this study.
4 Global parameters
Global parameters for the observed galaxies are listed in Table 2. These parameters include the absolute B magnitude; the isophotal radius, , which is the semi-major axis of the isophote equal to 24 mag ; the apparent magnitude, , which corresponds to the light enclosed within this isophote; values of H flux and EW; and the total star formation rate for the galaxy. Each of these parameters is explained in more detail the sections that follow.
| CGCG | Run | H | Type | R.A. (2000) Dec. | a/b | PA | H flux | H EW | SFR | ||||
|---|---|---|---|---|---|---|---|---|---|---|---|---|---|
| filter | (h m s) | (° ′ ″) | (∘) | (″) | () | (nm) | (M⊙yr-1) | ||||||
| Abell 262 | |||||||||||||
| 521-073 | JKT94 | H668 | -20.9 | S pec | 01 44 35.5 | +37 41 45 | 1.6 | 17 | 31 | 13.17 | 58(5) | 4.6(0.4) | 4.8 |
| 521-074 | JKT94 | H668 | -19.8 | S: pec | 01 44 38.4 | +34 39 37 | 4.5 | 86 | 20 | 14.70 | 12(1) | 3.9(0.4) | 1.0 |
| 521-078 | JKT94 | H668 | -19.6 | Sc/SBc | 01 45 51.8 | +35 06 39 | 1.4 | 144 | 18 | 14.27 | 19(2) | 4.2(0.4) | 1.6 |
| 522-003 | JKT94 | H666 | -19.3 | pec | 01 46 56.8 | +34 46 21 | 1.5 | 87 | 17 | 13.97 | 16(2) | 2.7(0.3) | 1.4 |
| 522-006 | JKT94 | H668 | -19.3 | SAbc: pec | 01 47 43.6 | +35 01 21 | 1.0 | … | 17 | 13.91 | 17(2) | 2.6(0.3) | 1.4 |
| 522-011 | NOT | H50 | -19.0 | S0/a | 01 49 18.1 | +34 58 06 | 1.7 | 40 | 16 | 14.70 | 15(1) | 5.1(0.4) | 1.2 |
| 522-020 | JKT94 | H666 | -21.6 | SBb | 01 50 44.2 | +35 17 04 | 1.7 | 141 | 68 | 12.32 | 45(7) | 1.6(0.3) | 3.8 |
| 522-021 | NOT | H50 | -20.5 | S | 01 50 47.9 | +35 55 58 | 3.8 | 60 | 72 | 12.92 | 3(3) | 0.2(0.2) | 0.2 |
| 522-024 | JKT94 | H668 | -20.3 | SA: pec | 01 50 47.9 | +35 55 58 | 1.5 | 163 | 34 | 13.16 | 36(4) | 2.9(0.3) | 3.0 |
| 522-025 | JKT94 | H671 | -19.2 | SAbc: | 01 52 02.8 | +36 07 52 | 1.4 | 6 | 19 | 14.04 | 20(2) | 3.5(0.3) | 1.7 |
| 522-038 | NOT | H51 | -20.7 | Sc/SBc | 01 52 45.9 | +36 37 10 | 1.0 | … | 37 | 12.72 | 45(5) | 2.5(0.3) | 3.7 |
| 522-041 | NOT | H51 | -20.3 | SABc | 01 52 53.9 | +36 03 10 | 1.0 | … | 32 | 13.25 | 59(4) | 5.3(0.4) | 4.9 |
| 522-053 | NOT | H51 | -19.5 | S0: | 01 53 57.0 | +36 38 28 | 2.3 | 35 | 28 | 13.97 | 5(1) | 0.9(0.2) | 0.4 |
| 522-055 | JKT94 | H668 | -20.6 | SBc | 01 54 19.8 | +36 37 47 | 4.2 | 138 | 36 | 13.10 | 8(3) | 0.6(0.2) | 0.6 |
| 522-058 | JKT92 | H669 | -20.5 | SBa | 01 54 53.8 | +36 55 05 | 1.2 | 73 | 38 | 13.05 | 20(4) | 1.4(0.3) | 1.7 |
| 522-069 | JKT94 | H668 | -19.7 | SAc: | 01 55 58.5 | +37 07 46 | 1.1 | 36 | 20 | 13.31 | 14(3) | 1.2(0.3) | 1.1 |
| 522-072 | NOT | H50 | -19.2 | E/S0:: pec | 01 56 21.4 | +35 34 21 | 1.2 | 126 | 15 | 14.22 | 7(1) | 1.5(0.3) | 0.6 |
| 522-074 | JKT94 | H668 | -19.9 | Sc | 01 56 21.1 | +37 27 08 | 8.7 | 123 | 24 | 15.78 | 2(1) | 2.1(0.9) | 0.2 |
| 522-077 | JKT94 | H668 | -19.1 | SBb: pec | 01 56 30.5 | +37 20 08 | 1.2 | 43 | 15 | 14.02 | 8(2) | 1.4(0.3) | 0.7 |
| 522-079 | JKT94 | H668 | -19.4 | SA:c: | 01 56 39.9 | +35 35 32 | 1.8 | 135 | 17 | 14.12 | 13(2) | 2.4(0.3) | 1.1 |
| 522-081 | JKT92 | H669 | -20.3 | S | 01 56 46.1 | +36 53 11 | 2.0 | 54 | 46 | 13.64 | … | … | … |
| 522-086 | JKT94 | H668 | -22.2 | SAB:c | 01 57 42.2 | +35 54 58 | 1.5 | 126 | 71 | 11.59 | 181(18) | 3.4(0.3) | 15.1 |
| 522-096 | JKT94 | H668 | -20.3 | Sc | 01 59 06.7 | +36 03 47 | 8.0 | 107 | 31 | 14.95 | 4(1) | 1.4(0.3) | 0.3 |
| 522-100 | JKT94 | H666 | -19.7 | SB(s)dm | 02 00 11.2 | +37 36 12 | 1.2 | 6 | 30 | 13.99 | 15(2) | 2.5(0.3) | 1.2 |
| 522-102 | JKT94 | H666 | -21.1 | SB:ab | 02 00 54.9 | +38 12 39 | 2.6 | 83 | 60 | 13.00 | 31(4) | 2.1(0.3) | 2.6 |
| Abell 347 | |||||||||||||
| 538-037 | JKT94 | H668 | -20.2 | Sc | 02 15 54.1 | +42 49 26 | 4.0 | 105 | 29 | 15.47 | 4(1) | 2.6(0.7) | 0.4 |
| 538-043 | JKT92 | H669 | -20.1 | pec | 02 20 03.8 | +41 16 28 | 1.5 | 120 | 33 | 14.00 | 42(3) | 7.2(0.5) | 4.7 |
| 538-046 | JKT94 | H668 | -19.7 | SA:b: | 02 20 35.0 | +41 34 27 | 1.2 | 64 | 22 | 14.17 | 8(4) | 1.6(0.7) | 0.9 |
| 538-048 | JKT92 | H669 | -20.5 | S pec | 02 21 23.3 | +42 52 35 | 3.6 | 126 | 51 | 13.95 | 18(2) | 2.9(0.3) | 2.0 |
| 523-028 | JKT98 | H671 | -21.5 | SA(s)b pec† | 02 21 28.7 | +39 22 32 | 1.6 | 51 | 65 | 12.28 | … | … | … |
| 523-029 | JKT98 | H671 | -20.2 | SB(s)a pec† | 02 21 32.6 | +39 21 25 | 3.8 | 89 | 46 | 14.43 | 9(3) | 2.2(0.7) | 1.0 |
| 538-054 | JKT94 | H671 | -19.5 | Sa: | 02 22 50.4 | +42 09 29 | 2.0 | 93 | 22 | 14.75 | 5(1) | 1.6(0.3) | 0.5 |
| 538-063 | JKT94 | H668 | -19.8 | Sbc | 02 24 47.3 | +42 01 28 | 2.7 | 48 | 26 | 14.37 | 8(1) | 1.8(0.3) | 0.9 |
| 539-023 | JKT94 | H668 | -20.7 | SAc | 02 26 05.2 | +42 08 39 | 1.4 | 63 | 18 | 13.14 | 1(3) | 0.1(0.2) | 0.1 |
| 539-024 | JKT92 | H669 | -20.5 | SBb | 02 26 46.3 | +41 50 04 | 2.0 | 142 | 50 | 13.24 | 35(4) | 3.0(0.3) | 4.0 |
| 539-025 | JKT94 | H666 | -19.8 | SB pec | 02 26 53.1 | +41 41 25 | 1.2 | 11 | 28 | 13.48 | 13(2) | 1.4(0.3) | 1.4 |
| 539-029 | JKT94 | H671 | -19.7 | S | 02 27 31.2 | +41 55 51 | 2.0 | 47 | 30 | 13.69 | 14(2) | 1.7(0.3) | 1.5 |
| 539-030 | NOT | H51 | -20.8 | Sb: | 02 27 34.6 | +41 58 39 | 1.6 | 105 | 35 | 13.06 | 52(5) | 3.9(0.4) | 5.8 |
| 539-031 | NOT | H51 | -19.9 | S0/a | 02 27 36.7 | +42 00 28 | 1.3 | 142 | 20 | 13.99 | 25(2) | 4.4(0.4) | 2.8 |
| 539-036 | JKT92 | H669 | -20.8 | Sab | 02 31 14.3 | +40 23 25 | 3.3 | 117 | 51 | 13.87 | 15(2) | 2.2(0.3) | 1.6 |
| 539-038 | JKT92 | H669 | -19.3 | S pec | 02 31 26.6 | +40 14 51 | 1.0 | … | 23 | 14.24 | 14(2) | 3.0(0.3) | 1.6 |
| 539-044 | JKT94 | H668 | -20.1 | pec | 02 33 40.2 | +41 20 47 | 3.0 | 143 | 28 | 14.17 | 21(2) | 4.2(0.4) | 2.4 |
| Abell 400 | |||||||||||||
| 415-020 | NOT | H53 | -21.3 | S0 | 02 53 41.2 | +06 15 55 | 3.8 | 142 | 80 | 12.55 | 30(6) | 1.4(0.3) | 5.3 |
| 415-021 | JKT94 | H674 | -20.9 | SAB:c | 02 53 58.8 | +05 59 16 | 1.1 | 7 | 29 | 13.83 | 33(3) | 4.8(0.4) | 5.8 |
| 415-025 | JKT94 | H674 | -20.5 | S | 02 55 19.9 | +06 07 29 | 1.0 | 0 | 20 | 13.80 | 33(3) | 4.6(0.4) | 5.8 |
| 415-028 | NOT | H53 | -21.1 | SABc | 02 55 46.9 | +06 13 03 | 1.0 | … | 36 | 13.24 | 27(3) | 2.4(0.3) | 4.8 |
| 415-030 | JKT94 | H674 | -21.5 | Sc | 02 55 57.6 | +06 29 41 | 2.5 | 165 | 43 | 13.70 | 26(3) | 3.3(0.3) | 4.6 |
| 415-031 | NOT | H53 | -21.0 | Sc | 02 56 17.6 | +04 31 46 | 3.5 | 158 | 44 | 14.67 | 8(1) | 2.5(0.3) | 1.3 |
| 415-032 | NOT | H53 | -21.0 | SBbc | 02 56 22.7 | +06 09 19 | 2.5 | 6 | 32 | 14.63 | 11(1) | 3.6(0.3) | 2.0 |
| 415-033 | NOT | H53 | -20.5 | S0:: pec | 02 56 28.3 | +04 36 38 | 1.0 | … | 19 | 14.02 | 16(2) | 2.9(0.3) | 2.8 |
| 415-035 | NOT | H53 | -21.4 | SBa | 02 56 43.1 | +07 20 01 | 1.0 | … | 39 | 12.61 | 16(5) | 0.8(0.2) | 2.9 |
| 415-037 | NOT | H53 | -21.3 | Sc | 02 56 46.9 | +04 58 40 | 3.7 | 141 | 48 | 13.71 | 8(2) | 1.2(0.3) | 1.5 |
| 415-038 | NOT | H51 | -20.5 | S0† | 02 56 56.6 | +06 12 20 | 1.3 | 40 | 19 | 14.20 | 13(1) | 2.9(0.3) | 2.4 |
| 415-039 | NOT | H53 | -21.0 | SA:b | 02 57 09.2 | +05 19 15 | 1.5 | 67 | 32 | 13.48 | 10(2) | 1.1(0.3) | 1.8 |
| 415-048 | JKT94 | H671 | -21.2 | S | 02 58 29.7 | +06 18 23 | 1.7 | 47 | 34 | 13.18 | 36(4) | 2.9(0.3) | 6.4 |
| 415-051 | NOT | H53 | -21.0 | Sab† | 02 59 52.3 | +06 31 59 | 1.8 | 156 | 32 | 13.68 | 15(2) | 2.0(0.3) | 2.7 |
| 415-052 | NOT | H51 | -20.4 | SA0/a: | 03 00 08.6 | +05 48 16 | 1.0 | … | 23 | 13.70 | 1(2) | 0.1(0.2) | 0.1 |
| 415-058 | NOT | H53 | -20.6 | Sbc: | 03 04 39.2 | +05 26 35 | 1.8 | 57 | 29 | 14.20 | 8(1) | 1.7(0.3) | 1.4 |
| CGCG | Run | H | Type | R.A. (2000) Dec. | a/b | PA | H flux | H EW | SFR | ||||
|---|---|---|---|---|---|---|---|---|---|---|---|---|---|
| filter | (h m s) | (° ′ ″) | (∘) | (″) | () | (nm) | (M⊙yr-1) | ||||||
| Abell 426 | |||||||||||||
| 540-047 | NOT | H51 | -21.1 | Sb | 03 09 42.7 | +40 58 27 | 5.5 | 130 | 54 | 13.29 | … | … | … |
| 540-049 | JKT94 | H662 | -21.3 | S-Irr | 03 10 12.9 | +40 45 56 | 2.0 | 71 | 29 | 12.54 | 50(7) | 2.2(0.3) | 5.0 |
| 540-058 | NOT | H53 | -20.3 | Sb pec | 03 13 10.2 | +42 59 49 | 1.7 | 25 | 22 | 14.18 | 13(1) | 2.8(0.3) | 1.3 |
| 525-009 | JKT94 | H666 | -21.0 | SBc | 03 14 40.5 | +39 37 03 | 1.4 | 139 | 25 | 12.93 | 55(5) | 3.5(0.3) | 5.5 |
| 525-011 | NOT | H50 | -20.9 | Sb | 03 14 58.0 | +39 20 56 | 2.2 | 37 | 40 | 13.61 | 21(2) | 2.6(0.3) | 2.1 |
| 540-064 | JKT92 | H669 | -21.7 | SBb | 03 15 01.4 | +42 02 09 | 1.1 | 70 | 50 | 12.54 | 88(18) | 3.9(0.8) | 8.8 |
| 540-067 | JKT94 | H668 | -20.1 | SA:a: | 03 15 20.5 | +41 36 45 | 1.3 | 37 | 18 | 14.11 | 17(2) | 3.2(0.3) | 1.7 |
| 540-069 | JKT94 | H666 | -21.7 | SABc | 03 16 00.8 | +40 53 08 | 2.8 | 3 | 41 | 13.90 | 10(7) | 1.5(1.1) | 1.0 |
| 540-070 | JKT94 | H668 | -21.1 | Sab | 03 16 01.0 | +42 04 28 | 2.4 | 165 | 46 | 13.15 | 5(4) | 0.4(0.2) | 0.5 |
| 540-071 | NOT | H53 | -20.3 | SA:a: | 03 16 02.9 | +42 55 18 | 1.4 | 77 | 27 | 13.95 | 16(2) | 2.7(0.3) | 1.6 |
| 540-073 | NOT | H50 | -21.6 | Sa | 03 16 26.1 | +41 31 50 | 5.7 | 67 | 82 | 12.95 | 2(3) | 0.1(0.2) | 0.2 |
| 540-078 | NOT | H51 | -20.7 | Sa: | 03 16 59.7 | +41 21 24 | 4.7 | 71 | 54 | 13.38 | 2(2) | 0.2(0.2) | 0.2 |
| 540-083 | NOT | H50 | -21.0 | Sab | 03 17 50.4 | +41 58 03 | 5.0 | 89 | 70 | 13.67 | 1(2) | 0.1(0.2) | 0.1 |
| 540-084 | JKT92 | H669 | -21.5 | SBb | 03 17 52.3 | +43 18 15 | 1.8 | 68 | 57 | 12.70 | 35(16) | 1.8(0.8) | 3.5 |
| 540-091 | JKT92 | H669 | -22.0 | SBc | 03 18 45.3 | +43 14 27 | 2.2 | 0 | 54 | 13.66 | 52(4) | 6.5(0.5) | 5.2 |
| 540-093 | NOT | H50 | -21.3 | SAb | 03 18 45.2 | +41 29 19 | 1.7 | 130 | 39 | 13.11 | … | … | … |
| 540-094 | JKT94 | H671 | -20.9 | Sbc | 03 18 53.4 | +40 35 45 | 2.4 | 62 | 27 | 13.45 | 20(3) | 2.1(0.3) | 2.0 |
| 540-100 | JKT94 | H674 | -20.7 | Sc? pec | 03 19 27.4 | +41 38 07 | 2.5 | 119 | 37 | 13.58 | 12(2) | 1.4(0.3) | 1.2 |
| 540-103 | JKT94 | H668 | -22.9 | pec: | 03 19 48.2 | +41 30 42 | 1.3 | 104 | ** | 10.44 | 658(57) | 4.2(0.4) | 66.0 |
| 540-106 | NOT | H50 | -20.3 | Sa? | 03 20 05.2 | +40 54 22 | 3.0 | 178 | 38 | 13.81 | … | … | … |
| 540-112A | NOT | H50 | -20.6 | … pec | 03 21 19.9 | +41 55 55 | 1.0 | … | 40 | 12.92 | 17(4) | 1.1(0.3) | 1.7 |
| 540-112B | NOT | H50 | -20.7 | S:… pec | 03 21 20.0 | +41 55 44 | 5.0 | 112 | 59 | 13.84 | 3(2) | 0.5(0.2) | 0.3 |
| 540-114 | NOT | H50 | -20.6 | S:a: | 03 21 32.8 | +40 24 37 | 3.5 | 14 | 47 | 13.75 | 1(2) | 0.2(0.2) | 0.1 |
| 540-121 | JKT92 | H669 | -21.4 | SB:b | 03 22 53.8 | +42 33 12 | 3.8 | 129 | 77 | 12.76 | 19(9) | 1.0(0.5) | 1.9 |
| 541-005 | NOT | H50 | -21.6 | Sb | 03 25 52.3 | +40 44 56 | 4.7 | 128 | 67 | 13.26 | 18(3) | 1.6(0.3) | 1.8 |
| 541-006 | NOT | H51 | -20.7 | SBb | 03 25 59.2 | +40 47 21 | 1.0 | … | 43 | 12.45 | 29(6) | 1.2(0.3) | 2.9 |
| 541-008 | NOT | H51 | -22.0 | Sab | 03 26 27.6 | +40 30 29 | 5.0 | 68 | 88 | 12.73 | 6(4) | 0.3(0.2) | 0.6 |
| 541-009 | JKT94 | H666 | -20.5 | SBc | 03 27 39.8 | +40 53 49 | 1.3 | 114 | 30 | 13.55 | 11(2) | 1.3(0.3) | 1.1 |
| 541-011 | NOT | H50 | -21.2 | SB:b: pec | 03 28 27.8 | +40 09 16 | 2.7 | 76 | 44 | 13.26 | 74(5) | 6.8(0.5) | 7.5 |
| 541-017 | JKT94 | H666 | -21.6 | pec: | 03 30 01.8 | +41 49 55 | 2.1 | 118 | 45 | 12.45 | 117(9) | 4.8(0.4) | 11.7 |
| Abell 569 | |||||||||||||
| 234-043 | JKT94 | H668 | -21.1 | SB:ab | 07 03 02.8 | +49 25 28 | 2.3 | 43 | 40 | 13.21 | 22(3) | 1.8(0.3) | 2.6 |
| 234-050 | NOT | H51 | -20.8 | SBa: | 07 06 00.3 | +50 30 37 | 2.8 | 131 | 48 | 12.76 | 3(4) | 0.2(0.2) | 0.4 |
| 234-051 | NOT | H51 | -20.5 | SBa | 07 05 59.0 | +50 45 22 | 1.3 | 124 | 41 | 13.00 | 8(3) | 0.6(0.2) | 0.9 |
| 234-056 | JKT97 | H669 | -20.1 | S pec | 07 07 32.4 | +48 54 00 | 1.5 | 121 | 18 | 14.42 | 28(2) | 7.0(0.5) | 3.4 |
| 234-057 | NOT | H51 | -19.1 | pec | 07 07 51.4 | +48 24 55 | 1.0 | … | 13 | 15.01 | 6(1) | 2.7(0.3) | 0.7 |
| 234-060 | NOT | H51 | -21.1 | SBb | 07 08 11.0 | +50 40 55 | 1.1 | 99 | 65 | 11.88 | 29(10) | 0.8(0.2) | 3.5 |
| 234-061 | JKT94 | H671 | -19.5 | SAa: | 07 08 09.7 | +48 55 46 | 1.1 | 93 | 17 | 13.86 | 3(2) | 0.5(0.2) | 0.4 |
| 234-062 | NOT | H51 | -20.1 | SB:a: | 07 08 12.2 | +49 08 17 | 1.4 | 100 | 28 | 13.73 | 3(2) | 0.4(0.2) | 0.3 |
| 234-065 | NOT | H51 | -19.3 | SB: pec | 07 08 31.2 | +48 08 13 | 1.0 | … | 16 | 14.67 | 11(1) | 3.5(0.3) | 1.3 |
| 234-066 | JKT97 | H669 | -20.0 | pec: | 07 08 34.2 | +50 37 53 | 1.7 | 3 | 32 | 14.15 | 24(2) | 4.6(0.4) | 2.8 |
| 234-067 | JKT94 | H671 | -20.0 | Sa: | 07 08 47.3 | +48 59 41 | 1.4 | 71 | 23 | 14.28 | 17(2) | 3.7(0.3) | 2.0 |
| 234-069 | JKT97 | H669 | -19.5 | Sa: | 07 09 03.6 | +48 34 24 | 1.2 | 139 | 19 | 14.54 | 14(1) | 3.8(0.4) | 1.6 |
| 234-071 | JKT94 | H666 | -19.7 | SB: pec | 07 09 15.9 | +49 49 13 | 1.2 | 118 | 22 | 14.00 | 24(2) | 4.1(0.4) | 2.9 |
| 234-077 | JKT94 | H671 | -19.9 | S0: | 07 09 39.4 | +47 54 54 | 1.7 | 140 | 29 | 13.67 | … | … | … |
| 234-079A | JKT94 | H671 | -19.8 | S: pec | 07 09 54.8 | +47 54 28 | 1.6 | 120 | 22 | 14.44 | 14(1) | 3.5(0.3) | 1.7 |
| 234-079B | JKT94 | H671 | -19.9 | S: pec | 07 09 53.6 | +47 54 47 | 2.7 | 16 | 35 | 14.31 | 10(1) | 2.3(0.3) | 1.2 |
| 234-085 | NOT | H51 | -19.3 | … | 07 10 52.2 | +48 12 13 | 1.4 | 133 | 15 | 15.01 | 6(1) | 2.7(0.3) | 0.7 |
| 234-088A | NOT | H51 | -20.4 | Sab | 07 11 01.2 | +48 30 47 | 3.0 | 160 | 48 | 13.32 | 9(3) | 0.8(0.2) | 1.0 |
| 234-088B | NOT | H51 | -18.8 | … | 07 11 00.8 | +48 31 56 | 1.7 | 149 | 16 | 14.95 | 3(1) | 1.4(0.3) | 0.4 |
| 234-090 | JKT94 | H668 | -20.5 | Sbc | 07 10 58.3 | +49 01 22 | 4.0 | 103 | 33 | 14.83 | 5(1) | 1.8(0.3) | 0.6 |
| 234-092 | NOT | H51 | -19.4 | Sa: | 07 11 08.8 | +49 53 58 | 1.0 | … | 21 | 14.26 | 10(1) | 2.2(0.3) | 1.2 |
| 234-093 | JKT94 | H668 | -20.8 | SBb | 07 11 28.0 | +48 14 24 | 1.4 | 54 | 41 | 12.88 | 18(4) | 1.1(0.3) | 2.2 |
| 234-094 | JKT97 | H669 | -19.8 | S-Irr | 07 11 30.3 | +49 04 50 | 1.4 | 175 | 25 | 14.44 | 12(1) | 3.1(0.3) | 1.4 |
| 234-096 | NOT | H51 | -19.8 | E/S0 | 07 11 38.2 | +46 56 09 | 1.0 | … | 18 | 13.96 | 7(1) | 1.2(0.3) | 0.8 |
| 234-102 | NOT | H51 | -21.0 | Sb: | 07 12 51.0 | +49 00 21 | 4.0 | 153 | 58 | 13.48 | 10(2) | 1.1(0.3) | 1.2 |
| 234-103 | NOT | H51 | -19.9 | Sa: | 07 12 56.0 | +49 45 53 | 1.2 | 152 | 26 | 13.69 | 6(2) | 0.9(0.2) | 0.8 |
| 234-107 | JKT94 | H668 | -19.8 | Sc | 07 13 47.6 | +50 15 26 | 2.0 | 56 | 21 | 14.10 | 14(2) | 2.7(0.3) | 1.7 |
| 234-114 | NOT | H51 | -19.5 | SAa: | 07 16 13.0 | +48 16 19 | 1.0 | … | 18 | 14.28 | 1(1) | 0.2(0.2) | 0.1 |
| 234-115 | NOT | H51 | -19.3 | … | 07 16 52.3 | +49 52 29 | 2.0 | 148 | 24 | 14.57 | 3(1) | 0.9(0.2) | 0.3 |
| Abell 779 | |||||||||||||
| 180-060 | JKT98 | H671 | -19.7 | Sa: | 09 13 45.4 | +34 50 14 | 1.3 | 58 | 17 | 14.36 | 7(1) | 1.6(0.3) | 1.1 |
| CGCG | Run | H | Type | R.A. (2000) Dec. | a/b | PA | H flux | H EW | SFR | ||||
|---|---|---|---|---|---|---|---|---|---|---|---|---|---|
| filter | (h m s) | (° ′ ″) | (∘) | (″) | () | (nm) | (M⊙yr-1) | ||||||
| 181-007 | NOT | H51 | -19.5 | SA:a: | 09 17 56.2 | +34 30 34 | 1.2 | 139 | 19 | 14.65 | 4(1) | 1.3(0.3) | 0.7 |
| 181-012 | NOT | H51 | -20.1 | Sa: | 09 18 34.0 | +34 17 38 | 3.0 | 21 | 34 | 14.46 | 0(1) | 0.1(0.2) | 0.0 |
| 181-013 | JKT94 | H671 | -20.6 | Sb: | 09 18 35.7 | +34 33 11 | 4.7 | 153 | 43 | 14.13 | 3(1) | 0.6(0.2) | 0.5 |
| 181-016 | NOT | H51 | -19.8 | SBa | 09 19 17.4 | +34 00 29 | 1.8 | 35 | 30 | 13.92 | … | … | … |
| 181-017 | NOT | H53 | -20.5 | S:a: | 09 19 22.4 | +33 44 34 | 3.3 | 85 | 49 | 13.69 | … | … | … |
| 181-023 | JKT94 | H671 | -20.5 | S | 09 19 41.4 | +33 44 17 | 4.3 | 111 | 41 | 14.20 | 4(1) | 0.9(0.2) | 0.7 |
| 181-030 | JKT94 | H671 | -20.1 | SB:b | 09 20 36.9 | +33 04 29 | 2.7 | 3 | 28 | 14.24 | 6(1) | 1.2(0.3) | 0.9 |
| 181-032 | JKT98 | H674 | -20.4 | SBb | 09 20 52.7 | +35 22 06 | 1.1 | 98 | 30 | 13.31 | 20(3) | 1.8(0.3) | 3.4 |
| 181-045 | NOT | H51 | -20.0 | S:b: | 09 27 16.0 | +34 25 38 | 2.5 | 174 | 27 | 14.49 | 2(1) | 0.4(0.2) | 0.3 |
| Abell 1367 | |||||||||||||
| 126-074 | JKT94 | H671 | -20.2 | SBb pec | 11 31 01.9 | +20 28 21 | 1.7 | 88 | 24 | 13.54 | 35(3) | 3.9(0.4) | 5.0 |
| 126-075 | JKT94 | H671 | -19.8 | SB | 11 31 03.7 | +20 14 08 | 2.0 | 57 | 23 | 13.59 | … | … | … |
| 126-100 | NOT | H51 | -20.3 | SB:ab | 11 34 53.5 | +20 29 17 | 3.2 | 67 | 41 | 14.39 | 11(1) | 3.0(0.3) | 1.6 |
| 126-104 | JKT98 | H671 | -19.8 | SAB…pec | 11 35 35.0 | +20 30 19 | 2.3 | 116 | 25 | 14.67 | 16(1) | 5.1(0.4) | 2.3 |
| 127-002 | NOT | H53 | -19.6 | Sa pec | 11 36 53.2 | +21 00 15 | 1.4 | 47 | 21 | 14.40 | 8(1) | 2.1(0.3) | 1.2 |
| 97-026 | JKT94 | H671 | -20.7 | SBa pec | 11 36 54.4 | +19 58 15 | 1.8 | 8 | 27 | 13.43 | 70(5) | 7.1(0.5) | 10.1 |
| 97-027 | JKT94 | H671 | -20.4 | SB:a pec | 11 36 54.2 | +19 59 50 | 1.8 | 33 | 28 | 13.75 | 15(2) | 2.0(0.3) | 2.1 |
| 97-033 | JKT94 | H671 | -19.9 | S(B)a | 11 37 36.0 | +20 09 49 | 1.8 | 88 | 27 | 14.10 | 5(1) | 1.0(0.2) | 0.8 |
| 127-012A | NOT | H53 | -21.2 | Sc: | 11 37 53.9 | +21 58 53 | 3.4 | 106 | 72 | 13.19 | 6(3) | 0.5(0.2) | 0.9 |
| 127-012B | NOT | H53 | -19.6 | SAb | 11 37 55.0 | +21 59 08 | 1.3 | 1 | 19 | 14.30 | 18(2) | 4.3(0.4) | 2.6 |
| 127-016 | NOT | H53 | -20.1 | Sa: | 11 39 16.2 | +20 25 38 | 2.8 | 71 | 36 | 14.02 | 2(1) | 0.3(0.2) | 0.2 |
| 97-041 | NOT | H51 | -19.7 | SAa: | 11 39 24.5 | +19 32 04 | 1.3 | 78 | 22 | 14.25 | 6(1) | 1.3(0.3) | 0.8 |
| 127-025A | JKT98 | H671 | -20.5 | Sab: pec | 11 40 44.2 | +22 25 46 | 1.0 | 113 | 27 | 13.24 | 23(3) | 1.9(0.3) | 3.3 |
| 127-025B | JKT98 | H671 | -19.8 | S: | 11 40 44.5 | +22 26 48 | 2.5 | 56 | 29 | 13.97 | 21(2) | 3.4(0.3) | 2.9 |
| 97-062 | JKT94 | H674 | -19.8 | Sa: pec | 11 42 14.8 | +19 58 35 | 2.7 | 55 | 26 | 14.67 | 7(1) | 2.3(0.3) | 1.0 |
| 97-064 | JKT94 | H668 | -19.5 | SA0 | 11 42 14.6 | +20 05 52 | 2.5 | 140 | 28 | 14.52 | … | … | … |
| 97-068 | JKT94 | H668 | -20.6 | SBc pec | 11 42 24.5 | +20 07 10 | 1.6 | 104 | 33 | 13.53 | 26(3) | 2.9(0.3) | 3.7 |
| 97-072 | JKT98 | H671 | -20.4 | SBab | 11 42 45.2 | +20 01 57 | 1.8 | 114 | 33 | 13.74 | 9(2) | 1.2(0.3) | 1.3 |
| 97-073 | JKT94 | H674 | -19.4 | SAcd: pec | 11 42 56.4 | +19 57 58 | 1.0 | … | 18 | 14.93 | 18(1) | 7.4(0.5) | 2.6 |
| 97-079 | JKT98 | H671 | -19.3 | S: pec | 11 43 13.4 | +20 00 17 | 1.6 | 108 | 17 | 15.38 | 24(1) | 14.8(0.9) | 3.5 |
| 97-087 | JKT98 | H671 | -21.6 | Sd pec | 11 43 49.1 | +19 58 06 | 6.3 | 134 | 67 | 13.28 | 80(5) | 7.0(0.5) | 11.4 |
| 97-091 | JKT98 | H674 | -20.5 | SABb | 11 43 59.0 | +20 04 37 | 1.4 | 54 | 30 | 13.58 | 27(3) | 3.1(0.3) | 3.9 |
| 97-092A | JKT98 | H671 | -19.2 | S0 pec | 11 43 58.2 | +20 11 06 | 1.6 | 14 | 15 | 15.19 | 10(1) | 5.3(0.4) | 1.5 |
| 97-093 | JKT94 | H668 | -19.9 | Sa: | 11 44 01.9 | +19 47 04 | 3.0 | 139 | 30 | 14.85 | 10(1) | 3.6(0.3) | 1.4 |
| 97-102A | NOT | H51 | -19.9 | Sa | 11 44 17.2 | +20 13 24 | 1.5 | 135 | 26 | 13.76 | 6(2) | 0.9(0.2) | 0.9 |
| 97-114 | JKT94 | H674 | -19.2 | S0/a: pec | 11 44 47.8 | +19 46 24 | 1.0 | … | 13 | 15.03 | 14(1) | 6.1(0.4) | 2.0 |
| 97-120A | JKT94 | H668 | -20.9 | SAab | 11 44 49.2 | +19 47 42 | 2.0 | 41 | 44 | 12.94 | 9(4) | 0.6(0.2) | 1.3 |
| 97-121 | NOT | H51 | -20.8 | SBb pec | 11 44 47.1 | +20 07 30 | 1.5 | 30 | 38 | 13.11 | 11(3) | 0.8(0.2) | 1.5 |
| 97-122 | JKT94 | H668 | -20.7 | Sb pec | 11 44 52.2 | +19 27 15 | 4.0 | 56 | 39 | 13.80 | 23(2) | 3.2(0.3) | 3.3 |
| 97-125 | JKT94 | H674 | -19.8 | Sa: pec | 11 44 54.8 | +19 46 35 | 1.2 | 69 | 25 | 14.14 | 8(1) | 1.5(0.3) | 1.1 |
| 97-129A | NOT | H50 | -21.6 | SABb | 11 45 03.9 | +19 58 25 | 1.8 | 73 | 65 | 12.43 | 27(6) | 1.2(0.3) | 3.9 |
| 127-045 | JKT98 | H671 | -20.6 | SAa | 11 45 05.9 | +20 26 18 | 1.2 | 40 | 30 | 13.31 | 6(3) | 0.6(0.2) | 0.9 |
| 127-046 | JKT94 | H674 | -20.0 | SB:bc pec | 11 45 05.7 | +21 24 42 | 2.2 | 128 | 28 | 14.28 | 9(4) | 2.0(0.8) | 1.3 |
| 97-129B | NOT | H51 | -20.1 | S:… | 11 45 07.0 | +19 58 01 | 2.3 | 113 | 31 | 14.59 | 5(1) | 1.5(0.3) | 0.7 |
| 97-138 | NOT | H50 | -19.6 | SAc | 11 45 44.7 | +20 01 52 | 1.0 | … | 19 | 15.00 | 15(1) | 6.6(0.5) | 2.1 |
| 127-049 | JKT98 | H671 | -20.1 | SBab | 11 45 48.8 | +20 37 43 | 3.3 | 65 | 33 | 14.50 | 16(1) | 4.4(0.4) | 2.3 |
| 127-050 | NOT | H51 | -20.7 | SBc | 11 45 55.6 | +21 01 32 | 1.1 | 179 | 39 | 13.24 | 15(3) | 1.4(0.3) | 2.2 |
| 127-051A | NOT | H53 | -19.6 | SB0/a | 11 45 59.9 | +20 26 20 | 1.8 | 124 | 25 | 14.11 | 14(2) | 2.9(0.3) | 2.1 |
| 127-051B | NOT | H53 | -19.3 | Sa pec | 11 45 59.5 | +20 26 50 | 2.0 | 150 | 19 | 14.74 | 6(1) | 2.2(0.3) | 0.9 |
| 127-052 | JKT98 | H671 | -21.1 | SA0 | 11 46 12.2 | +20 23 30 | 1.6 | 7 | 48 | 12.61 | 9(5) | 0.4(0.2) | 1.3 |
| 127-055 | JKT98 | H671 | -19.5 | SAa | 11 46 46.7 | +21 16 17 | 1.0 | … | 14 | 14.19 | 18(2) | 3.6(0.3) | 2.5 |
| 97-149 | NOT | H51 | -19.7 | SAa: | 11 47 15.0 | +19 10 33 | 1.2 | 84 | 22 | 14.31 | 2(1) | 0.6(0.2) | 0.3 |
| 97-151 | NOT | H51 | -19.8 | Sa: | 11 47 28.2 | +18 03 13 | 3.5 | 25 | 26 | 15.06 | 2(1) | 0.8(0.2) | 0.2 |
| 97-152 | NOT | H51 | -20.1 | SBa: | 11 47 39.3 | +19 56 22 | 2.5 | 128 | 31 | 13.97 | 4(1) | 0.7(0.2) | 0.6 |
| 127-056 | JKT94 | H671 | -20.1 | Sb: | 11 48 27.5 | +21 09 23 | 3.3 | 79 | 31 | 14.66 | 5(1) | 1.5(0.3) | 0.7 |
| 127-062 | NOT | H51 | -20.0 | SB:a | 11 49 30.3 | +21 02 37 | 2.0 | 175 | 31 | 14.07 | 3(1) | 0.5(0.2) | 0.4 |
| 97-160 | JKT94 | H671 | -19.4 | S0/a | 11 50 33.4 | +17 51 29 | 1.2 | 81 | 17 | 13.85 | 2(2) | 0.3(0.2) | 0.3 |
| 127-067 | JKT94 | H671 | -19.5 | S? pec | 11 50 39.5 | +20 54 26 | 1.3 | 173 | 17 | 14.35 | 11(1) | 2.5(0.3) | 1.5 |
| 127-068 | JKT94 | H671 | -19.7 | S-Irr | 11 50 52.7 | +21 10 08 | 1.5 | 153 | 18 | 13.94 | 19(2) | 3.1(0.3) | 2.8 |
| 127-071 | JKT94 | H671 | -19.4 | S pec | 11 50 55.4 | +21 08 43 | 1.7 | 75 | 14 | 14.45 | 24(2) | 6.2(0.5) | 3.5 |
| 97-168 | JKT98 | H674 | -20.1 | Sbc: | 11 51 48.4 | +19 21 29 | 4.5 | 106 | 28 | 15.63 | 5(0) | 3.7(0.3) | 0.7 |
| 97-169 | NOT | H51 | -20.7 | Sc | 11 51 52.5 | +18 32 46 | 9.0 | 151 | 46 | 15.73 | 4(0) | 3.7(0.3) | 0.6 |
| 97-172 | NOT | H53 | -19.7 | SABb: | 11 52 14.5 | +18 39 03 | 2.0 | 165 | 22 | 15.25 | 4(1) | 2.3(0.3) | 0.6 |
| CGCG | Run | H | Type | R.A. (2000) Dec. | a/b | PA | H flux | H EW | SFR | ||||
|---|---|---|---|---|---|---|---|---|---|---|---|---|---|
| filter | (h m s) | (° ′ ″) | (∘) | (″) | () | (nm) | (M⊙yr-1) | ||||||
| 97-174 | NOT | H53 | -19.8 | Sc: | 11 52 43.9 | +18 36 49 | 2.0 | 132 | 24 | 15.15 | 4(1) | 2.1(0.3) | 0.6 |
| 97-180 | JKT94 | H671 | -19.4 | Sab | 11 54 13.9 | +20 01 39 | 2.3 | 123 | 17 | 14.82 | 9(1) | 3.2(0.3) | 1.3 |
| 127-072 | NOT | H51 | -20.8 | SABbc | 11 51 01.1 | +20 23 57 | 1.0 | … | 35 | 13.30 | 17(3) | 1.6(0.3) | 2.5 |
| 127-073 | NOT | H51 | -20.5 | SBab | 11 51 02.2 | +20 47 59 | 1.0 | … | 34 | 13.35 | 8(2) | 0.8(0.2) | 1.1 |
| 127-082 | NOT | H51 | -20.5 | SAc | 11 51 59.8 | +21 06 30 | 1.3 | 121 | 28 | 13.61 | 21(2) | 2.6(0.3) | 3.0 |
| 127-083 | NOT | H51 | -20.0 | Sa | 11 52 19.9 | +21 06 08 | 1.3 | 153 | 22 | 13.83 | 6(2) | 1.0(0.2) | 0.9 |
| 127-085 | JKT94 | H671 | -20.0 | Sa | 11 52 30.5 | +20 37 32 | 3.0 | 73 | 28 | 14.35 | 4(1) | 1.0(0.2) | 0.6 |
| 127-090 | NOT | H51 | -20.6 | SBa | 11 52 56.6 | +20 28 45 | 1.0 | … | 31 | 12.98 | 4(3) | 0.2(0.2) | 0.5 |
| 127-095 | JKT98 | H668 | -21.2 | SBb | 11 53 20.3 | +20 45 06 | 1.2 | 97 | 44 | 12.60 | 41(6) | 1.9(0.3) | 5.8 |
| 127-096 | NOT | H51 | -19.9 | SAa | 11 53 20.6 | +21 01 18 | 1.2 | 85 | 23 | 13.84 | 5(2) | 0.7(0.2) | 0.7 |
| 127-100 | NOT | H51 | -20.5 | SBab | 11 53 59.7 | +20 34 21 | 1.4 | 29 | 32 | 13.49 | 7(2) | 0.8(0.2) | 1.0 |
| Abell 1656 | |||||||||||||
| 159-101 | JKT98 | H674 | -19.4 | Irr† | 12 52 48.9 | +27 24 06 | 1.3 | 89 | 14 | 14.95 | 14(1) | 5.7(0.4) | 2.9 |
| 159-102 | JKT98 | H671 | -20.9 | Sab† | 12 52 53.6 | +28 22 16 | 2.5 | 32 | 36 | 13.30 | 35(4) | 3.1(0.3) | 5.9 |
| 160-020 | JKT98 | H668 | -19.2 | Sa† | 12 56 06.1 | +27 40 40 | 1.4 | 171 | 13 | 14.92 | 26(2) | 10.3(0.6) | 4.4 |
| 160-025 | NOT | H51 | -21.1 | SBa | 12 56 27.8 | +26 59 15 | 1.3 | 150 | 36 | 12.81 | 3(4) | 0.2(0.2) | 0.6 |
| 160-026 | JKT98 | H674 | -19.5 | S0/a: | 12 56 28.5 | +27 17 28 | 1.4 | 66 | 17 | 15.31 | 11(1) | 6.2(0.5) | 1.8 |
| 160-031 | NOT | H51 | -20.1 | Sa† | 12 56 49.7 | +27 05 38 | 4.0 | 147 | 36 | 14.48 | 1(1) | 0.3(0.2) | 0.2 |
| 160-033 | JKT98 | H668 | -19.6 | E† | 12 56 51.2 | +26 53 56 | 1.0 | … | 14 | 14.42 | 8(1) | 2.0(0.3) | 1.3 |
| 160-055 | JKT98 | H671 | -21.2 | SB:ab | 12 58 05.6 | +28 14 33 | 3.2 | 151 | 41 | 13.53 | 39(3) | 4.3(0.4) | 6.6 |
| 160-058 | JKT98 | H674 | -20.2 | S | 12 58 09.3 | +28 42 31 | 3.3 | 84 | 29 | 15.14 | 6(1) | 2.9(0.3) | 1.0 |
| 160-064 | JKT98 | H674 | -19.5 | pec | 12 58 35.3 | +27 15 53 | 1.2 | 69 | 15 | 15.18 | 10(1) | 5.0(0.4) | 1.7 |
| 160-067 | JKT98 | H674 | -19.3 | pec | 12 58 37.3 | +27 10 36 | 1.3 | 12 | 13 | 14.97 | 18(1) | 7.4(0.5) | 3.0 |
| 160-068 | NOT | H53 | -20.5 | (R’)SA0-?† | 12 58 35.2 | +27 35 47 | 1.2 | 83 | 24 | 13.24 | 5(3) | 0.4(0.2) | 0.8 |
| 160-071 | JKT | H671 | -19.4 | S0/a† | 12 58 52.1 | +27 47 06 | 1.8 | 133 | 20 | 14.81 | 21(1) | 7.4(0.5) | 3.5 |
| 160-072 | JKT | H668 | -19.9 | S0/a | 12 58 48.5 | +27 48 37 | 3.9 | 53 | 28 | 14.84 | 1(1) | 0.2(0.2) | 0.1 |
| 160-075 | NOT | H54 | -19.4 | pec | 12 59 02.1 | +28 06 56 | 1.2 | 31 | 14 | 14.93 | 13(1) | 5.4(0.4) | 2.1 |
| 160-078 | NOT | H51 | -20.0 | E/S0: | 12 59 05.3 | +27 38 40 | 1.1 | 79 | 20 | 14.34 | 6(1) | 1.4(0.3) | 1.0 |
| 160-099 | JKT98 | H668 | -19.3 | Sa: | 12 59 40.1 | +28 37 51 | 1.0 | … | 15 | 15.24 | 8(1) | 4.1(0.4) | 1.3 |
| 160-127 | JKT98 | H674 | -19.3 | pec | 13 00 33.7 | +27 38 16 | 1.4 | 65 | 13 | 15.38 | 7(1) | 4.4(0.4) | 1.2 |
| 160-130 | JKT98 | H674 | -20.4 | pec: | 13 00 38.0 | +28 03 27 | 3.3 | 151 | 30 | 14.62 | 13(3) | 3.9(0.9) | 2.2 |
| 160-132 | JKT98 | H674 | -20.8 | S | 13 00 39.7 | +29 01 10 | 2.0 | 56 | 36 | 13.61 | 14(2) | 1.7(0.3) | 2.4 |
| 160-139 | NOT | H51 | -20.7 | SB:ab | 13 00 48.8 | +28 09 30 | 1.1 | 39 | 31 | 13.15 | 5(3) | 0.4(0.2) | 0.9 |
| 160-147 | NOT | H51 | -21.9 | SBa | 13 01 26.1 | +27 53 10 | 1.1 | 2 | 67 | 12.06 | 22(8) | 0.7(0.2) | 3.7 |
| 160-148A | JKT98 | H671 | -20.3 | S pec | 13 01 25.3 | +29 18 50 | 1.7 | 125 | 27 | 13.85 | 19(2) | 2.8(0.3) | 3.1 |
| 160-148B | JKT98 | H671 | -20.3 | S pec | 13 01 24.5 | +29 18 30 | 1.0 | … | 27 | 12.91 | … | … | … |
| 160-150 | JKT98 | H674 | -19.8 | S pec | 13 01 25.1 | +28 40 37 | 1.5 | 110 | 19 | 14.70 | 2(1) | 0.5(0.2) | 0.3 |
| 160-154 | JKT98 | H671 | -20.7 | Sab | 13 01 43.4 | +29 02 40 | 3.0 | 85 | 33 | 14.23 | 8(1) | 1.8(0.3) | 1.4 |
| 160-156 | JKT98 | H671 | -19.1 | SA0† | 13 02 00.2 | +27 46 58 | 2.0 | 52 | 14 | 14.72 | 2(1) | 0.5(0.2) | 0.3 |
| 160-158 | JKT98 | H671 | -19.6 | S0 pec?† | 13 02 07.9 | +27 38 54 | 1.4 | 76 | 16 | 14.67 | 12(1) | 3.7(0.3) | 2.0 |
| 160-159 | NOT | H53 | -20.9 | Sa: | 13 02 04.2 | +29 15 12 | 4.5 | 156 | 49 | 13.47 | 2(2) | 0.2(0.2) | 0.3 |
| 160-160 | JKT98 | H674 | -19.6 | pec | 13 02 12.8 | +28 12 53 | 1.7 | 150 | 18 | 14.84 | 11(1) | 4.0(0.4) | 1.9 |
| 160-169 | JKT98 | H668 | -19.4 | S† | 13 03 05.9 | +26 31 52 | 1.5 | 176 | 16 | 14.79 | 5(1) | 1.7(0.3) | 0.8 |
| 160-176A | NOT | H51 | -22.1 | Sab | 13 03 49.9 | +28 11 09 | 3.0 | 88 | 71 | 12.69 | … | … | … |
| 160-179 | JKT98 | H668 | -19.8 | S: pec | 13 04 26.6 | +27 18 16 | 1.5 | 65 | 21 | 14.98 | 16(1) | 6.5(0.5) | 2.6 |
| 160-180 | JKT98 | H674 | -19.3 | pec | 13 04 22.8 | +28 48 39 | 1.3 | 177 | 12 | 15.39 | 12(1) | 7.2(0.5) | 2.0 |
| 160-191 | JKT98 | H668 | -20.5 | pec | 13 06 38.1 | +28 50 53 | 1.8 | 169 | 32 | 14.60 | 23(2) | 6.9(0.5) | 3.9 |
| 160-193 | JKT98 | H674 | -19.3 | Sc+† | 13 07 13.2 | +28 02 49 | 1.1 | 165 | 14 | 14.94 | 9(1) | 3.7(0.3) | 1.6 |
Explanation of columns of Table 2.
Column 1. CGCG number (Zwicky et al. 1960–68). The numbering of CGCG galaxies in field 160 (Abell 1656) follows that of the SIMBAD data base, with an enumeration in order of increasing R.A.
Column 2. Observing run: JKT92, JKT94, JKT97 – Jacobus Kapteyn Telescope 1992 (service data), December 1994 and November 1997 respectively. NOT – Nordic Optical Telescope (5–8 January 2005).
Column 4. Absolute B magnitude (see section 4.1)
Column 5. Galaxy type taken from Moss, Whittle & Pesce (1998); Moss & Whittle (2000, 2005). For galaxies for which no type is listed by these authors, the NED type is given (marked by † in the Table).
Columns 6 & 7. R.A. and Declination (J2000) taken from NED.
Columns 8, 9 & 10. The major-to-minor axis ratio, position angle, and 24 mag arcsec-2 isophotal radius respectively.
Column 11. R band apparent magnitude. The typical error in this measurement is mag.
Columns 12 & 13. H flux and EW within the R band 24 mag arcsec-2 isophote. (Error is given in parentheses.)
Column 14. Global star formation rate (see section 4.4).
4.1 Absolute B magnitudes
Absolute B magnitudes for the sample galaxies were calculated from CGCG photographic magnitudes. These magnitudes were converted to the system following RC3 and corrected for Galactic absorption using extinction maps of Schlegel et al. (1998) and the conversion of Cardelli et al. (1998). A correction was also applied for internal extinction, dependent on the inclination of the galaxy, as detailed in RC3. K-corrections were taken from Poggianti (1987) for the mean sample cluster redshift . Cluster distances were found from mean cluster recession velocities corrected to the centre of the local group following de Vaucouleurs et al. (1976), and assuming km . All sample galaxies were assumed to be cluster members, and the appropriate cluster distance was used to obtain the absolute magnitude.
4.2 Isophotal radii and R magnitudes
Following the methods of Koopmann, Kenney & Young (2001), an outer isophotal radius, , is defined at 24 mag in the R band. This provides a direct tracer of size or luminosity, and allows the normalisation of profiles of galaxies of different sizes or distances.
For the observed galaxies, the isophote was found by calculating the mean surface brightness of the annulus formed by each successive pair of apertures in the R band growth curves; this is then set to be the local surface brightness at the mean semi-major axis of each annulus. Linear interpolation between points gives the semi-major axis at which the local surface brightness first drops below 24 mag .
The apparent magnitude, , corresponds to the integrated R band light out to the isophote. The uncertainty in this magnitude arising from errors associated with sky and other background subtraction and calibration is typically quite small (). This magnitude was taken as the global value for a galaxy in the subsequent analysis.
It is to be noted that , determined in the above manner, underestimates the total luminosity from the galaxy, since light from outer isophotes fainter than mag has been omitted. A study was made, by comparison with the HGS field sample, to estimate how large is this effect. HGS galaxy R band magnitudes were measured in apertures set such that the enclosed flux varied by less than 0.5% over three consecutive points in the growth curve. The total magnitude was compared with , the magnitude at , calculated for the HGS sample in the same way as for the cluster data. Total R band magnitudes are typically found to be mag brighter than those measured at .
4.3 H flux and EW
The H flux is the integrated H flux out to the isophote; the EW is this integrated flux divided by the corresponding R band flux density to the same isophotal limit. It is to be noted that the EW normalises the star formation rate to the underlying older stellar population, thus providing a measure of the specific star formation rate (i.e. the star formation rate per unit mass). Kennicutt (1998) found that only high mass ( M☉) and therefore short-lived ( Myr) stars made any significant contribution to integrated ionising flux, so EW is a measure of the importance of current or very recent star formation relative to the star formation history of the galaxy.
Errors in the H flux and EW associated with sky and other background subtraction and calibration are typically small ( in flux; and in EW respectively). In contrast, the largest single source of error for both flux and EW comes from the determination of the scaling factor used to subtract the continuum from the H data. The continuum scaling errors were found to depend strongly on EW. Figure 2 shows the percentage error on H fluxes and EWs, due to a 1 change in continuum scaling factor. The points are well fit by a power law, and this has been used in the calculation of individual galaxy errors. These errors range from 4% for the highest EW objects to for those with very low EWs, although the uncertainties are less than 25% for most galaxies within the sample.

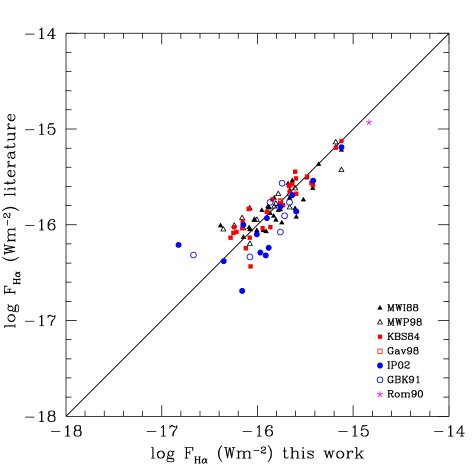
A number of galaxies in the current sample are found in the literature as part of other studies. H fluxes for 32 objects and EWs for 24 are given in Moss, Irwin & Whittle (1988) (MWI88). A later paper (Moss et al. 1998) (MWP98), based on similar observations in Abell 1367, includes further data for 18 galaxies. Thirty objects in our sample are included in an H imaging survey by Gavazzi et al. (1998) (GAV98), 29 in a large aperture photometry survey in the Cancer, Abell 1367, and Coma clusters (Kennicutt, Bothun & Schommer 1984) (KBS84), 15 in a deep H survey of galaxies in Abell 1367 and Coma by Iglesias-Páramo et al. (2002) (IP02), a further 7 in a study of spiral galaxies in the Coma and Hercules superclusters and the Cancer cluster (Gavazzi, Boselli & Kennicutt 1991) (GBK91), and one object in a survey of star formation in spiral galaxies by Romanishin (1990) (Rom90).
Figure 3 (top) shows a comparison between published H fluxes and those found in the present survey. The flux values taken from the literature are uncorrected for extinction effects. Therefore the Galactic extinction corrections applied to the data in the present survey were removed for comparison purposes. No correction has been made for the satellite [NII] lines in any of the comparison data; however the KBS84 and GBK91 fluxes and EWs have been multiplied by 1.16 as suggested by Kennicutt et al. (1994) and Gavazzi et al. (1998) to account for an overestimate of continuum flux in these data, due to the telluric absorption feature near 6900 Å in their red continuum side-band. The solid line shows a one-to-one correlation, which is a good fit to the data. The rms scatter in from 101 comparison measures is 0.18
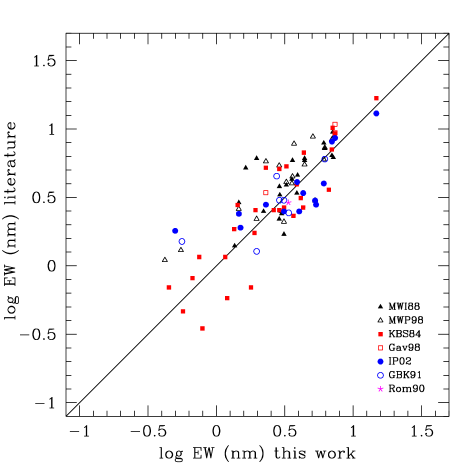
A comparison of calculated EWs with 95 values from the literature is shown in Figure 3 (bottom). Again a one-to-one correlation (solid line) shows good agreement with an rms scatter of 0.20 in .
No corrections have been made to account for the different aperture sizes used in the comparison studies, or for the fact that the total fluxes and EWs in this study are taken at . The true total fluxes are therefore likely to be slightly larger than the literature and current values shown here, as these apertures may not be detecting all of the H emission from the galaxies. In a similar manner as for the R magnitudes (see section 4.2 above), a study was made, by comparison with the HGS field sample, to estimate how large is this effect. It was found that H flux values are typically lower than corresponding total values for HGS galaxies.
4.4 Star formation rates
Cluster distances (see section 4.1) were used to convert H + [NII] fluxes into luminosities. These latter were corrected for internal extinction using a constant value of 1.1 mag (Kennicutt 1983). Following Kennicutt & Kent (1983) a further correction was made to account for the [NII] doublet that lies within the H filter bandpasses. Corrected H luminosities were then converted to star formation rates (SFRs) using the relation,
(Kennicutt, Tamblyn & Congdon 1994), which assumes a Salpeter IMF (Salpeter 1955) with masses ranging from 0.1 to 100 .
Finally, it may be noted that the correction that was made to the H luminosity for contamination by the [NII] doublet depends only on galaxy type, not on luminosity. As is well known, lower luminosity galaxies tend to be less metal-rich than their more luminous counterparts (e.g. Zaritsky, Kennicutt & Huchra 1994; Miller & Hodge 1996); this leads to the expectation of a lower [NII]/H ratio with decreasing galaxy luminosity, which is indeed confirmed observationally (e.g. Jansen et al. 2000; Gavazzi et al. 2004). However, the galaxies in the current dataset cover a relatively narrow magnitude range, brighter than . Furthermore, both Jansen et al. (2000) and Gavazzi et al. (2004) find no significant variation in the [NII]/H ratio within this magnitude range. Thus neglect of any dependence of the [NII]/H on galaxy luminosity for the correction to H luminosities (and hence SFRs) for the present galaxy sample appears to be justified.
5 Completeness of the Objective Prism Survey
The current dataset is for a subsample of galaxies included in the H objective prism survey (OPS) undertaken by Moss and colleagues (see Moss & Whittle, 2000, 2005). Moss et al. (1998) estimated that ELG detection for the OPS was 90% complete above 20 Å(2 nm) EW, and 17% complete below this limit. However these estimates were based on a comparatively small sample of 35 galaxies, for which photoelectric data were available. By contrast, the current CCD dataset includes a complete sample of Sa–Sc galaxies () in six of the eight OPS clusters, of which 43% () were detected as emission-line galaxies (ELGs) by the OPS. This sample may be used to provide a better determination of the completeness of the OPS, as follows.
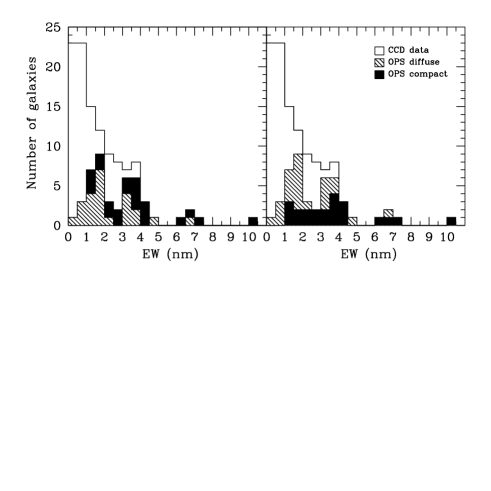
The distribution of ELGs and non-ELGs for the Sa–Sc complete sample with both H EW and flux are shown in Figures 4 and 5 respectively. As is seen from Figure 4, EW is a relatively poor discriminant between ELGs and non-ELGs: while 63% of galaxies are detected as ELGs above 2 nm, some 30% of galaxies are detected below this limit.
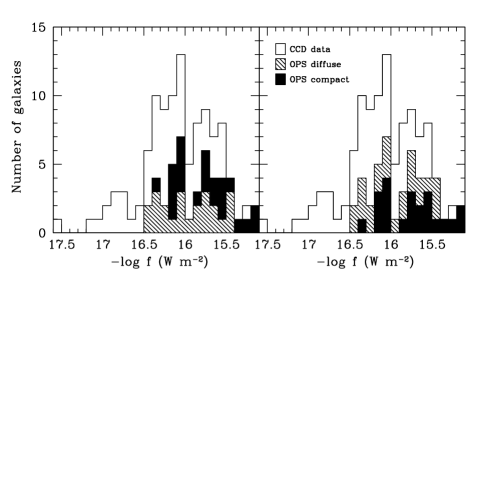
By contrast, H flux appears as a rather better discriminant: below a flux limit, (), no galaxies were detected in emission by the OPS; above this limit, the detection efficiency is 49%, rising to 67% for galaxies with the strongest H flux, ().
However the mean H surface brightness appears to be a better discriminant than either EW or flux. In Figure 6 we show distributions of ELGs and non-ELGs with mean H surface brightness, where is the area of the ellipse centred on the galaxy bounded by the 24 mag isophote. Below a limit, (), only 4 out of 41 galaxies ( 10%) were detected as ELGs by the OPS; above this limit, 63% were detected, rising to 85% above the limit ().
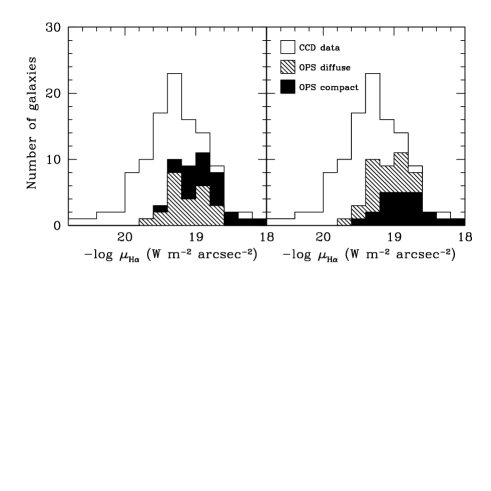
In Figures 4, 5, and 6 detected ELGs are shown as compact or diffuse following their classification by the OPS (for further details, see Moss & Whittle 2000). Compact ELGs have higher H EW, flux, and surface brightness than diffuse ELGs, but there is a broad overlap of all these values between the two ELG types. In particular, H mean surface brightness is not able to discriminate well between compact and diffuse emission since this mean surface brightness is based on a generally larger scale (viz. the isophote) than the smaller scale features visually classified by the OPS. Further discussion of the H surface brightness distribution for individual galaxies, and comparisons of these distributions between field and cluster galaxies will be given in a subsequent paper (Bretherton et al., in preparation).
6 Conclusions
H and R band continuum CCD observations have been completed for a sample of 227 CGCG galaxies associated with 8 low-redshift Abell clusters, which were the subject of an objective prism survey (OPS) by Moss and collaborators (Moss et al. 1998; Moss & Whittle 2000, 2005). The sample galaxies were generally restricted to those with velocities within 3 of the cluster mean, and known AGN have been excluded. R band magnitudes, H fluxes and EWs, and star formation rates for the sample are listed in Table 2.
The dominant constraint on the detection efficiency of emission-line galaxies (ELGs) by the OPS is shown to be H surface brightness. Detection of ELGs is 85%, 70%, and 50% complete at the mean surface brightness values of , , and W m-2 arcsec-2 respectively, where the mean H surface brightness was measured within the R band isophote of 24 mag for the galaxy.
The present data, together with matched sets of data from a recent H galaxy survey of UGC galaxies within km (HGS, Shane 2002; James et al. 2004) will be used for a forthcoming comparative study of R band and H surface photometry between cluster and field spirals (Bretherton et al., in preparation).
Acknowledgments
This research has made use of the NASA/IPAC Extragalactic Database (NED) which is operated by the Jet Propulsion Laboratory, California Institute of Technology, under contract with the National Aeronautics and Space Administration. We thank Anna Hodgkinson for assistance with data preparation for the paper.
References
- Abell (1958) Abell, G.O. 1958, ApJS, 3, 211
- Abell (1958) Abell, G.O., Corwin, H.G., Olowin, R.P. 1989, ApJS, 70, 1
- Bekki et al. (2002) Bekki, K., Couch, W.J., Shioya, Y. 2002, ApJ, 577, 651
- Bessell (1979) Bessell, M.S. 1979, PASP, 91, 589
- Bower & Balogh (2004) Bower, R.G., Balogh, M.L. 2004, in Mulchaey, J.S., Dressler, A., Oemler, A., eds., Clusters of Galaxies: Probes of Cosmological Structure and Galaxy Evolution, Cambridge Univ. Press, p. 325
- Butcher & Oemler (1978) Butcher, H., Oemler, A. 1978, ApJ, 226, 559
- Butcher & Oemler (1984) Butcher, H., Oemler, A. 1984, ApJ, 285, 426
- Byrd & Valtonen (1990) Byrd, G., Valtonen, M. 1990, ApJ, 350, 89
- Cardelli et al. (1989) Cardelli, J.A., Clayton, G.C., Mathis, J.S. 1989, ApJ, 345, 245
- Dressler et al. (1997) de Vaucouleurs, G., de Vaucouleurs, A., Corwin, H.G. 1976, Second Reference Catalogue of Bright Galaxies, University of Texas Press, Austin
- Dressler et al. (1997) Dressler, A., Oemler, A., Couch, W.J., Smail, I., Ellis, R.S., Barger, A., Butcher, H., Poggianti, B.M., Sharples, R.M. 1997, ApJ, 490, 577
- Fasano et al. (2000) Fasano, G., Poggianti, B.M., Couch, W.J., Bettoni, D., Kjaergaard, P., Moles, M. 2000, 542, 673
- Gavazzi et al. (1991) Gavazzi, G., Boselli, A., Kennicutt, R. 1991, AJ, 101, 1207
- Gavazzi et al. (1998) Gavazzi, G., Catinella, B., Carrasco, L., Boselli, A., Contursi, A. 1998, AJ, 115, 1745
- Gavazzi et al. (2004) Gavazzi, G., Zaccardo, A., Sanvito, G., Boselli, A., Bonfanti, C. 2004, A&A, 417, 499
- Gunn & Gott (1972) Gunn, J.E., Gott, J.R. 1972, ApJ, 176, 1
- Iglesias-Paramo et al. (2002) Iglesias-Paramo, J., Boselli, A., Cortese, L., Vilchez, J.M., Gavazzi, G. 2002, A&A, 384, 383
- Iono et al. (2004) Iono, D., Yun, M.S., Mihos, J.C. 2004, ApJ, 616, 199
- James et al. (2004) James, P.A., Shane, N.S., Beckman, J.E., Cardwell, A., Collins, C.A., Etherton, J., de Jong, R.S., Fathi, K., Knapen, J.H., Peletier, R.F., Percival, S.M., Pollaco, D.L., Seigar, M.S., Stedman, S., Steele, I.A. 2004, A&A, 414, 23
- Jansen et al. (2000) Jansen, R.A., Fabricant, D., Franx, M., Caldwell, N. 2000, ApJS, 126, 331
- Kennicutt (1983) Kennicutt, R.C. 1983, ApJ, 272, 54
- Kennicutt (1998) Kennicutt, R.C. 1998, ARA&A, 36, 189
- Kennicutt (1983) Kennicutt, R.C., Kent, S.M. 1983, AJ, 88, 1094
- Kennicutt et al. (1984) Kennicutt, R.C., Bothun, G.D., Schommer, R.A. 1984, AJ, 89, 1279
- Kennicutt et al. (1987) Kennicutt, R.C., Keel, W.C., van der Hulst, J.M., Hummel, E., Roettiger, K.A. 1987, AJ, 93, 1011
- Kennicutt et al. (1994) Kennicutt, R.C., Tamblyn, P., Congdon, C. 1994, ApJ, 435, 22
- Koopmann et al. (2001) Koopmann, R.A., Kenney J.D.P., Young, J. 2001, ApJS, 135, 125
- Koopmann & Kenney (2004) Koopmann, R.A., Kenney J.D.P. 2004, ApJ, 613, 851 (2004a)
- Koopmann & Kenney (2004) Koopmann, R.A., Kenney J.D.P. 2004, ApJ, 613, 866 (2004b)
- Larson et al. (1980) Larson, R.B., Tinsley, B.M., Caldwell, C.N. 1980, ApJ, 237, 692
- Mihos et al. (1992) Mihos, J.C., Richstone, D.O., Bothun, G.D. 1992, ApJ, 400, 153
- Mihos (2004) Mihos, C.J. 2004, in Mulchaey, J.S., Dressler, A., Oemler, A., eds., Clusters of Galaxies: Probes of Cosmological Structure and Galaxy Evolution, Cambridge Univ. Press, p. 277
- Miller & Hodge (1996) Miller, B.W., Hodge, P. 1996, ApJ, 458, 467
- Moore et al. (1999) Moore, B., Lake, G., Quinn, T., Stadel, J. 1999, MNRAS, 304, 465
- Moss et al. (1988) Moss, C., Irwin, M.J., Whittle, M. 1988, MNRAS, 232, 381
- Moss et al. (1998) Moss, C., Whittle, M., Pesce, J.E. 1998, MNRAS, 300, 205
- Moss & Whittle (2000) Moss, C., Whittle, M. 2000, MNRAS, 317, 667
- Moss & Whittle (2004) Moss, C., Whittle, M. 2005, MNRAS, 357, 1337 (Paper V)
- Moss (2006) Moss, C. 2006, MNRAS, 373, 167
- Poggianti (1997) Poggianti, B.M. 1997, A&AS, 122, 399
- Quilis, Moore & Bower (2000) Quilis, V., Moore, B., Bower, R. 2000, Science, 288, 1617
- Romanishin (1990) Romanishin, W. 1990, AJ, 100, 373
- Salpeter (1955) Salpeter, E.E. 1955, ApJ, 121, 161
- Schlegel et al. (1998) Schlegel, D.J., Finkbeiner, D.P., Davis, M. 1998, ApJ, 500, 525
- Shane (2002) Shane, N.S. 2002, PhD thesis, Liverpool John Moores University, UK
- Zaritsky et al. (1960–1968) Zaritsky, D., Kennicutt, R.C., Huchra, J.P. 1994, ApJ, 420, 87
- Zwicky et al. (1960–1968) Zwicky, F., Herzog, E., Wild, P., Karpowicz, M., Kowal, C. 1960–1968, Catalogue of Galaxies and Clusters of Galaxies, Vols. 1–6. California Inst. Tech., Pasadena (CGCG)