Stretching chimeric DNA: a test for the putative S-form
Abstract
Double-stranded DNA ‘overstretches’ at a pulling force of about 65 pN, increasing in length by a factor of 1.7. The nature of the overstretched state is unknown, despite its considerable importance for DNA’s biological function and technological application. Overstretching is thought by some to be a force-induced denaturation, and by others to consist of a transition to an elongated, hybridized state called S-DNA. Within a statistical mechanical model we consider the effect upon overstretching of extreme sequence heterogeneity. ‘Chimeric’ sequences possessing halves of markedly different AT composition elongate under fixed external conditions via distinct, spatially segregated transitions. The corresponding force-extension data display two plateaux at forces whose difference varies with pulling rate in a manner that depends qualitatively upon whether the hybridized S-form is accessible. This observation implies a test for S-DNA that could be performed in experiment. Our results suggest that qualitatively different, spatially segregated conformational transitions can occur at a single thermodynamic state within single molecules of DNA.
I Introduction
Double-stranded DNA elongates abruptly at a force of about 65 pN if it is pulled along its axis Bustamante et al. (2003); Ritort (2006). The resulting ‘overstretched’ form of the molecule is approximately 1.7 times longer than helical B-DNA. Overstretching is of crucial importance for the biological function of DNA: the bacterial protein RecA elongates DNA by a factor of 1.5 upon binding Stasiak et al. (1981); Leger et al. (1998); Fulconis et al. (2006), a mechanism central to homologous recombination and to chromosomal segregation during cell division Alberts et al. (2002). However, the nature of the overstretched state remains a source of considerable controversy: some think overstretched DNA in vitro to be a hybridized form called S-DNA (the ‘B-to-S’ picture) Smith et al. (1996); Cocco et al. (2004); Cluzel et al. (1996); Storm and Nelson (2003); Léger et al. (1999); Haijun et al. (1999), while a competing picture considers overstretching to signal a conversion to unhybrizided single strands (the ‘force-melting’ picture) Williams et al. (2001a); Rouzina and Bloomfield (2001); Williams et al. (2001b); Williams et al. (2002); Williams and Rouzina (2002); Vladescu et al. (2005). We therefore lack full understanding of the basic mechanical and thermodynamic properties of a molecule of central importance to biology and of rapidly increasing importance to technology Biancaniello et al. (2005); Maragakis et al. (2002); Nykypanchuk et al. (2008); Park et al. (2008).
It is not possible to conclusively validate or rule out either picture of overstretching on the basis of existing thermodynamic force-extension data. The variation of overstretching force with parameters such as temperature and salt concentration Williams et al. (2001a); Rouzina and Bloomfield (2001); Williams et al. (2001b), both of which are known to change the melting properties of DNA, implies that melting of the double helix plays an important role in its elongation. Combining these data with the observation that 65 pN of tension provides just enough mechanical energy to render B-DNA single-stranded or ‘molten’ Rouzina and Bloomfield (2001) strongly suggests that overstretching is melting, induced by a pulling force. However, some authors Cocco et al. (2004) charge that molten DNA, in the sense of two parallel but noninteracting single strands, is thermodynamically unstable to a form of DNA in which one strand has frayed or ‘unpeeled’ from the other, and no longer bears tension. The latter state may arise when melting occurs in the vicinity of ‘nicks’ in the phosphate backbone. Nicks are present in many overstretching experiments (see, however, Ref. Limouse et al. (2007)), and are considered to relieve the torsional constrant on the structure, so permitting the two strands to rotate freely when stretched. The instability of melting to unpeeling implies that for nicked DNA the noninteracting parallel-strand conformation is not the stable state at 65 pN. However, this stable state appears not to be the unpeeled form of the molecule, either. Under some conditions overstretched DNA possesses a mechanical stiffness far in excess of that of single-stranded forms of the molecule Cocco et al. (2004), implying that the stable overstretched form at 65 pN is double-stranded, as in the S-DNA picture. This view is bolstered by the observation that a transition to single-stranded (unpeeled) DNA is sometimes observed only at forces well in excess of 100 pN Rief et al. (1999); Clausen-Schaumann et al. (2000). But these observations pose a problem: assuming that overstretching involves the interconversion of two hybridized states, which presumably differ principally in their enthalpic rather than their entropic properties, how does one rationalize the striking temperature dependence of overstretching?
Just as thermodynamic data fail to distinguish between force-melting and B-to-S pictures, so current imaging techniques cannot resolve the structure of overstretched DNA. Further, atomistic simulations of overstretching Harris et al. (2005); Konrad and Bolonick (1996); Lohikoski et al. (2005), while offering valuable insight into molecular mechanisms, cannot approach (by orders of magnitude) the length and time scales characteristic of experiment. We argue, by contrast, that the kinetics of force-extension data, combined with predictions from coarse-grained, statistical mechanical models, may offer a means of discriminating between the two scenarios.
In typical experiments, an optical tweezers Hormeno and Arias-Gonzalez (2006); Williams (2002) or atomic force microscope (AFM) is used to overstretch a single molecule of DNA at constant rate of extension. The loading rate is then reversed, allowing the molecule to recover its original length. If this stretching-shortening cycle is carried out at low temperature, the force-extension traces for each stage superpose, indicating a reversible transition. As temperature increases, stretching and shortening traces become distinct, signaling hysteresis. The degree of this hysteresis increases as temperature increases Mao et al. (2005).
Such temperature-dependent kinetics provides a stringent test of theories of overstretching. Hysteresis is very unusual in a system whose extent is macroscopic in only one dimension, and whose fluctuations involve local free energy differences not much greater than the thermal energy, . Well-known causes of hysteresis in physical systems include strong local interactions that lead to an unfavorable surface tension between coexisting phases within, for instance, magnetic materials or liquid-vapor phase transitions. Overcoming this surface tension in order to nucleate and grow domains of the thermodynamically dominant phase results in sluggish kinetics and hysteresis. However, hysteresis associated with strong interactions increases in degree as temperature decreases, by contrast with overstretching hysteresis. Moreover, surface tension does not grow with domain size in a quasi-one dimensional structure such as DNA. One is led to the conclusion that hysteresis in stretching data implies the emergence of concerted, long-wavelength correlations.
Long-wavelength correlations can emerge from the detachment and re-annealing of strands Smith et al. (1996); Rouzina and Bloomfield (2001). The authors of Ref. Cocco et al. (2004) demonstrated that a kinetic model of strand separation (unpeeling) displayed hysteresis similar in character to that seen in experiment. Building on these observations, we introduced a discrete statistical mechanical model designed to assess the kinetics associated with both the ‘B-to-S’ and ‘force-melting’ pictures of overstretching Whitelam et al. (2008). The model is resolved at the level of individual basepairs and assumes that DNA may locally adopt certain discrete conformational states. It is inspired by and borrows features from models of DNA undergoing thermal melting Zimm and Bragg (1959); Poland and Scheraga (1966); SantaLucia Jr (1998) and overstretching Rouzina and Bloomfield (2001); Cocco et al. (2004). Our conclusion is that indeed long-wavelength correlations of the kind propagated by separating and re-annealing strands induce hysteresis. Crucially, in order to observe a progression with temperature of the degree of hysteresis, we require a progression with temperature of the nature of the overstretched state. This progression results within our model from a competition between the basepairing energy of S-DNA and the entropy liberated upon unpeeling. At low temperatures, S-DNA predominates as the overstretched form. Our model of the B-to-S transition involves only local free energy barriers of magnitude , and at pulling rates considered occurs in equilibrium. At high temperature, unpeeling occurs, whose associated long-wavelength correlations give rise to hysteresis.
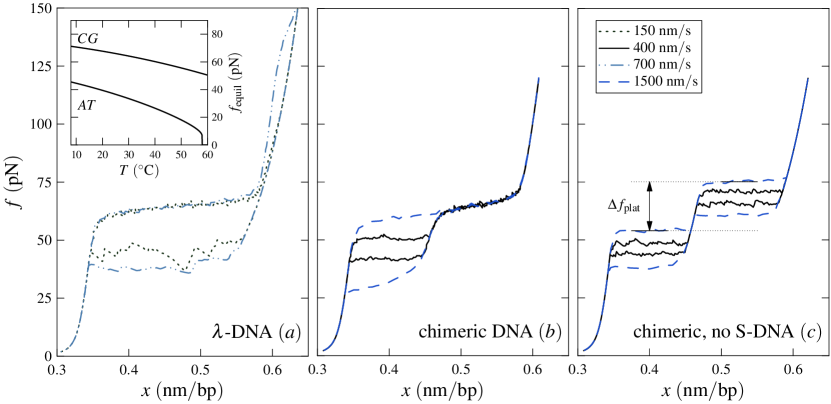
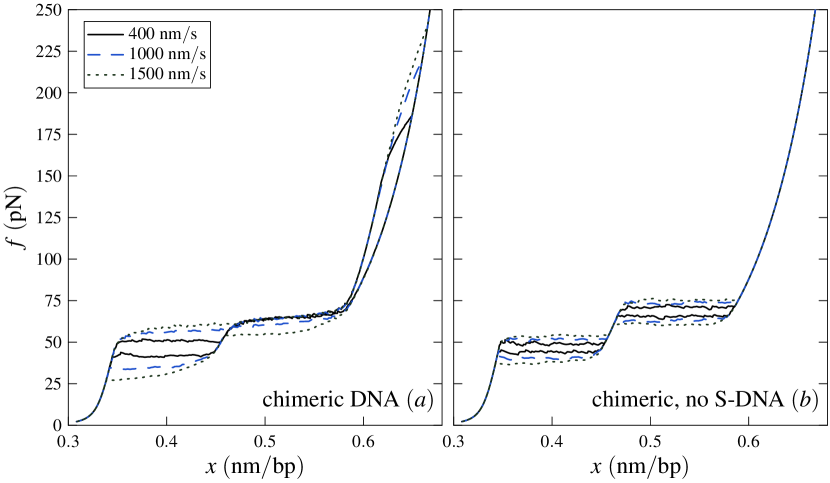
Consequently, we interpret overstretching as a process involving competing conformational transitions, with elements of both pictures required to explain experimental results. This view has several qualitiative implications for experiment, such as the prediction that hysteresis should be a non-monotonic function of pulling rate Whitelam et al. (2008). Here we examine the consequences of this picture of overstretching in a new context, by exploring within our model the effect of extreme sequence heterogeneity upon the competition between unhybridized and hybridized elongated states. We are motivated by the expectation that appropriate sequence design could lead, within the same molecule, to distinct transitions from B-DNA to two different overstretched states. In stretching experiments at room temperature, bacterial -phage DNA (-DNA) (roughly 50:50 AT:CG content, without long-ranged sequence correlations 111Within -DNA, the probability of consecutive stretches of AT or CG basepairs of length decreases exponentially with .) displays a force-extension plateau at about 65 pN, independent of pulling rate between 150 and 3000 nm/s. A second transition is observed at higher forces, strongly dependent upon pulling rate Rief et al. (1999); Clausen-Schaumann et al. (2000). This behavior is illustrated by model calculations in Figure 1, left panel. These observations have been rationalized as two, temporally segregated transitions, the first an equilibrium B-to-S conversion, the second signaling out-of-equilibrium unpeeling Cocco et al. (2004); Whitelam et al. (2008). We demonstrate here that one can dramatically exaggerate the differences between these transitions by designing sequences that permit such changes to occur in a spatially segregated fashion. We suggest that testing for similar segregation in experiment will reveal if indeed there exists an elongated, hybridized state.
II Model
Our model resolves detail at the level of individual basepairs. We assume that each basepair, of type AT, TA, CG or GC (we assume fully complementary alignment), may instantaneously adopt one of four discrete states. These are the helical B-form; two different unhybridized forms (M, or molten, corresponding to internal molten bubbles; and U, or unpeeled, in which only one strand is load-bearing); and the putative S-form. The model takes as its input coarse-grained free energetic properties of each state, and via a Monte Carlo algorithm offers kinetic predictions on length- and timescales characteristic of experiments. Full details are given in Ref. Whitelam et al. (2008), with two modifications considered in this paper. The first accounts for a nearest-neighbor dependence of basepairing-stacking energies SantaLucia Jr (1998), while the second accounts for the sequence-dependence of the heat capacity of melting Rouzina and Bloomfield (2001); Williams et al. (2001b). We assume that specific heats of melting of AT and CG basepairs are zero at (i.e. Taylor expanded about), respectively, the (salt-dependent) melting temperatures of AT- and CG-DNA. This gives a model in which the stabilities of AT and CG basepairs are more similar at lower temperatures or higher salt conditions than under the converse conditions. While such details matter greatly when considering changes in overstretching behavior with temperature, they play essentially no role in determining changes with pulling rate. We evolve our model according to a dynamic protocol designed to mimic optical trap or AFM pulling experiments. We increment at constant rate the position of one end of the molecule, allowing the position of the molecule end tethered to an imaginary optical trap or cantilever to fluctuate. We calculate the resulting tension subject to the constraint of mechanical equilibrium. Basepair fluctuations are assumed to occur on a timescale derived from fluorescence correlation spectroscopy Altan-Bonnet et al. (2003); Metzler and Ambjörnsson (2005); Ambjörnsson et al. (2006); we discuss this choice in Appendix B.
III Results
We consider simulations of ‘chimeric’ DNA fragments whose left halves consist of basepairs having chemical composition AT or TA with respective probabilities , and CG or GC with respective probabilities . We call the ‘sequence disorder’ parameter. The right halves have a corresponding structure with the replacement . Thus indicates a perfectly segregated sequence, while corresponds to a completely random sequence. We place one nick at the left extremity of the AT-rich half. The nick permits unpeeling, which at the pulling rates and temperatures we consider occurs in preference to the internal molten bubble configuration (M). We perform calculations on sequences of lengths from 10 kilobasepairs to 200 basepairs.
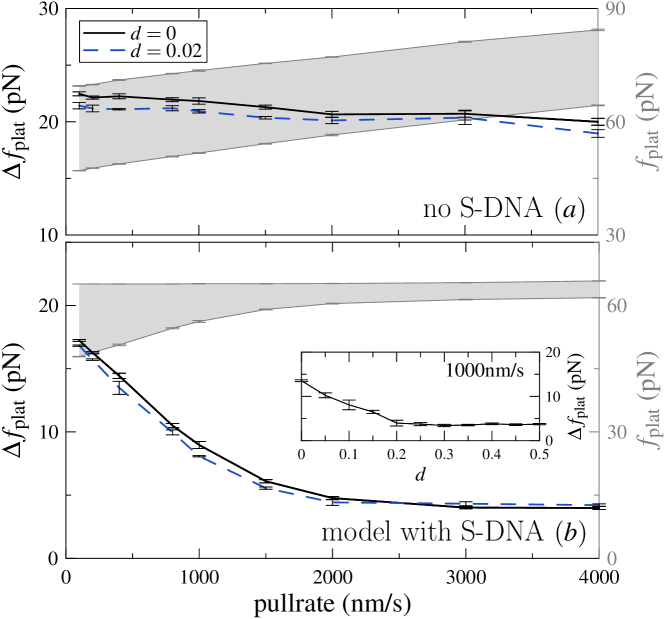
In Figure 1 (b,c) we show that in simulations modeling stretching near room temperature these constructs display two distinct force-extension plateaux, corresponding to unpeeling of the AT-rich half (b,c, lower plateaux) and one of two fates for the CG-rich half. When we permit the model to access the S-state, the CG half can elongate by way of the B-to-S transition (b, upper plateau). When S-DNA is not included in the model, the CG half unpeels, albeit at a higher force than does the AT-rich half (c, upper plateau). Plateaux resulting from unpeeling, which occurs out of equilibrium, display strong pulling rate dependence Cocco et al. (2004); Rief et al. (1999); Whitelam et al. (2008); plateaux signalling equilibrium B-to-S conversion do not. Consequently, the difference in ‘height’ (force) between double plateaux, , varies with pulling rate in a manner that depends qualitatively upon whether the molecule may access the hybridized S-state. When S-DNA is accessible, varies strongly with pulling rate. When S-DNA is inaccessible we find that the difference in height between unpeeling plateaux is almost insensitive to pulling rate, because the mechanism of strand separation is similarly hysteretic for both halves. We note that at higher forces, within the B-to-S model, one can observe a three-stage transition within chimeric sequences (Appendix A). We note also that at temperatures high enough that S-DNA is unstable at about pN to unpeeling of CG basepairs, the B-to-S model describes a variation of with pulling rate similar to that of the force-melting model (data not shown).
In Figure 2 we quantify these observations by plotting versus pulling rate with S-DNA included in the model (a) or not (b). The behavior of is qualitatively and strikingly different within the two scenarios, and constitutes the key result of this paper. The corresponding pulling experiments would reveal, firstly, if force-extension data for chimeric sequences exhibit double plateaux, and secondly, if so, how these plateaux vary with pulling rate. We argue that pronounced variation with pulling rate of would imply overstretching via two distinct mechanisms, suggesting that elongation is possible via both unhybridized and hybridized states.
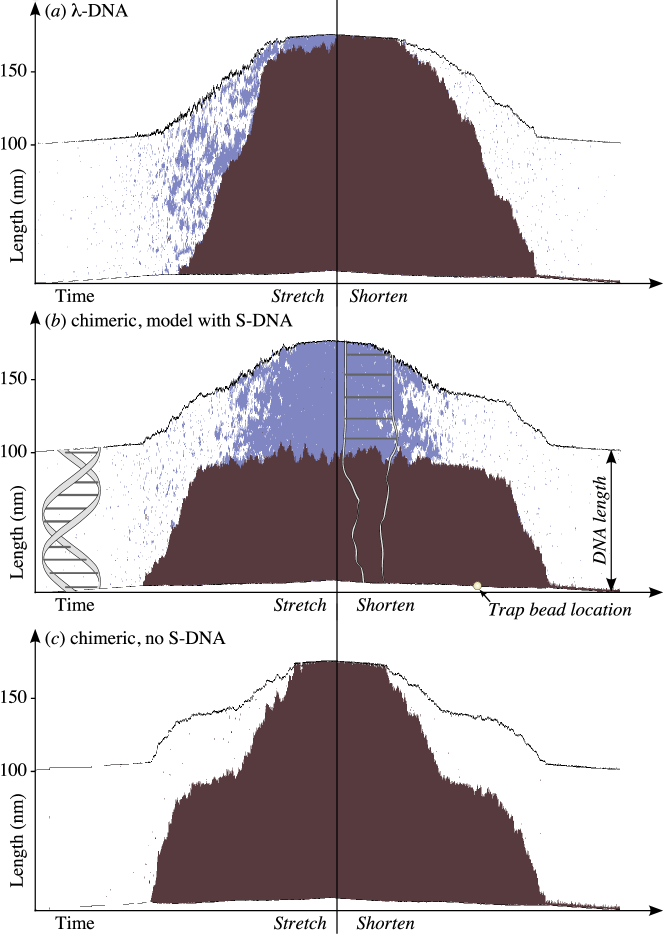
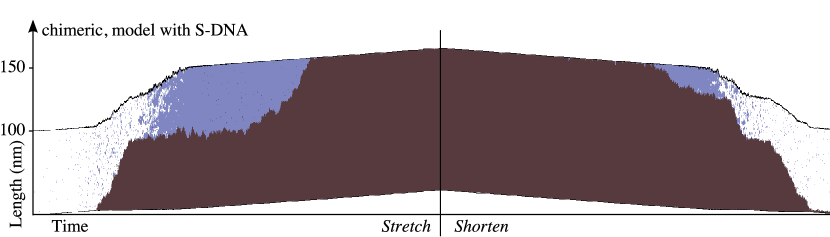
In Figure 3 we show the time-dependent microscopic configurations that underlie these force-extension data, comparing -DNA (a) with chimeric DNA (b,c). The spatially distinct transitions observed within strongly heterogeneous sequences are of different character depending on whether S-DNA is assumed to exist (b) or not (c). The microscopic signature of unpeeling is a long-wavelength drift of the domain wall separating hybridized and unhybridized conformations.
Our results indicate that clean segregation between overstretching transitions (signaled by distinct double plateaux in force-extension data) occurs for molecules as short as 200 bp (data not shown), and for sequence disorder parameters as large as . For the B-to-S model, these segregated transitions are different in nature (unpeeling versus B-to-S conversion) for temperatures C at 150 mM NaCl (and for higher temperatures at higher salt concentrations). These results suggest that DNA-elongating proteins, such as RecA, could induce within DNA stretching transitions whose character differs with sequence composition, conferring upon the elongated RecA-DNA complex Stasiak et al. (1981); Leger et al. (1998) a sequence-dependent elasticity. Our results also suggest that precise melting of localized regions of DNA can be effected by stretching molecules whose sequences are appropriately designed. Such precision de-hybridization would facilitate basepair doping with ligands, allowing one to modify the conductance properties of the molecule in a spatially heterogeneous fashion. Control of conductance would enhance DNA’s usefulness as a nanowire in molecular electronics devices.
We expect that in experiment the effects of secondary structure will play only a minor role in the scenarios we have discussed. While it is likely that hairpins, for instance, will form in separated strands that are very AT- or CG-rich, and while indeed hairpins give rise to additional plateaux at 9 pN (AT) and 20 pN (CG) upon repeated extension Rief et al. (1999), we argue that hairpin formation will not influence strongly the heights of the plateaux measured upon first extension of the DNA. Plateaux heights will be influenced if the dynamics of the unpeeled ‘front’ is restricted by the formation of a hairpin in the non tension-bearing strand. This would be a concern were the front to move diffusively, in which case its reverse movement might be blocked by a hairpin formed in its wake. However, at the pulling rates we consider the motion of the front is super-diffusive, and its dynamics is not strongly affected by potential blockages in its wake.
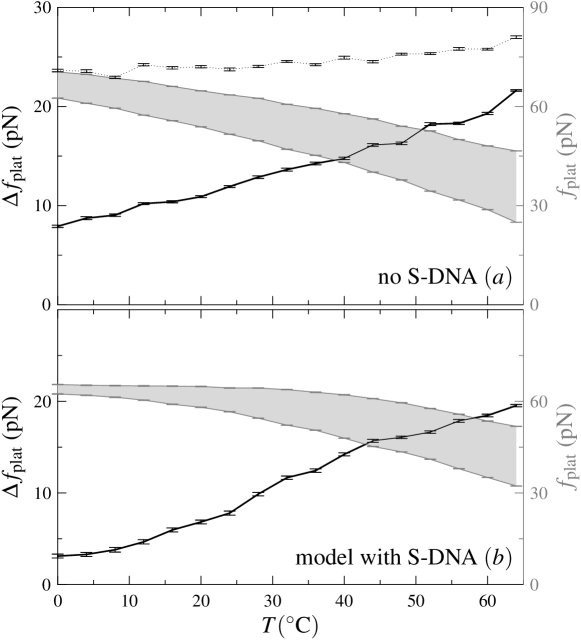
We end with the observation that varying temperature provides a much less clear assessment of the nature of distinct overstretching transitions than does varying pulling rate. In our simulations, force-extension data for strongly heterogeneous sequences display double plateaux, but the variation of the heights of these plateaux with temperature does not indicate clearly the nature of the responsible overstretching mechanism. We demonstrate this point in Figure 4. Accounting for the sequence dependence of specific heats of melting, the temperature dependence of the plateaux height difference is not changed qualitatively by allowing or suppressing the S-state. To make predictions on the basis of the slight difference that does exist would require precise knowledge of the sequence dependence of the specific heat of melting Williams et al. (2001b). Indeed, the variation with of the height of the unpeeling plateaux (accessible even within the B-to-S model at sufficiently high temperature) should allow one to use stretching experiments to measure the specific heat of melting per basepair. We conclude that the most striking test for S-DNA is kinetic in nature.
We have shown that within a statistical mechanical model of DNA overstretching one can induce spatial segregation of competing transitions through appropriate sequence design. The force-extension signatures of these distinct transitions vary with pulling rate in a manner that depends qualitatively on the accessibility of an elongated, hybridized state. We propose that the corresponding experiments would provide a means of assessing whether indeed such a state exists. Our results also suggest that de-hybridization of specific locations within a DNA molecule can be effected by subjecting appropriately designed sequences to external force. Such precision melting would permit, for instance, doping of DNA at specific locations, allowing fine control of its conductance properties.
We thank J. Ricardo Arias-González for discussions. SW was supported initially by the DOE, and subsequently by BioSim European Union Network of Excellence (LSHB-CT-2004-005137). SP was supported by the California Institute for Quantitative Biosciences and the NSF. PLG acknowledges support from the Biomolecular Materials Program administered by the Materials Sciences Division of Lawrence Berkeley National Laboratory (DOE grant number DE-AC0205CH11231). SW acknowledges a Royal Society conference grant that made possible a collaborative visit. Computing facilities were provided in part by the Centre for Scientific Computing at the University of Warwick with support from the Science Research Investment Fund.
IV Appendix A: Multi-stage elongation of chimeric sequences
Simulations performed on chimeric sequences in Figure 1 of the main text (panels b,c) used a maximum pulling force of 120 pN, and reveal two distinct plateaux. At higher forces we observe within the B-to-S model a third plateaux corresponding to a pulling rate-dependent unpeeling of the CG-rich half. A similar unpeeling is seen when stretching -DNA to high forces (see Fig 1(a) and Refs. Clausen-Schaumann et al. (2000); Rief et al. (1999); Cocco et al. (2004)). We illustrate the multi-stage elongation of chimeric sequences in Figure 5 (a): the lowest plateau represents unpeeling of the AT-rich half; the middle plateau signals elongation of the CG-rich half by way of the B-to-S transition; and the highest plateau indicates the subsequent unpeeling of the CG-rich half. At pulling rates considered, transitions signaling unpeeling are pulling rate-dependent, while B-to-S conversion is not. In Figure 1(b) we show for comparison calculations performed with S-DNA not included in the model. In this case the two plateaux signal unpeeling of AT- and CG-rich halves; there is no further transition at higher force.
V Appendix B: Choice of model timescale
The pulling rate-dependence of unpeeling within our model is governed by the imposed pulling timescale, controlled by the pulling speed , and the fundamental timescale on which basepairs change state. In Ref. Whitelam et al. (2008) we argue, by comparison with experimental data Rief et al. (1999); Clausen-Schaumann et al. (2000), that a fluorescence-derived time in the microsecond range ( s Metzler and Ambjörnsson (2005)) is a more appropriate choice for this fundamental timescale than the 10-100 ns fluctuations identified by NMR experiments. Here we illustrate the effect of changing by determining analytically, as a function of model parameters, the approximate force at which complete unpeeling occurs when stretching once-nicked DNA. We will compare this estimate with the -DNA overstretching data of Refs. Clausen-Schaumann et al. (2000); Rief et al. (1999). These data display a pulling rate-independent ‘65 pN’ plateau followed at higher force by a rate-dependent transition interpreted as an unpeeling.
We consider within our model the drift of the unpeeled ‘front’ separating hybridized and unhybridized regions, for a sequence of basepairs bearing a nick at one end. For simplicity we will assume sequence homogeneity, and model the force-extension profile of DNA using the piecewise linear fit of Cocco et al. Cocco et al. (2004). This fit assumes a linear overstretching plateau between 62 and 68 pN of gradient , and a gradient for forces above 68 pN of magnitude . We shall assume a constant rate of molecular extension, . The master equation derived from our model for the position with time of the unpeeled front, (), may be manipulated to yield the front’s drift velocity, . Here the are Glauber rates. The term is the (sequence-averaged) free energy difference between hybrizided and unhybridized DNA at zero force, and models the free energy of extension of the unhybridized phase relative to the hybrdized phase. We shall assume that unpeeling occurs only over S-form DNA, i.e. that the B-to-S conversion just pre-empts unpeeling. For forces large enough that unpeeling is favorable we have
| (1) |
where nm is the difference in length per basepair between S- and U-DNA, which we assume to be independent of force (a reasonable approximation near and just above the overstretching force). The variable is the force in excess of the S-U equilibrium force , which within our model is approximately pN at 150 mM NaCl and C. We assume that . We change variables in Equation (1) from to , and integrate along the piecewise-linear force-extension profile to obtain an expression for in terms of :
| (2) |
This expression may be manipulated to yield
| (5) |
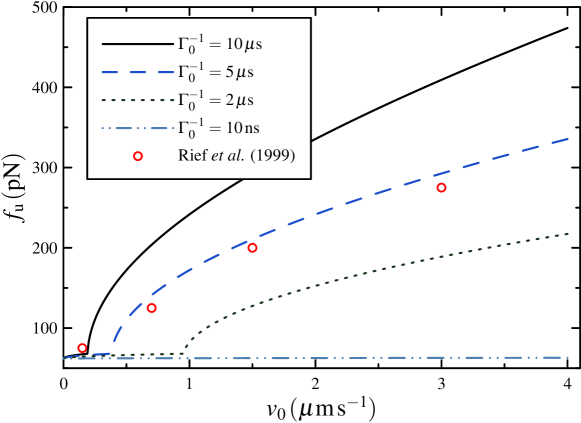
We have defined ; pN pN; , for ; and . Recall that . Setting in Equation (5) gives the excess force at which complete unpeeling occurs. For low pulling rates this excess force scales as , while for very large pulling rates we have . We plot the unpeeling force against pulling rate in Figure 7 for different choices of the fundamental timescale . We include in this plot data extracted from Figure 2 of Ref. Rief et al. (1999). We expect that our estimate of should be accurate to within an order of magnitude; we obtain favorable comparison with experiment for in the microsecond range. The equation of the line in Figure 7 calculated with s is
| (8) |
References
- Bustamante et al. (2003) C. Bustamante, Z. Bryant, and S. Smith, Nature 421, 423 (2003).
- Ritort (2006) F. Ritort, J. Phys.: Condens. Matter 18, R531 (2006).
- Stasiak et al. (1981) A. Stasiak, E. Di Capua, and T. Koller, J Mol Biol 151, 557 (1981).
- Leger et al. (1998) J. Leger, J. Robert, L. Bourdieu, D. Chatenay, and J. Marko, Proceedings of the National Academy of Sciences of the United States of America 95, 12295 (1998).
- Fulconis et al. (2006) R. Fulconis, J. Mine, A. Bancaud, M. Dutreix, and J. Viovy, The EMBO Journal 25, 4293 (2006).
- Alberts et al. (2002) B. Alberts, D. Bray, J. Lewis, M. Raff, K. Roberts, and J. Watson, New York: Garland Science (2002).
- Smith et al. (1996) S. Smith, Y. Cui, and C. Bustamante, Science 271, 795 (1996).
- Cocco et al. (2004) S. Cocco, J. Yan, J. Léger, D. Chatenay, and J. Marko, Physical Review E 70, 11910 (2004).
- Cluzel et al. (1996) P. Cluzel, A. Lebrun, C. Heller, R. Lavery, J. Viovy, D. Chatenay, and F. Caron, Science 271, 792 (1996).
- Storm and Nelson (2003) C. Storm and P. Nelson, Physical Review E 67, 51906 (2003).
- Léger et al. (1999) J. Léger, G. Romano, A. Sarkar, J. Robert, L. Bourdieu, D. Chatenay, and J. Marko, Physical Review Letters 83, 1066 (1999).
- Haijun et al. (1999) Z. Haijun, Z. Yang, and O. Zhong-can, Physical Review Letters 82, 4560 (1999).
- Williams et al. (2001a) M. Williams, J. Wenner, I. Rouzina, and V. Bloomfield, Biophysical Journal 80, 874 (2001a).
- Rouzina and Bloomfield (2001) I. Rouzina and V. Bloomfield, Biophysical Journal 80, 882 (2001).
- Williams et al. (2001b) M. Williams, J. Wenner, I. Rouzina, and V. Bloomfield, Biophysical Journal 80, 1932 (2001b).
- Williams et al. (2002) M. Williams, I. Rouzina, and V. Bloomfield, Acc. Chem. Res 35, 159 (2002).
- Williams and Rouzina (2002) M. Williams and I. Rouzina, Current Opinion in Structural Biology 12, 330 (2002).
- Vladescu et al. (2005) I. Vladescu, M. McCauley, I. Rouzina, and M. Williams, Physical Review Letters 95, 158102 (2005).
- Biancaniello et al. (2005) P. Biancaniello, A. Kim, and J. Crocker, Physical Review Letters 94, 58302 (2005).
- Maragakis et al. (2002) P. Maragakis, R. Barnett, E. Kaxiras, M. Elstner, and T. Frauenheim, Physical Review B 66, 241104 (2002).
- Nykypanchuk et al. (2008) D. Nykypanchuk, M. Maye, D. van der Lelie, and O. Gang, Nature 451, 549 (2008).
- Park et al. (2008) S. Park, A. Lytton-Jean, B. Lee, S. Weigand, G. Schatz, and C. Mirkin, Nature 451, 553 (2008).
- Limouse et al. (2007) C. Limouse, C. Danilowicz, V. Coljee, N. Kleckner, and M. Prentiss, Arxiv preprint arXiv:0704.3753 (2007).
- Rief et al. (1999) M. Rief, H. Clausen-Schaumann, and H. Gaub, Nature Structural Biology 6, 346 (1999).
- Clausen-Schaumann et al. (2000) H. Clausen-Schaumann, M. Rief, C. Tolksdorf, and H. Gaub, Biophysical Journal 78, 1997 (2000).
- Harris et al. (2005) S. Harris, Z. Sands, and C. Laughton, Biophysical Journal 88, 1684 (2005).
- Konrad and Bolonick (1996) M. Konrad and J. Bolonick, J. Am. Chem. Soc 118, 989 (1996).
- Lohikoski et al. (2005) R. Lohikoski, J. Timonen, and A. Laaksonen, Chemical Physics Letters 407, 23 (2005).
- Hormeno and Arias-Gonzalez (2006) S. Hormeno and J. Arias-Gonzalez, Biol Cell 98, 679 (2006).
- Williams (2002) M. Williams, Biophysics Textbook Online: http://www. biophysics. org/btol (2002).
- Mao et al. (2005) H. Mao, J. Arias-Gonzalez, S. Smith, I. Tinoco, and C. Bustamante, Biophysical Journal 89, 1308 (2005).
- Whitelam et al. (2008) S. Whitelam, S. Pronk, and P. Geissler, Biophysical Journal 94, 2452 (2008).
- Zimm and Bragg (1959) B. Zimm and J. Bragg, J. Chem. Phys 31, 526 (1959).
- Poland and Scheraga (1966) D. Poland and H. Scheraga, The Journal of Chemical Physics 45, 1464 (1966).
- SantaLucia Jr (1998) J. SantaLucia Jr, Proceedings of the National Academy of Sciences 95, 1460 (1998).
- Altan-Bonnet et al. (2003) G. Altan-Bonnet, A. Libchaber, and O. Krichevsky, Physical Review Letters 90, 138101 (2003).
- Metzler and Ambjörnsson (2005) R. Metzler and T. Ambjörnsson, Journal of Biological Physics 31, 339 (2005).
- Ambjörnsson et al. (2006) T. Ambjörnsson, S. Banik, O. Krichevsky, and R. Metzler, Physical Review Letters 97, 128105 (2006).