Spatial distribution of luminous X-ray binaries in spiral galaxies
Abstract
We have modeled the spatial distribution of luminous X-ray binaries (XRBs) in Milky Way like spiral galaxies with an evolutionary population synthesis code developed by Hurley et al. (2000, 2002). In agreement with previous theoretical expectations and observations, we find that both high- and low-mass X-ray binaries show clear concentrations towards the galactic plane and bulge. We also compare XRB distributions under the galactic potential with dark matter halo and the Modified Newtonian Dynamics (MOND) potential, and suggest that the difference may serve as potential evidence to discriminate these two types of models.
keywords:
binaries: close - galaxies: individual: the Galaxy - galaxies: star-burst - stars: evolution - X-ray: binaries - stars: distribution1 Introduction
X-ray binaries (XRBs) contain a neutron star (NS) or a black hole (BH) accreting from a normal companion star. They are conventionally divided into low-mass X-ray binaries (LMXBs) and high-mass X-ray binaries (HMXBs) according to the masses of the optical companions (e.g. Verbunt & van den Heuvel, 1994). In HMXBs, the evolved (super)giant companions, generally , have strong stellar wind mass-loss to power a bright X-ray source for yr; while LMXBs, in which , experience mass transfer via Roche-lobe overflow (RLOF) at a rate of yr-1. Between them are intermediate-mass X-ray binaries (IMXBs), in which companion stars’ masses are in the range (van den Heuvel, 1975). Mass transfer in these binaries often occurs on a (sub)thermal timescale of yr through RLOF.
Using distance estimates and angular distribution of LMXBs, van Paradijs & White (1995) and White & Van Paradijs (1996) investigated the spatial distribution of NS and BH LMXBs in our Galaxy, and suggested that the compact objects had received a kick during the supernova (SN) explosions. More recent work by Grimm et al. (2002) using the RXTE data showed that HMXBs were concentrated towards the Galactic plane with a vertical scale height of pc while the vertical distributions of LMXBs was significantly broader with a scale height of pc, and the radial distribution of LMXBs peaked strongly at the Galactic bulge. But this sample suffers from some incompleteness of the optical identifications/distance measurements at the large distances from the Sun (Jonker & Nelemans, 2004). Fortunately, today’s sensitive, high-resolution X-ray observations allow the study of luminous XRBs in galaxies even beyond the Local Group, and make it possible to examine XRB populations in a wide range of galactic environments with different star formation histories. For example, XMM-Newton and Chandra observations of NGC 891, a nearby edge-on spiral galaxy which is very similar in many respects to our own Galaxy, present a straightforward look from outside (Temple et al., 2005). The spatial distribution of luminous discrete point sources in this galaxy also shows clear concentrations towards the galactic plane and bulge. From the locations of 154 discrete non-nuclear ultraluminous X-ray sources (ULXs) identified in 82 galaxies observed with Chandra, Swartz et al. (2004) found that the ULXs in their host galaxies were strongly peaked toward their galaxy centers. Statistical analysis of the X-ray point sources from the ROSAT HRI survey of nearby galaxies by Liu et al. (2006) showed that there is a significant concentration of ULXs towards galactic center in late-type galaxies. They also suggested that regular ULXs are likely to be a high-luminosity extension of the ordinary HMXB/LMXB population in late-type galaxies through luminosity function (LF) study.
The spatial distribution of XRBs in a galaxy is determined by the initial kick velocity due to any asymmetry in SN explosion at the birth of a NS/BH, the galactic gravitational potential, and the mass transfer process in a binary. In the present work, we investigated the dynamical consequences of XRBs in spiral galaxies like the Milky Way in an theoretical view. We employed an evolutionary population synthesis (EPS) code to calculate the expected number and luminosity distributions of XRBs in the galaxies. Then, following the approach of Paczynski (1990), we calculated the spatial distribution of XRBs with luminosities ergs-1. For the galactic gravitational potential, we adopted both the standard cold dark matter (CDM) model and the Modified Newtonian Dynamics (MOND) model. The objective of this study is to present an integrated picture of XRB distribution in spiral galaxies under the two kinds of galactic potential models, and to explore the difference in the predicted spatial distributions, which could be testified by comparison with future high-resolution observations of XRB distribution in nearby galaxies. A recent related work is to use the detection of LMXBs in the Sculptor dwarf spheroidal galaxy to probe the dark matter halo (Dehnen & King, 2006).
This paper is organized as follows. In §2 we describe the population synthesis method and the input physics for XRBs in our model. The calculated results are presented in §3. Our discussion and conclusions are in §4.
2 Model
2.1 Assumptions and input parameters
We have used the EPS code developed by Hurley et al. (2000, 2002) to calculate the expected numbers for various types of XRB populations. This code incorporates evolution of single stars with binary-star interactions, such as mass transfer, mass accretion, common envelope (CE) evolution, SN kicks, tidal friction and angular momentum loss mechanics (i.e., mass loss, magnetic braking and gravitational radiation). Besides the modifications made by Liu & Li (2007) to the original code, we have reduced the helium star wind strength by a factor of 0.6 according to Kiel & Hurley (2006) in modeling the formation processes of BH LMXBs.
We assume that the host spiral galaxies are similar to our Galaxy, and adopt the cylindrical coordinate system (, , and ) centered at the galactic center. For stars born in the bulge, we simply assume that they were distributed uniformly between and kpc, while the star formation rate (SFR) in the disk varies exponentially with , i.e., with kpc, from out to kpc.
Considering the different star formation processes in the galactic disk and bulge (described in §3.1), we have calculated the populations of X-ray sources in the bulge and disk separately. According to Ballero et al. (2007) we assume that stars in the bulge formed at the age of 0.4 Gyr with metallicity of 0.001 and an inital mass function (IMF) more skewed toward high mass than in the solar neighbourhood. We neglect magnetic braking effect for main-sequence (MS) stars of mass , since metal-poor MS stars in this mass range do not have an outer convective zone (e.g. Ivanova, 2006). For the disk we take a fixed SFR over the lifetime of the galaxy and solar metallicity. The values of other adopted parameters are the same as the default ones in Hurley et al. (2002) if not mentioned. The IMF of Kroupa et al. (1993) is taken for the primary’s mass () distribution. For the secondary stars (), we assume a uniform distribution of the mass ratio between 0 and 1 and of the logarithm of the orbital separation . Tidal effect is considered to remove any eccentricity induced in a post-SN binary prior to the onset of mass-transfer.
When a binary survives a SN explosion, it receives a velocity kick due to any asymmetry in the explosion (Lyne & Lorimer, 1994). The kick velocity is assumed to be imparted on the newborn NS with the Maxwellian distribution
| (1) |
where (Hobbs et al., 2005) or 190 kms-1(Hansen et al., 1997). The direction of the initial velocity vector is chosen randomly. Together with the local circular motion in our Galaxy (Burton & Gordon, 1978), this gives the initial velocity vectors , , . After evolving for a period, the binary will turn on X-rays and can be observed if it is luminous enough.
In the mean time the motion of the binary can be calculated if the galactic potential is known. In our control model we adopt the Galactic gravitational potential proposed by Johnston et al. (1995), which consists of one Hernquist bulge (Hernquist, 1990), one Miyamota-Nagai disk (Miyamoto & Nagai, 1975) and one isothermal DM halo potential111We have adopted other galactic potential suggested in Paczynski (1990) and Binney & Tremaine (1987), and found very small difference in the final results.. For the MOND potential we use the Shan et al. (2008) model which applies MOND correction to a Kuzmin-Hernquist bulge-disk model to study orbits in axisymmetric potential. The potential can be constructed as,
| (2) |
where is the gravitational constant, the Kuzmin length, the Hernquist length and the total mass of the lens system. Here we adopt , kpc (Binney & Tremaine, 1987), and kpc (Hernquist, 1990) in our calculations. Note that when , Eq. (2) recovers to the thin Kuzmin disk model with Newtonian potential given by Binney & Tremaine (1987), and when , it becomes the Hernquist model (Hernquist, 1990). The modified gravity is then
| (3) |
where is calculated from Eq. (2) and cms-2 (Milgrom, 1983; McGaugh, 2004). For comparison we also performed calculations with the Kuzmin model presented by Read & Moore (2005).
Due to cylindrical symmetry of the galactic potential, two space coordinates and are sufficient to describe the XRB distributions. We integrate the motion equations (i.e., Eqs. (19a, b) in Paczynski, 1990) with a fourth-order Runge-Kutta method to calculate the trajectories of the binary systems and collect the space parameters of current XRBs. In our calculations, the accuracy of integral is set to be and controlled by the energy integral.
2.2 X-ray luminosity and source type
In our study XRBs are simply divided into LMXBs and H/IMXBs according to the mass of the optical companion, and we use the mass of the secondary, , of to separate them. Typically the donor star is a MS star but giant and white dwarf (WD) donors are also possible. For every accreting system, the bolometric luminosity () is calculated based on the average mass accretion rate () as where is the efficiency for energy conversion and is the velocity of light. For persistent XRBs, we adopt , where is the “Begelman factor” (Rappaport, Podsiadlowski & Pfahl, 2004) to allow super-Eddington luminosities, and the critical Eddington luminosity ergs-1 (where is the Thomson cross section, the proton mass, and the accretor mass in the units of solar mass). We assume and 10 for accreting NSs and BHs, respectively. For transient sources, the luminosities in outbursts are taken to be a fraction () of the Eddington luminosity. For NS systems, we assume and 1 if the orbital period is less and longer than 1 day, respectively; for BH systems, we adopt hr and let the maximum peak luminosity not exceed (Belczynski & Taam, 2003; Chen et al., 1997; Garcia et al., 2003). The X-ray duty cycle (DC) is taken to be 0.01 empirically (e.g. Taam, King & Ritter, 2000).
Finally a bolometric correction factor is introduced to convert the bolometric luminosity to the X-ray luminosity in the keV energy range (Belczynski & Taam, 2003). Generally the correction factor is for different types of XRBs, and here we adopt as our standard value. So we can obtain the simulated X-ray luminosity form as follows:
| (6) |
To discriminate transient (t) and persistent (p) sources, we adopt the criteria of van Paradijs (1996) for main sequence and red giant donors, and of Ivanova & Kalogera (2006) for WD donors, respectively.
3 Results
3.1 X-ray luminosity functions (XLFs)
We first consider the XRBs in our Galaxy. For disk sources, from the SFR yr-1 for stars massive than in Grimm et al. (2003), we derive the total SFR in the Galaxy following Liu & Li (2007), and get the specific SFR of the binary star population yr-1 for a binary fraction . For bulge sources, we construct a phenomenological function of SFR(t) accordiing to Fig. 2 in Ballero et al. (2007), and assume the binary fraction (Ivanova et al., 2005). In Fig. 1, we show the simulated cumulative XLFs of H/IMXBs (left) and LMXBs (middle) in the Galaxy with (Dewi & Tauris, 2000). Note that the XLF of H/IMXBs is significantly flatter than that of LMXBs, as indicated in the observed XLFs derived by Grimm et al. (2002). The breaks between ergs-1 in both XLFs are related to the maximum Eddington luminosities of various types of accreting sources (persistent NS H/IMXBs and transient LMXBs) calculated with Eq. (4).
Grimm et al. (2002) also combined the XLF of star forming galaxies in their sample - M82, Antennae, NGC 4579, NGC 4736 and Circinus, with a completeness limit lower than ergs-1. These galaxies have a total SFR of yr-1, which exceeds the Galaxy SFR (yr-1) by a factor of . They found that the XLFs of Galactic and SMC HMXBs agree well with an extrapolation of the combined LF of the star-burst galaxies. We factitiously reset a SFR of yr-1 in our population calculations in order to examine the effect of SFR. The SFH is assumed to be the same as in the Galaxy ( Gyr). We show the cumulative XLFs in late-type spiral galaxies of the right panel of Fig. 1. Note that H/IMXBs (dashed line) and LMXBs (dotted line) dominate at the relatively high (ergs-1) and low (ergs-1) luminosity in the XLF, respectively.
3.2 Spatial distribution of XRBs in the CDM potential
With the XLF constructed, we now calculate the spatial distribution of H/IMXBs and LMXBs at the age of 12 Gyr. We need to point out that we only consider the dynamical consequence of field binaries. XRBs formed in globular clusters have a different dynamical origin and are not included in this study. The results are described as follows.
In Fig. 2, we show the radial distribution of luminous H/IMXBs (left) and LMXBs (middle) in a Milky Way like galaxy. As the figure shows, both H/IMXBs and LMXBs have a strong concentration in the direction to the galactic center along the galactic plane while there is a void of H/IMXBs in the galactic bulge. It is in rough agreement with the observed distribution in our Galaxy, considering that we have ignored the signatures of the Galactic spiral structure. Note that H/IMXBs are dominated by disk sources because sources in the bulge have all died early, while for LMXBs, both bulge (dashed line) and disk (dotted line) sources contribute to the population.
In Fig. 2 we also show the radial distributions of luminous XRBs in late-type spiral galaxies with an enhanced SFR of yr-1. We only include sources with luminosities ergs-1. As the figure shows, the radial distributions also strongly cluster towards the galactic center region and declines along the galactic plane, while there is a marked scarcity in the galactic bulge. These features can be compared with Liu et al. (2006), who find that for the late-type galaxies, the radial distribution of detected ULXs shows a peak around (with as the elliptical radius of the isophote.), and the surface number density of ULXs decreases with radii until it flattens outside the isophotes.
In Fig. 3 is plotted the vertical distributions of H/IMXBs (dotted line) and LMXBs (solid line) in the luminosity interval ergs-1 (left panel) and ergs-1 (right panel), respectively. Obviously H/IMXBs are more concentrated towards the galactic plane than LMXBs. This is in general accordance with Grimm et al. (2002), who suggested that the tail of high- LMXBs in the Galaxy cannot be solely due to the globular cluster component because only three out of nine sources at kpc are located in globular clusters.
In the left panel of Fig. 4 we show the vertical distributions of NS and BH LMXBs. They seem to be very similar, which is in general agreement with those obtained by Jonker & Nelemans (2004). In order to make a more accurate comparison, we define to represent the ratio of the number with kpc to the total number between and kpc for a certain type (X) of XRB. In the right panel of Fig. 4, we show the ratio of H/IMXBs against . The solid and dotted lines correspond to sources in the luminosity interval ergs-1 and ergs-1, respectively. As shown in the figure, the more luminous the XRBs are, the more concentrated they are towards the Galactic plane, as expected. This can be easily understood as follows. For a companion of mass , the X-ray lifetime . The higher , the shorter , and the smaller displacement from the original position.
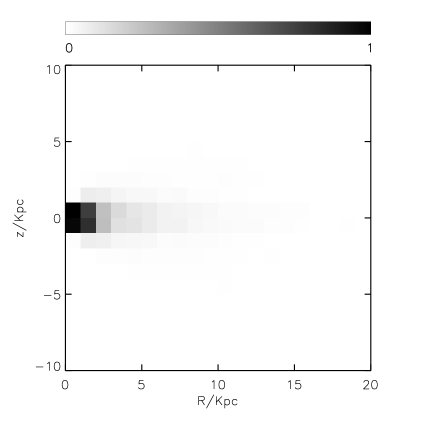
In Fig. 5, we show the schematic side view of XRB distribution in the galaxy. The color-bar represents the normalized number ratio of XRBs in the plane. Unfortunately, due to the uncertainties in determining the distance to XRBs in the Galaxy (e.g. Jonker & Nelemans, 2004), it is difficult to numerically compare the theoretical expectations with observations of bright XRBs in our Galaxy. Observationally, Temple et al. (2005) presents a outside view in X-rays of the nearby edge-on spiral galaxy NGC 891. The spatial distribution of luminous discrete point sources in this galaxy also shows clear concentrations towards the galactic plane and galactic bulge.
We have performed calculations with varied key input parameters to investigate their effect on the spatial distributions. The number of HMXBs does not depend on the SFH in late-type galaxies since it is much longer than the total duration for the formation and evolution of HMXBs ( yr). According to Liu & Li (2007), for young populations, binary formation rate and the factor of super-Eddington accretion rate allowed can affect the XLFs most prominently. Obviously H/IMXBs always follow the initial spatial distributions of their progenitor stars (i.e. close to the disk) due to their relatively short lifetimes. Another important parameter in the evolution of close binaries is the CE efficiency . Our calculations reveal that change of the value of does not significantly affect the number of H/IMXBs but has a strong influence on LMXB population. For small values of the orbital motion of a low-mass companion during the spiral-in process may be unable to driven off the envelope of the massive BH/NS progenitor, resulting in coalescence rather a compact binary. Variations in the CE efficiency can change the relative numbers of various types of X-ray binaries, but the main feature of XRB distribution is determined by the dynamical processes during the formation of a BH/NS and the galactic potential adopted. Figure 6 shows the radial (left) and vertical (right) distributions of LMXBs in the Milky Way with different kick velocity dispersions. It is obvious that there is no strong dependence of the overall spatial distribution on the kick velocity dispersion, though it can affect the outcome of binary evolution and the relative numbers of various types of XRBs.
3.3 Spatial distribution of XRBs in MOND potential
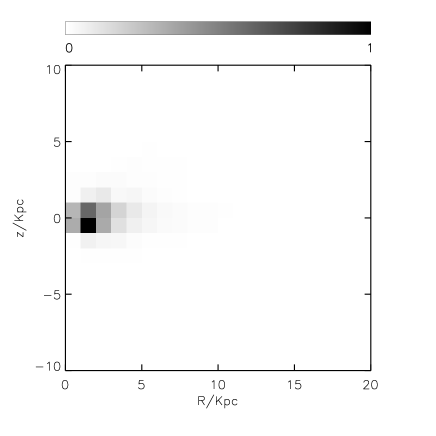
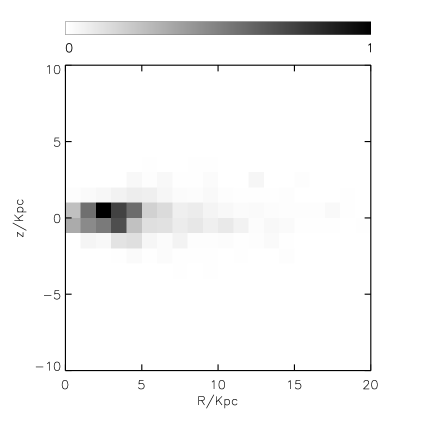
We made similar calculations of XRB trajectories within the MOND potential. In Fig. 7, we compare the radial distributions of XRBs in a Milky Way like galaxy in both MOND and CDM potentials. The solid, dotted, and thick short dashed lines represent those in Shan-Zhao model, Kuzmin model and the CDM model, respectively. Note that LMXBs in MOND potentials also show clear concentration towards the Galactic bulge as in CDM model, but they are peaked at kpc from the galactic center. This feature can be seen clearly in the schematic side view (Fig. 8) of the distributions of XRBs in the galaxy. In Shan-Zhao model (left panel) the distribution shows a peak kpc from the galactic center, while in Kuzmin model (right panel) it peaks at kpc from the galactic center. The remarkable scarcity of XRBs within the galactic bulge may provide interesting clues to falsity one of these models through comparing XRB distributions with predictions from the CDM and the MOND potentials.
We note the difference between these models is mainly due to the potential discrepancy, especially the contribution from the bulge component. The CDM model contains three components, one Hernquist bulge, one Miyamota-Nagai disk and one isothermal DM halo potential. It is the bulge potential that leads to the peaked distribution of XRBs in the galactic center. The Kuzmin model has only one disk component, which results in few XRBs within the galactic bulge. In Shan-Zhao model, the auxilary point potential in Kuzmin model is replaced with an auxilary Hernquist potential, that’s to say, this model contains not only Kuzmin disk potential but also Hernquist bulge component. This bulge potential causes the distribution peak to move inwards the bulge. We also find that in CDM model there is a more extended radial distribution for XRBs than in the MOND model. This is mainly caused by the potential of the DM halo, which is thought to be reside beyond kpc from the galactic center to account for the missing mass.
4 Concluding remarks
This study shows that, with current understanding of binary evolutions and galactic structure, it is possible to investigate both the luminosity function and spatial distribution of luminous XRBs in nearby galaxies, although the results are subject to many uncertainties and simplified treatments. For example, in our calculations, only primordial binaries were considered while in dense environments like the galactic bulge, dynamical formation channels such as tidal capture, exchange encounters, and direct collisions, may play an important role in binary formation and change the distribution of the XRBs (Voss & Gilfanov, 2007). Additionally, we adopted a simplified radial distribution of newborn binaries in the disk and in the bulge. The actual initial distribution is related to the structure of the spiral arms, the distribution and evolution of the giant HII regions and warm CO clouds, which are still poorly known. Finally, recent dynamical encounter of galaxies may also lead to the prevalence of ULXs population and make a great influence in their spatial distributions (e.g., Fabbiano, Zezas & Murray, 2001; Wolter & Trinchieri, 2003; Belczynski et al., 2004; Colbert & Miller, 2005; Fabbiano & White, 2006). Although detail comparison between observations and theoretical predications is not available at present, rough agreement can be obtained. In particular, our calculations show that XRBs in CDM and MOND potentials may have distinct radial distribution around the galactic bulge, suggesting a new way to constrain the nature of DM and test the law of gravity. Our work motivates further efforts to explore the origin of the spatial distributions of luminous XRBs around the galactic center regions.
Acknowledgments
We would like to thank Hong-sheng Zhao and Huan-yuan Shan for valuable discussions on the MOND potential. We also thank Hai-lang Dai, Wen-cong Chen, Jian-xia Cheng for useful comments and discussions. We are also very grateful to an anonymous referee whose comments and suggestions largely improved the clarity of this paper. This work was supported by the Natural Science Foundation of China under grant numbers 10573010 and 10221001.
References
- Ballero et al. (2007) Ballero S.,Matteucci F, Origlia L., Rich R., 2007, A&A, 467, 123
- Belczynski et al. (2004) Belczynski K., Kalogera V., Zezas A., Fabbiano G., 2004, ApJ, 601, L147
- Belczynski & Taam (2003) Belczynski K., Taam R. E., 2003, ApJ, 616, 1159
- Binney & Tremaine (1987) Binney J., Tremaine S.,1987, Galactic Dynamics, Princeton Univ. Press, Princeton, NJ, p.747
- Burton & Gordon (1978) Burton W. B., Gordon M. A., 1978, A&A, 63, 7
- Chen et al. (1997) Chen W., Shrader C. R., Livio M., 1997, ApJ, 491, 312
- Colbert & Miller (2005) Colbert E. J. M., Miller M. C., 2005, in Proc. 10th Marcel Grossmann Meeting on General Relavity, Novello M., Perez-Bergliaffa S., Ruffini R., eds. (World Scientific, Singapore), p. 530
- Dehnen & King (2006) Dehnen W., King A., 2006, MNRAS, 367, L29
- Dewi & Tauris (2000) Dewi J.D.M., Tauris T.M., 2000, A&A, 360, 1043
- Fabbiano & White (2006) Fabbiano G., White N. E., 2006, in Lewin W. H. G., van der Klis M., des, Compact Steller X-Ray Sources (Cambridge Univ. Press, Cambridge), 475
- Fabbiano, Zezas & Murray (2001) Fabbiano G., Zezas A., Murray S. S., 2001, ApJ, 554, 1035
- Garcia et al. (2003) Garcia M. R., Miller J. M., McClintock J. E., King A. R., Orosz J., 2003, ApJ, 591, 388
- Grimm et al. (2002) Grimm H., Gilfanov M., Sunyaev R., 2002, A&A, 391, 923
- Grimm et al. (2003) Grimm H., Gilfanov M., Sunyaev R., 2003, MNRAS, 339, 793
- Hansen et al. (1997) Hansen B., Phinney E., 1997, MNRAS, 291, 569
- Hernquist (1990) Hernquist L., 1990, ApJ, 356, 359
- Hernquist & Weil (1993) Hernquist L., Weil M., 1993, MNRAS, 261, 804
- Hobbs et al. (2005) Hobbs G., Lorimer D. R., Lyne A. G., Kramer M., 2005, MNRAS, 360, 963
- Hurley et al. (2000) Hurley J. R., Pols O. R., Tout C. A., 2000, MNRAS, 315, 543
- Hurley et al. (2002) Hurley J. R., Tout C. A., Pols O. R., 2002, MNRAS, 329, 897
- Ivanova et al. (2005) Ivanova N., Belczynski B, Fregeau J, Rasio F, 2005, MNRAS, 358, 572
- Ivanova (2006) Ivanova N., 2006, ApJ, 636, 979
- Ivanova & Kalogera (2006) Ivanova N., Kalogera V., 2006, ApJ, 636, 985
- Johnston et al. (1995) Johnston K. V., Spergel D. N., Hernquist L., 1995, MNRAS, 451, 598
- Jonker & Nelemans (2004) Jonker P.G., Nelemans G., 2004, MNRAS, 354, 355
- Kiel & Hurley (2006) Kiel P.D., Hurley J.R., 2006, MNRAS, 369, 1152
- Kroupa et al. (1993) Kroupa, P., Tout, C. A., Gilmore, G., 1993, MNRAS, 262, 545
- Liu et al. (2006) Liu J. F., Bregman J. N., Irwin J., 2006, ApJ, 642, 171
- Liu & Bregman (2005) Liu J. F., Bregman J. N., 2005, ApJS, 157, 59
- Liu & Li (2007) Liu X. W., Li X. D., 2007, ChJA&A, 7, 389
- Lyne & Lorimer (1994) Lyne A. G., Lorimer D. R., 1994, Nature, 369, 124
- McGaugh (2004) McGaugh S. S., 2004, ApJ, 611, 26
- Milgrom (1983) Milgrom M., 1983, MNRAS, 270, 365
- Miyamoto & Nagai (1975) Miyamoto M., Nagai R., 1975, PASJ, 27, 533
- Muno et al. (2005) Muno M. P., Pfahl E., Baganoff F. K., Brandt W. N., Ghez A., Lu J., Morris M. R., 2005, ApJ, 622, L113
- Paczynski (1990) Paczynski B., 1990, ApJ, 348, 485
- Rappaport, Podsiadlowski & Pfahl (2004) Rappaport S. A., Podsiadlowski P., Pfahl E., 2004, MNRAS, 361, 971
- Read & Moore (2005) Read J. I., Moore B., 2005, MNRAS, 356, 401
- Shan et al. (2008) Shan H. Y., Feix M., Famaey B., Zhao H. S., 2008, accepted by MNRAS
- Sidoli et al. (2006) Sidoli L., Mereghetti, S., Favata, F., Oosterbroek, T., Parmar, A. N., 2006, A&A, 456, 287
- Skordis (2006) Skordis C., 2006, Phys. Rev. D, 74,103513
- Swartz et al. (2004) Swartz D. A., Ghosh K. K., Tennant A. F., Wu K., 2004, ApJS, 154, 519
- Taam, King & Ritter (2000) Taam R. E., King A. R., Ritter H., 2000, ApJ, 541, 329
- Temple et al. (2005) Temple R., Raychaudhury S., Stevens I., 2005, MNRAS, 362, 581
- van den Heuvel (1975) van den Heuvel E.P.J., 1975, ApJ, 198, L109
- van Paradijs & White (1995) van Paradijs, J., White, N. 1995, ApJ, 447, L33
- van Paradijs (1996) van Paradijs J., 1996, ApJ, 464, L139
- Verbunt & van den Heuvel (1994) Verbunt F., van den Heuvel E., 1994, X-ray Binaries. Cambridge University Press, p. 457
- Voss & Gilfanov (2007) Voss R., Gilfanov M., 2007, MNRAS, submitted (astro-ph/0702580)
- White & Van Paradijs (1996) White N.E., van Paradijs J., 1996, ApJ, 473, L25
- Wolter & Trinchieri (2003) Wolter A., Trinchieri G., 2003, Mem. Soc. Astron. It., 73, 23