Exploring the substellar temperature regime down to 550K
Abstract
We report the discovery of three very late T dwarfs in the UKIRT Infrared Deep Sky Survey (UKIDSS) Third Data Release: ULAS J101721.40+011817.9 (ULAS1017), ULAS J123828.51+095351.3 (ULAS1238) and ULAS J133553.45+113005.2 (ULAS1335). We detail optical and near-infrared photometry for all three sources, and mid-infrared photometry for ULAS1335. We use near-infrared spectra of each source to assign spectral types T8p (ULAS1017), T8.5 (ULAS1238) and T9 (ULAS1335) to these objects. ULAS1017 is classed as a peculiar T8 (T8p) due to appearing as a T8 dwarf in the -band, whilst exhibiting and -band flux ratios consistent with a T6 classification. Through comparison to BT-Settl model spectra we estimate that ULAS1017 has , and , assuming solar metallicity. This estimate for gravity is degenerate with varying metallicity. We estimate that ULAS1017 has an age of 1.6–15 Gyr, a mass of 33–70 MJ and lies at a distance of 31–54 pc. We do not estimate atmospheric parameters for ULAS1238 due to a lack of -band photometry. We extend the unified scheme of Burgasser et al. (2006) to the type T9 and suggest the inclusion of the index to replace the now saturated -band indices. We propose ULAS1335 as the T9 spectral type standard. ULAS1335 is the same spectral type as ULAS J003402.77-005206.7 and CFBDS J005910.90-011401.3. We argue that given the similarity of the currently known T8 dwarfs to the rest of the T dwarf sequence, the suggestion of the Y0 spectral class for these objects is premature. Comparison of model spectra with that of ULAS1335 suggest a temperature below 600K, possibly combined with low-gravity and/or high-metallicity. We find ULAS1335 to be extremely red in near to mid-infrared colours, with . This is the reddest near to mid-infrared colour yet observed for a T dwarf. The near to mid-infrared spectral energy distribution of ULAS1335 further supports , and we estimate for ULAS1335. We estimate that ULAS1335 has an age of 0.6–5.3 Gyr, a mass of 15–31 MJ and lies at a distance of 8–12 pc.
keywords:
surveys - stars: low-mass, brown dwarfs1 Introduction
Extending the known sample of field dwarfs to ever lower effective temperatures () is important not only for the determination of the field mass function, but also for probing temperature and pressure regimes that have hitherto been unexplored observationally. The study of extremely cool brown dwarfs opens a window on atmospheric physics which will be fundamental for understanding the processes within a broad range of substellar atmospheres, including those of giant exoplanets.
At the time of writing there are 142 T dwarfs published in the literature (e.g., DwarfArchives.org; Pinfield et al. 2008). Of these, only five are classified as T8 or later (using the scheme of Burgasser et al. 2006), two of which have spectral types later than T8: ULAS J003402.77-005206.7 (hereafter ULAS0034; Warren et al. 2007) and CFBDS J005910.90-011401.3 (hereafter CFBDS0059; Delorme et al. 2008). ULAS0034 has an inferred of 600-700 K (Warren et al. 2007), and Delorme et al. (2008) infer a for CFBDS0059 that is K cooler than that of ULAS0034.
Expanding the sample of very cool brown dwarfs, and exploring possible factors that could motivate the implementation of new spectral classes (e.g Y dwarfs; Kirkpatrick et al. 1999) are primary science drivers for the UKIRT Infrared Deep Sky Survey (UKIDSS) Large Area Survey (LAS; see Lawrence et al. 2007). Our collaboration, the UKIDSS Cool Dwarf Science Working Group (CDSWG) is engaged in a substantial effort to achieve this aim (e.g., Pinfield et al. 2008; Kendall et al. 2007; Lodieu et al. 2007; Warren et al. 2007). Here we present the recent discovery by CDSWG of three very cool brown dwarfs. These are ULAS J101721.40+011817.9 (ULAS1017), ULAS J123828.51+095351.3 (ULAS1238) and ULAS J133553.45+113005.2 (ULAS1335). The last of these, ULAS1335, may be the coolest brown dwarf yet discovered and we here discuss the properties of this object, estimating a of approximately 550–600 K.
2 Source identification
The objects presented here were selected from the third data release (DR3) of UKIDSS (Warren et al., in prep). We used the same method as that outlined in Sections 2 and 3 of Pinfield et al. (2008). The process of identifying and confirming extremely late T dwarfs can be separated into three principle stages: 1) initial selection by mining survey data; 2) confirmation of photometric properties by near-infrared and optical follow-up; 3) near-infrared spectroscopy to estimate spectral type. The Gemini/NIRI spectroscopic follow-up took place in two stages in queue mode. Initial, short (mins) -band observations were obtained first. These initial spectra confirmed that two of our targets were indeed of extremely late spectral type, and deeper , and -band observations were then queued. Subaru/IRCS spectroscopic follow-up took place separately for additional candidates in classical mode and confirmed the very late type of a third target. We will discuss each of these stages in more detail in the following sections.
2.1 Mining UKIDSS DR3
We initially searched the UKIDSS LAS data for sources that met colour criteria: ; ; , where is the uncertainty in the magnitude measured in each of the three -bands. The resultant candidate list was cross-matched against the Sloan Digital Sky Survey (SDSS) Data Release 6 (DR6) using a pairing radius of 2 arcsecs. Objects with no SDSS counterpart, or whose SDSS-UKIDSS , were retained as potential candidates. We identified some 50 candidate T dwarfs in this search. ULASJ1238 and ULASJ1335 were picked out for immediate and rapid follow-up due to survey colours that were reminiscent of the prototype T8 dwarf ULAS J0034. ULAS1017 on the other hand was selected due to its extremely blue colour from UKIDSS photometry.
2.2 Ground based photometric follow-up
Near infrared follow-up photometry was obtained using the UKIRT Fast Track Imager (UFTI; Roche et al. 2003) mounted on UKIRT, and the Long-slit Infrared Imaging Spectrograph (LIRIS; Manchado et al. 1998) mounted on the William Herschel Telescope on La Palma. The mosaics were produced using sets of jittered images, with individual exposure times, jitter patterns and number of repeats given in Table 1. The data were dark subtracted, flatfield corrected, sky subtracted and mosaiced using ORAC-DR for the UFTI data, and LIRIS-DR for the LIRIS data. We calibrated our UFTI observations using UKIRT Faint Standards (Leggett et al. 2006), with a standard observed at a similar airmass for each target. All UFTI data were obtained under photometric conditions, with seeing better than 0.9 arcsec. The wider field LIRIS data were obtained through thin cirrus in variable seeing (0.8 - 2.0 arcsec) and were calibrated against 2MASS stars within the field of view. LIRIS uses a filter, and as such no transform was required for the 2MASS stars. The magnitude for ULAS1017 was transformed to the MKO system using the transform derived by Pinfield et al. (2008).
We have also obtained optical -band photometry using the ESO Multi-Mode Instrument (EMMI) mounted on the New Technology Telescope at La Silla, Chile on the nights of 2008 January 29 and 2008 January 30. These observations are summarised in Table 1. For this optical follow-up we used a Bessel -band filter (ESO Z#611). The data were reduced using standard IRAF packages, and then multiple images of the same target were aligned and stacked to increase signal-to-noise.
We calibrated our band photometry using SDSS DR6 sources present in our images as secondary standards. We transformed the Sloan magnitudes to the EMMI system using the transformation given by Warren et al. (2007) before using them to determine zero points, which had a typical scatter of mags. The resulting EMMI photometry for our targets was then transformed to the Sloan system (see Warren et al. 2007). The results of our ground-based follow-up photometry are given in Table 2, which also gives the original database photometry.
| Object | Filter | Instrument | UT Date | Total integration time | breakdown |
|---|---|---|---|---|---|
| ULAS1017 | UFTI | 2008 Jan 17 | 300s | (j = 5, r = 1, = 60s) | |
| UFTI | 2008 Jan 17 | 2400s | (j = 5, r = 6, = 60s) | ||
| LIRIS | 2008 Mar 17 | 2400s | (j = 5, r = 24, = 20s) | ||
| EMMI | 2008 Jan 30 | 2400s | (j = 1,r = 4, = 600s) | ||
| ULAS1238 | UFTI | 2008 Jan 25 | 300s | (j = 5, r = 1, = 60s) | |
| UFTI | 2008 Jan 25 | 1800s | (j = 5, r = 6, = 60s) | ||
| EMMI | 2008 Jan 30 | 2400s | (j = 1,r = 4, = 600s) | ||
| ULAS1335 | UFTI | 2008 Jan 16 | 540s | (j = 9, r = 1, = 60s) | |
| UFTI | 2008 Jan 16 | 300s | (j = 5, r = 1, = 60s) | ||
| UFTI | 2008 Jan 16 | 900s | (j = 5, r = 3, = 60s) | ||
| UFTI | 2008 Jan 16 | 900s | (j = 5, r = 3, = 60s) | ||
| EMMI | 2008 Jan 29 | 1200s | (j = 1,r = 2, = 600s) |
| Object | |||||||||
|---|---|---|---|---|---|---|---|---|---|
| ULAS1017 | |||||||||
| ULAS1238 | - | ||||||||
| ULAS1335 | - | - | |||||||
| - | - |
2.3 Spectroscopic confirmation
Spectroscopy in the -bands was obtained for ULAS1238 and ULAS1335 using the Near InfraRed Imager and Spectrometer (NIRI; Hodapp et al. 2003) on the Gemini North Telescope on Mauna Kea under programs GN-2007B-Q-26 and GN-2008A-Q-15. The InfraRed Camera and Spectrograph (IRCS; Kobayashi et al. 2000) on the Subaru telescope on Mauna Kea was used to obtain the spectrum for ULAS1017 and this was then followed with spectroscopy in the and -bands with Gemini/NIRI. Additionally, we obtained a -band spectrum for ULAS1335 using the Infrared Spectrometer And Array Camera (ISAAC; Moorwood et al. 1998) mounted on VLT UT1 and ESO, Paranal in Director’s Discretionary time (program ID: 280.C-5067(A)).
All observations were made up of a set of sub-exposures in an ABBA jitter pattern to facilitate effective background subtraction, with a slit width of 1 arcsec. The length of the A-B jitter was 10 arcsecs. The observations are summarised in Table 3. The NIRI observations were reduced using standard IRAF Gemini packages. The Subaru IRCS spectrum was also extracted using standard IRAF packages. The AB pairs were subtracted using generic IRAF tools, and median stacked. In the case of IRCS, the data were found to be sufficiently uniform in the spatial axis for flat-fielding to be neglected. The ISAAC data were reduced and extracted using the same steps, but implemented with the ESO ISAAC pipeline version 5.7.0.
For all three sets of data, a comparison argon arc frame was used to obtain a dispersion solution, which was then applied to the pixel coordinates in the dispersion direction on the images. The resulting wavelength-calibrated subtracted pairs had a low-level of residual sky emission removed by fitting and subtracting this emission with a set of polynomial functions fit to each pixel row perpendicular to the dispersion direction, and considering pixel data on either side of the target spectrum only. The spectra were then extracted using a linear aperture, and cosmic rays and bad pixels removed using a sigma-clipping algorithm.
Telluric correction was achieved by dividing each extracted target spectrum by that of an early A or F type star observed just before or after the target and at a similar airmass. Prior to division, hydrogen lines were removed from the standard star spectrum by interpolating the stellar continuum. Relative flux calibration was then achieved by multiplying through by a blackbody spectrum of the appropriate . Data obtained for the same spectral regions on different nights were co-added after relative flux calibration, each weighted by their exposure time.
| Object | UT Date | Integration time | Instrument | Spectral region |
|---|---|---|---|---|
| ULAS1017 | 2008 Jan 25 | 12x300s | IRCS | |
| 2008 Mar 14 | 16x225s | NIRI | ||
| 2008 May 11 | 12x300s | NIRI | ||
| ULAS1238 | 2007 Dec 21 | 4x240s | NIRI | |
| 2008 Jan 23 | 12x300s | NIRI | ||
| 2008 Jan 23 | 12x300s | NIRI | ||
| 2008 Feb 18 | 8x225s | NIRI | ||
| 2008 Feb 26 | 6x225s | NIRI | ||
| ULAS1335 | 2007 Dec 21 | 4x240s | NIRI | |
| 2008 Jan 22 | 12x300s | NIRI | ||
| 2008 Jan 22 | 12x300s | NIRI | ||
| 2008 Feb 28 | 20x225s | NIRI | ||
| 2008 Mar 19 | 12x300s | ISAAC |
The spectra were then joined together using the measured near-infrared photometry to place the spectra on an absolute flux scale, and rebinned by a factor of three to increase the signal-to-noise, whilst avoiding under-sampling for the spectral resolution. The IRCS JH spectrum of ULAS1017 was joined to the NIRI and -band spectra in a similar way, but the NIRI spectra were rebinned by a factor of three prior to joining. The resultant and spectra for ULAS1017 and ULAS1335 are shown in Figure 1, where the combined spectra have been normalised to unity at and each offset for clarity. In the case of ULAS1238, we have so far been unable to obtain a -band magnitude, so only the spectrum is shown in Figure 1, the -band spectrum is shown separately in Figure 2, normalised to unity at .


2.4 Spitzer-IRAC follow-up of ULAS1335
We obtained IRAC four-channel (3.55, 4.49, 5.73 and 7.87 m) photometry of the source on 2008 March 5. The data were obtained as part of the Spitzer Space Telescope Cycle 4 program . All four channels have 256256-pixel detectors with a pixel size of 1212, yielding a 5252 field of view. Two adjacent fields were imaged in pairs (channels 1 and 3; channels 2 and 4) using dichroic beam splitters. The telescope was then nodded to image a target in all four channels.111For more information about IRAC, see Fazio et al. (2004) and the IRAC Users Manual at http://ssc.spitzer.caltech.edu/irac/descrip.html We used exposure times of 30 s and a 9-position medium-sized (52 pixels) dither pattern, for an exposure of 270s for each channel, and a total observing time of 15.8 minutes to acquire all channels, slew, and settle.
The data were reduced using the post-basic-calibration data mosaics generated by version 17.0.4 of the IRAC pipeline.222Information about the IRAC pipeline and data products can be found at http://ssc.spitzer.caltech.edu/irac/dh/ The mosaics were flat-fielded and flux-calibrated using super-flats and global primary and secondary standards observed by Spitzer. We performed aperture photometry using an aperture with a 2-pixel (or 24) radius, to maximise the signal–to–noise ratio. The object was relatively isolated with the closest source arcsec away. The object appears single in the IRAC images, as in the case of the near-infrared images. To convert to total fluxes, we applied aperture corrections as described in Chapter 5 of the IRAC Data Handbook3 of 1.205, 1.221, 1.363 and 1.571 to channels 1 through 4, respectively. The photometry was converted from milli-Janskys to magnitudes on the Vega system using the zero-magnitude fluxes given in the IRAC Data Handbook (280.9, 179.7, 115.0, and 64.1 Jy for channels 1 to 4, respectively). Photometric errors were derived from the uncertainty images that are provided with the post-basic-calibration data. The magnitudes and errors are given in Table 4. Note that in addition to the errors in the table, there are absolute calibration uncertainties of 2–3 per cent. There are also systematic uncertainties introduced by pipeline dependencies of comparable magnitude (Leggett et al. 2007b). We adopt the total photometric uncertainty to be the sum in quadrature of the values given in Table 4 plus 3%.
| Band | Magnitude (Vega) |
|---|---|
| 3.55 | |
| 4.49 | |
| 5.73 | |
| 7.87 |
3 Spectral types
Two methods for establishing spectral type are used. The first is by comparison of our spectra to the spectra of T spectral type standards as defined by Burgasser et al. (2006). Since the latest spectral type defined by that system is T8, for which the standard is 2MASS J04151954-0935066 (hereafter 2MASS0415), we also compare our spectra to the two previously identified T8+ objects, ULAS0034 and CFBDS0059.
The and band morphologies are more strongly dependent on metallicity and gravity than the and -bands. This is due to the influence of pressure dependent collisionally induced H2 absorption in the band (e.g. Burgasser et al. 2002), and the red side of the band flux peak (Allard et al. 2008). In addition, the blue side of the band peak is shaped by the red wing of the broad KI absorption centered at 7700 Å, which is strongly dependent on metallicity (Burrows et al. 2002). As such we base our spectral types on the comparisons of the and band spectra of our objects. In this case we normalise our and -band spectra to unity at and respectively, to facilitate comparison of their relative shapes, rather than heights (which will be discussed separately).
The second method for establishing type is the use of the T dwarf spectral indices, calculated as flux ratios, which are also defined by Burgasser et al. (2006). Aware that some spectral indices may become saturated for types later than T8, we place our emphasis for determining type on the template comparison, and use this to assess the validity of the defined spectral indices.
Delorme et al. (2008) argue that ULAS0034 and CFBDS0059 may represent the transition to Y spectral class due to the onset of broad NH3 absorption in the blue side of the -band flux peak. They put forward the NH3– ratio as a spectral index, and suggest that it traces the strength of ammonia absorption (see Table 5). However, given the absence of calculated ammonia opacities in the near-infrared, and possible influence of nearby water absorption band we do not feel that this identification is certain. Pending further confirmation of this feature, we will refer to this index as “NH3”–. Whether the absorption feature attributed to ammonia by Delorme et al. (2008) is indeed the first defining feature of the Y class will depend on how this feature develops towards lower temperatures and as more objects in this regime are identified.
We calculate the and “NH3”– spectral indices as put forward by Warren et al. (2007) and Delorme et al. (2008) respectively. The index traces the decreasing width of the -band peak through the ratio of flux in a section of the blue slope of the peak to that in the crown. As such the value index is driven by the strength of the -band water absorption. These indices and the flux ratios from which they are derived are given in Table 5 for the three objects we have introduced, in addition to those for the T8 standard 2MASS0415 and the two previously discovered T8+ objects. The final two columns of Table 5 give the implied type from the template comparison and the spectral type we adopt for each object, as discussed in more detail in the following sections.
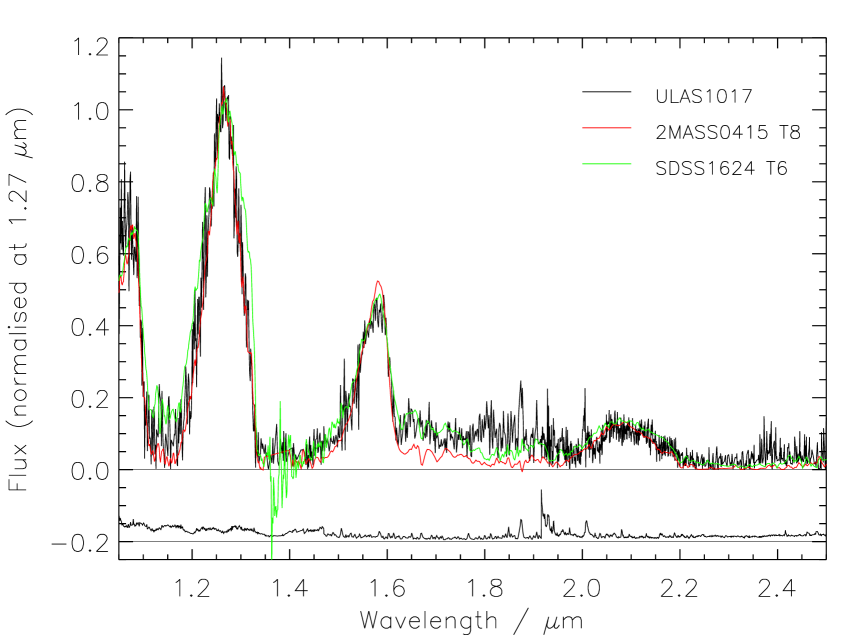
3.1 ULAS1017
The spectrum of ULAS1017 has a peculiar property. It appears to have a different spectral type in the and -band flux peaks as compared to the -band peak. Figure 3 shows the comparison of our IRCS+NIRI spectrum for ULAS1017 with the T8 standard 2MASS0415 and the T6 standard SDSS J162414.37+002915.6 (hereafter SDSS1624). ULAS1017 traces the form of the T8 spectrum well in the -band, but the -band peak matches the T6 spectrum best, particularly towards the the red end of this region. This is reflected in the calculated spectral indices for this object (see Table 5). We adopt therefore the type T8p for this object.
We do not think such morphology could arise as a result of a T8 + T6, or similar, unresolved binary, as flux from the brighter T6 would tend to fill-in the deep absorption feature in the -band, where we see very little flux in this case. Furthermore, spectral synthesis using various binary components, following the method of Burgasser et al. (2008), is not able to reproduce the spectral ratios seen for this object. The problem arises because earlier type objects, which can reproduce the and bands tend to dominate the light, and drive the ratios in the band to earlier values also. Although -band flux reversals have been observed elsewhere (e.g., Looper et al. 2008), the late spectral type of this object would seem to preclude that interpretation. Pinfield et al. (2008) identified ULAS J1150+0949, a T6.5p with a similarly peculiar early -band type (of T3 in this case), so such morphology may be a generic trait for some objects.
| Index | H2O - | CH4 - | H2O - | CH4 - | “NH3” - | CH4 - | / | Template | Type | |
|---|---|---|---|---|---|---|---|---|---|---|
| Flux ratio | ||||||||||
| 2MASS0415 | 0.030 (T8) | 0.168 (T8) | 0.31 | 0.173 (T8) | 0.105 (T8) | 0.050 (T7) | 0.134 | … | T8 | |
| ULAS0034 | (T8) | (T8) | (T8) | (T8) | (T7) | T8 | T9 | |||
| CFBDS0059 | (T8) | (T8) | (T8) | (T8) | (T7) | T8 | T9 | |||
| ULAS1017 | (T8) | (T8) | (T6) | (T6) | (T6) | T8/T6 | T8p | |||
| ULAS1238 | (T8) | (T7) | (T8) | (T8) | (T7) | … | T8 | T8.5 | ||
| ULAS1335 | (T8) | (T8) | (T8) | (T8) | (T7) | T8 | T9 |
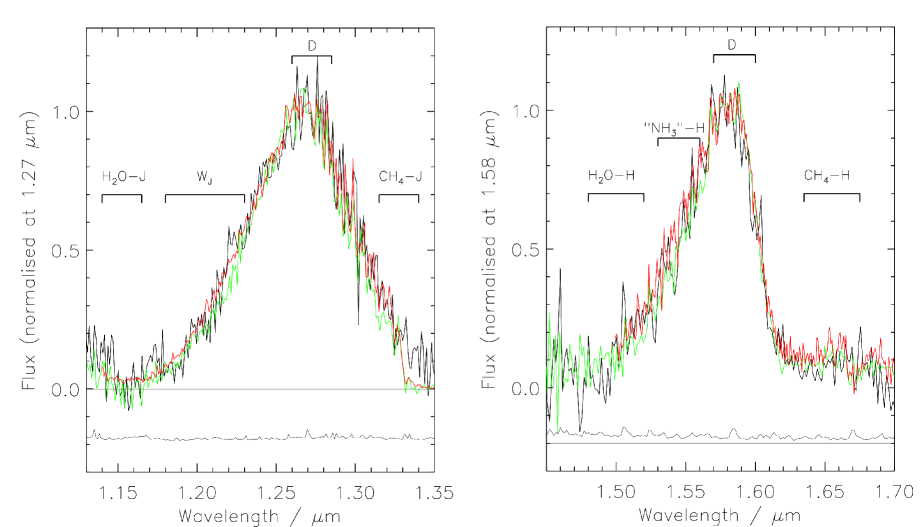
3.2 ULAS1238
Figure 4 compares the and -band flux peaks for ULAS1238 to those for 2MASS0415 and ULAS0034. Initial examination of these plots, and the spectral indices given in Table 5, suggest a spectral type of T8 for ULAS1238. Closer examination of the -band peak reveals some similar narrow features in the spectra of ULAS0034 and ULAS1238. Additionally, the width of the -band peak, and the values of the -band spectral indices imply that ULAS1238 is in fact intermediate between ULAS0034 and 2MASS0415. If we adopt the type T9 for ULAS0034 (see Section 3.3), then ULAS1238 could reasonably be classified as T8.5. However, the inherently small changes in near-infrared spectral morphology in this regime make such distinctions non-critical in the absence of additional mid-infrared spectral coverage.
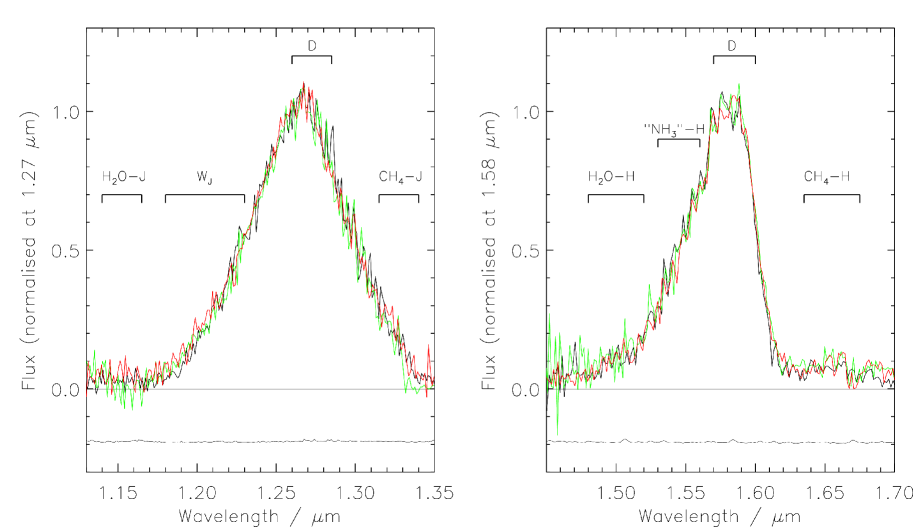
3.3 ULAS1335
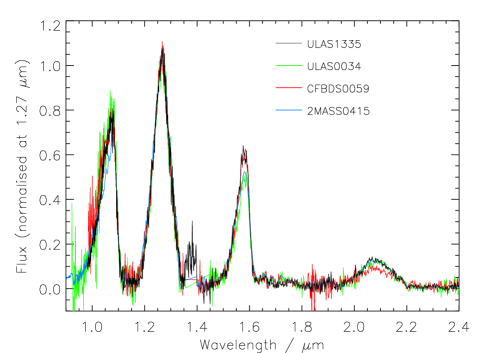
An initial inspection of the shapes of the and -band flux peaks of ULAS1335 (see Figure 5) indicates that it is of the same spectral type as ULAS0034, and CFBDS0059. In particular it should be noted that the strength of the absorption blueward of that Delorme et al. (2008) attribute to NH3 is similar for all three objects. Given the close similarity of these objects to the rest of the T dwarf sequence, it is appropriate that these objects form an extension of that sequence, and we assign to them the subtype T9. Figure 6 shows the full comparison of ULAS1335, CFBDS0059, ULAS0034 and 2MASS0415. Although the shapes of the -band peaks are similar for the three objects, their height relative to the -band peak varies significantly. Specifically, ULAS1335 and CFBDS0059 both exhibit much stronger -band peaks than either ULAS0034 or 2MASS0415.

In Figure 7 we plot the and band spectral indices against the spectral types derived by template comparison for objects with types T6 to T9 (see below). It is apparent that the water and methane -band indices previously used for the classifying T dwarfs are degenerate with type for the subtypes T8 and T9. Examination of Figure 7 indicates that the same may be true for the CH4– index, although the H2O– index is still able to distinguish these objects. The new indices “NH3”– and both appear able to distinguish the T9 dwarfs from the earlier type objects, however the “NH3”– index is degenerate with type for the earlier objects.
In Figure 9 we plot the “NH3”– index against the spectral index suggested by Warren et al. (2007). It is apparent that the latest objects are well separated from T8 objects in this plot. However, the values of and “NH3”– do not show a consistent correlation for the latest objects. Figure 9 shows the H2O– index plotted with . Again, the three latest objects are well separated from the other objects, however in this case the values of the two indices show a clear trend (with the exception of the T8p dwarf), both decreasing together. The scatter in “NH3”– values in Figure 9, compared to the correlation shown in Figure 9 thus suggests that although “NH3”– is useful for identifying T8+ objects, it is not an effective typing index for very late objects in the range we are considering, and does not conveniently strap on to the previous T dwarf sequence.
We suggest that the appropriate spectral indices for the extension of the T-spectral class to T9 are H2O– and . To provide continuity with the earlier T-indices we define the range of and H2O– for types T7-T9, matching our values to the H2O– values of Burgasser et al. (2006) for types T7 and T8, and using the apparent correlation in Figure 9 to arrive at appropriate values. Our proposed set of spectral indices for the latter portion of the T spectral sequence are summarised in Table 6. In this scheme, ULAS1335, as well as ULAS0034 and CFBDS0059, are all T9 dwarfs, which are our adopted types. Since ULAS1335 is significantly brighter than both ULAS0034 and CFBDS0059, we also propose ULAS1335 as the template for the T9 subtype.
In Section 5.2 we estimate a for ULAS1335 which is marginally cooler than the Warren et al. (2007) estimate for ULAS0034. This temperature sequence is well represented by the locations of the objects in Figure 9, but not by the sequence shown in Figure 9. If the “NH3”– index is indeed tracing a broad ammonia absorption band, this suggests two things. Firstly, it appears to develop at odds with the water absorption in the -band (which the feature traces) and the H2O– absorption feature, Secondly, if the relative temperatures of ULAS0034 and ULAS1335 are to be believed, it does not correlate well with temperature.
There is some theoretical justification for expecting near-infrared ammonia absorption to be only weakly dependent on . Ammonia chemistry is governed by upmixing, and in practice the mixing ratio depends most strongly on the ammonia abundance at the quench level. Since this is at a nearly fixed temperature, 2000 K, the remaining variables that will affect it are pressure and composition. Thus, we expect the ammonia mixing ratio, and by extension the strength of ammonia absorption in the near-infrared, to be far more sensitive to gravity and metallicity than . Given this behaviour, there is exciting potential for the “NH3”– index as an additional diagnostic tool for very cool T dwarfs, and its development will be followed with interest as more more objects in the very low-temperature regime are identified.


| NIR spectral type | H2O-J | CH4-J | H2O- | CH4- | CH4-K | Standard | |
|---|---|---|---|---|---|---|---|
| T7 | 0.07–0.13 | 0.21–0.28 | 0.35–0.40 | 0.20–0.26 | 0.15–0.25 | 0.13 | 2MASS0727 |
| T8 | 0.07 | 0.21 | 0.28–0.35 | 0.14–0.20 | 0.15 | … | 2MASS0415 |
| T9 | … | … | … | … | ULAS1335 |
4 Searching for common proper motion companions
It has been known for some time that the degree of multiplicity amongst very young stars is greater than that of the more evolved field star populations (Duquennoy & Mayor 1991; Leinert et al. 1993), and thus that the majority of binary systems form together in their nascent clouds. Binary components can therefore generally be assumed to share the same age and composition, and wide common proper motion companions to our new objects could thus provide valuable constraints if they are to be found. In order to address this possibility and more generally assess the kinematics of our objects, we calculated proper motions for our targets using the highest signal-to-noise multi-epoch observations available. In each case this was the WFCAM and UFTI -band images.
The IRAF routines geomap and geoxytran were used to transform between the available multi-epoch images, using an average of 12 reference stars. This allowed any motion of the T dwarfs to be accurately measured. Proper motion uncertainties were estimated from centroiding accuracies combined with the residuals associated with our derived transformations. The calculated proper motions are given in Table 7. We also estimate based on our distance estimates derived in Section 7. These estimates lie within the range of observed by Vrba et al. (2004) for L and T dwarfs.
We independently searched the Supercosmos Sky Survey database, and the Simbad database (accessing the Hipparcos and Tycho catalogues amongst others), for common proper motion companions (within 1) of the three new T dwarfs, thus searching for wide binary companions over a wide range of mass. The search was made within a projected distance of 20,000 AU from each target, calculated assuming the minimal distance within our derived constraints (see Section 7) to ensure a spatially complete search. In the case of ULAS1238 we used a lower distance estimate of 20 pc based on comparison with ULAS0034. SDSS and UKIDSS photometry were then retrieved for any common proper motion objects, and from these a spectral type range was estimated, and an approximate distance modulus inferred. Sources with distance moduli that were inconsistent with the inferred distances to our newly discovered dwarfs (see Section 7) could then be rejected as potential companions. Our search produced no potential companions for any of our targets.
| Object | 1st Epoch Coordinates | Epoch 1 | Epoch 2 | ||||
|---|---|---|---|---|---|---|---|
| mas yr-1 | mas yr | kms-1 | |||||
| ULAS1017 | 10 17 21.40 | +01 18 17.9 | 2007-03-17 | 2008-01-17 | 4-58 | ||
| ULAS1238 | 12 38 28.51 | +09 53 51.3 | 2007-02-13 | 2008-01-25 | … | ||
| ULAS1335 | 13 35 53.45 | +11 30 05.2 | 2007-04-21 | 2008-01-16 | 10-21 | ||
5 Atmospheric parameters
In the following two sections we estimate the atmospheric parameters of ULAS1017 and ULAS1335 through model comparisons, and, in the case of ULAS1335, consideration of the near-infrared to mid-infrared spectral energy distribution (SED). The model spectra we employ are a recent realisation of the BT-Settl models, for which detailed descriptions of the input physics are given in Warren et al. (2007) and Allard et al. (2008). There are uncertainties in these models that limit their use significantly for simplistic comparisons, but by limiting our analysis to relative comparisons over key spectral ranges, and some extrapolation of theoretical trends, we are able to derive a set of “best-guess” properties based on the existing theoretical and observational data.
We do not perform a detailed analysis for ULAS1238 due to the absence of -band photometry that precludes flux calibration for this part of the spectrum. Instead we speculate that its properties are likely intermediate between 2MASS0415 and ULAS0034 since its spectral type is also intermediate. However, we do not rule out the possibility of a considerably lower (see Section 6).
5.1 ULAS1017
To estimate the atmospheric parameters for ULAS1017 we repeat the (,) analysis described by Warren et al. (2007) for ULAS0034, and applied to CFBDS0059 by Delorme et al. (2008). To this end we have calculated and indices for a grid of solar metallicity BT-Settl models with log g , and . We have anchored the resulting (,) grid such that and log g = 5.0 for the empirical (,) coordinates of 2MASS0415, consistent with the detailed analysis of Saumon et al. (2007). Placing ULAS1017 on this grid implies a K and log g=5.5.

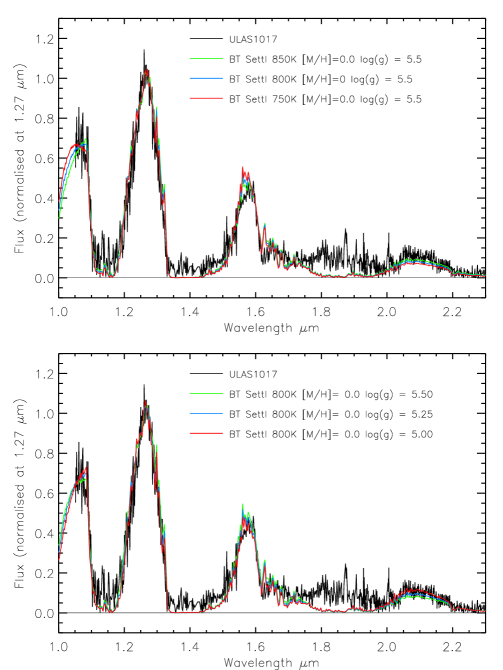
In Figure 11 we compare the spectrum of ULAS1017 to model spectra that bracket its location in the (,) plane. It appears that the model spectra generally fit the spectrum of ULAS1017 well. We note, however, that it is the model for K and log g = 5.0 that provides the best fitting spectrum, in contrast to the (,) analysis that suggests log g = 5.5.
The location of ULAS1017 in Figure 10 is very close to that of Gl 570D. It is worth noting that using detailed analysis with consideration of non-equilibrium effects,Saumon et al. (2006) derive parameters for Gl 570D of K and log g = 5.09-5.23. This is very similar to our best value from spectral comparison for ULAS1017, but similarly at odds with the parameters from simple (,) analysis.
Note also that this form of analysis can only provide approximate estimates of the atmospheric parameters, and it must be remembered that varying estimates of surface gravity will be degenerate with respect to varying metallicity. The lack of -band coverage in our spectrum of ULAS1017 prevents us from making any estimate of its metallicity relative to other objects based on the form of its -band peak. Furthermore, the form of the -band flux peak, resembling that of a T6 dwarf adds an additional element of uncertainty to our “best-guess” properties for this object.
5.2 ULAS1335
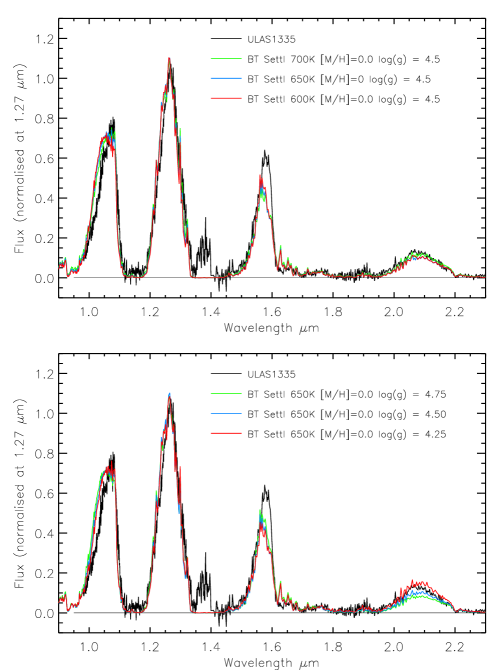
We will begin by placing ULAS1335 on the (,) grid (see Figure 10), which implies K and log g . To assess the credence of these theoretical predictions, Figure 12 shows the comparison of ULAS1335 with the BT-Settl synthetic spectra for the atmospheric parameters that bracket its location in the (,) plane for solar metallicity. It is clear that these synthetic spectra are not a good fit to the data. The most obvious discrepancy is the height of the -band flux peak. It is widely acknowledged that the shape of the -band peak is poorly reproduced by model spectra, a fact that is attributed to incomplete methane line lists. However, in the cases of ULAS0034, CFBDS0059 and 2MASS0415, the observed height of the -band flux peak is well represented by the model spectra for the atmospheric parameters estimated from their location in the (,) plot (see Warren et al. 2007; Delorme et al. 2008, figures 6 and 7 respectively) It is thus clear that despite many similarities between ULAS1335 and the other two T9 dwarfs, its -band peak is, by comparison, significantly brighter. Some of the properties of ULAS1335 are thus presumably somewhat different to the other two T9 dwarfs.
We can make a first assessment of possible differences in metallicity by considering the shape of the -band peak. All available theoretical models indicate that the shape of this flux peak will be sensitive to [M/H], although there is some ambiguity as to exactly how compositional changes will affect its shape. A comparison of the -band peaks of the three T9 dwarfs in Figure 6 reveals them to have an extremely similar -band spectral morphology, and it thus seems unlikely that these objects have significantly different metallicity.
Figure 12 shows what changes we might expect for varying and . In the bottom plot it can be seen that although a higher gravity can increase the brightness of the -band peak relative to the and -band peaks, it has the opposite effect on the -band flux peak. These trends thus indicate that it is not possible to theoretically account for the relatively bright -band peak of ULAS1335 compared to the other T9 dwarfs, simply by varying alone.
We can obtain a better match between theoretical and observed spectra if we adopt a lower for ULAS1335. The top plot in Figure 12 demonstrates the trend in the BT-Settl model spectra, and shows that the relative brightness of the -band peak increases compared to the - and -band peaks as decreases below 700K. However, note that although there is some change to the relative strength of the -band peak, it is not as drastic as when one varies . The overall near infrared morphology of ULAS1335 is thus best explained (through current theory) if this object has a somewhat lower than ULAS0034.
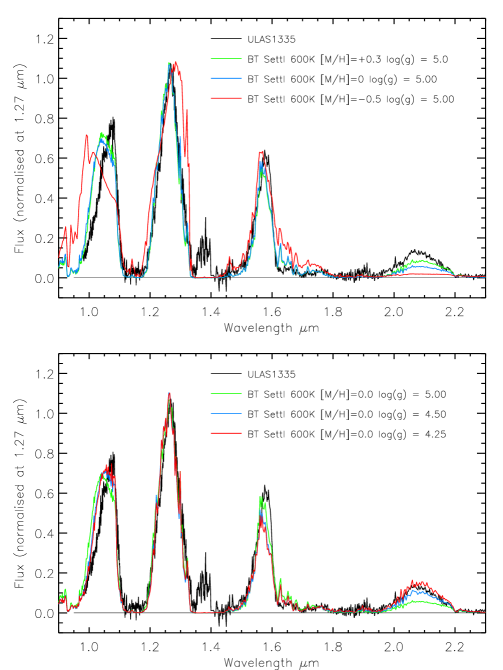
In Figure 13 we compare the spectra of ULAS1335 to a range of model spectra with different metallicities and gravities for our lowest available temperature models, K. In the top plot, the combination log g = 5.0, K model spectra all estimate the height of the -band peak well. The sub-solar metallicity model is a poor match everywhere else however. The high-metallicity model gives a reasonable approximation to the observed spectrum, but as expected it under-estimates the -band flux somewhat, and has a significantly wider and blue-ward shifted -band peak.
In the bottom plot, the 4.25-4.50 model spectra provide a reasonable fit to the whole near infrared spectra. However, whilst reproducing the -, -, and -band peaks, these spectra still somewhat under-estimate the brightness of the -band peak. Although the low of this model has gone some way to addressing the relative brightness of this peak, the model trends suggest that we should obtain a better fit by going to even lower .
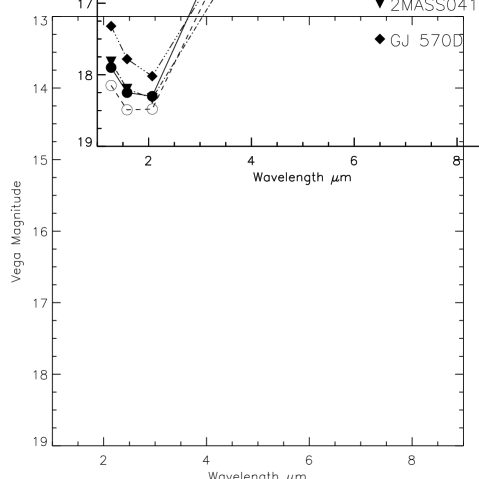
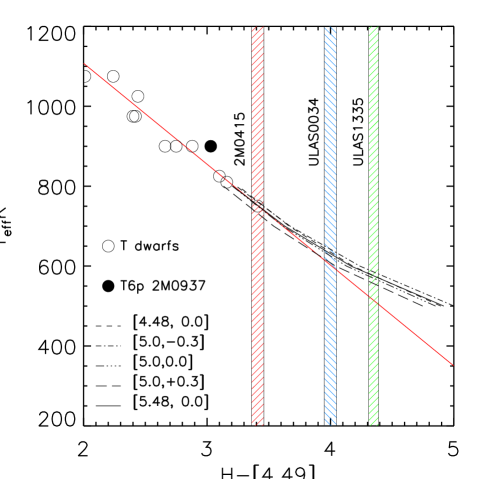
Investigation of the near-infrared to mid-infrared SED for ULAS1335 reveals that is extremely red. Figure 14 shows the 1-8 SEDs for ULAS1335, ULAS0034, 2MASS0415 and Gl 570D. Whilst the form of the SEDs are similar, ULAS1335 is significantly redder than ULAS0034 over the 2 - 4.49 range. ULAS1335 has , the reddest value yet observed for a T dwarf. Warren et al. (2007) identified a correlation between the –[4.49] colour and for T dwarfs with well determined (Golimowski et al. 2004). In fact the correlation for T dwarfs with K is particularly tight, with an RMS about the best-fitting linear relation of 28K. In Figure 15 we show this linear fit, and indicate the –[4.49] colours of 2MASS0415, ULAS0034 and ULAS1335. Theoretical tracks are also over-plotted for a recent realisation of the Marley et al. (2002) model atmospheres for the range 500–800K (Marley & Saumon 2008). Tracks are shown for and , bracketing the expected properties of ULAS1335. We have anchored the models for and solar metallicity to the colours of the coolest T dwarfs with well determined temperatures. It can be seen that the theoretical models are reasonably supportive of an extrapolation of the relation between -[4.49] and for such and [M/H] ranges, and this extrapolation suggests that ULAS1335 has 550–600K.
In the case of ULAS0034, the temperature inferred by (,) analysis was reasonably consistent with that inferred from an extrapolation of the ––[4.49] relation. However, in the case of ULAS1335 we have seen that the two estimates differ by . The poor agreement between the model spectra for 650 K and the observed spectrum of ULAS1335 cast doubt on the temperature derived from the (,) method. It is likely that this disagreement is principally due to the fact that T9 dwarfs are in the temperature range near the limit of where the near-infrared model spectra are valid. Since no model spectra cooler than 600 K are plotted, a degeneracy in (,) for these temperatures cannot be ruled out. Indeed, Figure 10 indicates that there is a predicted distortion in the grid (which will result in some degeneracy) for the lowest gravity and temperature combinations currently considered.
The strong, relatively tight correlation offered by observed T dwarf –[4.49] colours combined with the theoretical expectations for a reasonably steady shift of flux from the near-infrared into the mid-infrared with decreasing , lends weight to this colour as a better temperature indicator for such very late objects, and we adopt the temperature implied by this colour rather than that implied by the (,) method. We also suggest that the (,) method be used with caution in the regime near the limit of current atmospheric models.
To summarise, our comparison to model near infrared spectra suggested that ULAS1335 has K. This is clearly supported by the the near-to-mid infrared SED, which suggests from a theoretically informed extrapolation. Our “best-guess” for the temperature of ULAS1335 is thus 550–600K.
This temperature is stated along with an important caveat. We note that preliminary investigations of recent realisations of the Marley et al. (2002) model spectra (Marley & Saumon 2008) do not show the same trends with varying parameters in the near-infrared as the BT-Settl models. Although we defer a detailed comparison of these model spectra with the BT-Settl models to a future work, we highlight those differences of particular relevance here. Most notable is the absence of a trend of increasing height of the band peak with decreasing . In addition the height of the band peak appears more strongly dependent on metallicity than in the BT-Settl models, increasing with decreasing metallicity.
Finally, considering the absence of mid-infrared photometry for CFBDS0059, and the reliance on the (,) method for its temperature estimate, we also note that no strong conclusion regarding its temperature relative to ULAS1335 and ULAS0034 should be drawn. We cannot rule out the possibility that CFBDS0059 is cooler still.
6 Comparison with the Jovian spectrum
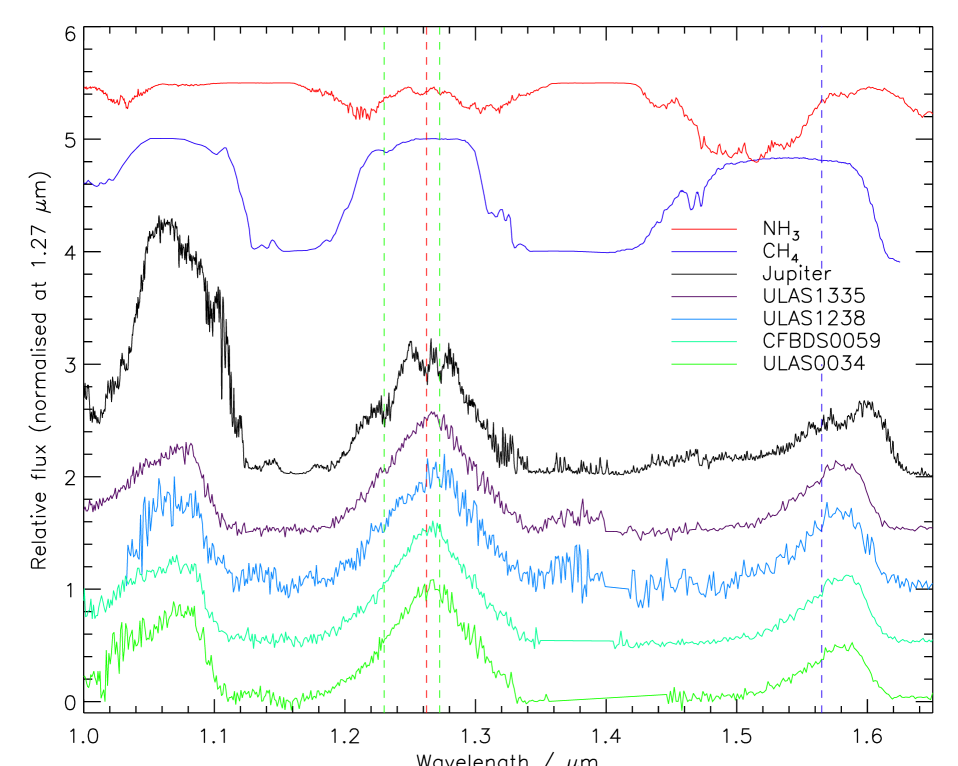
We have also examined our T dwarf spectra in more detail, to try and identify new features that might be useful in this new regime. We follow Leggett et al. (2007a) and use the spectrum of Jupiter along with transmission spectra of ammonia and methane as a basis for comparison, which we plot in Figure 16 alongside ULAS0034, CFBDS0059,ULAS1238 and ULAS1335. Although the metallicity of the Jovian atmosphere is much higher, and the gravity much lower, than that expected for our T dwarfs, this comparison with a much cooler atmosphere is still interesting.
We draw attention to the narrow feature near 1.23 (left-most vertical green line in Figure 16) which appears to be shared by Jupiter, ULAS1238 and ULAS1335. This should not be confused with the K I doublet at . We attribute this feature to methane, based on comparison with the laboratory transmission spectrum of Cruikshank & Binder (1969). We also highlight the narrow feature at (right-most vertical green line), which also appears to be common between ULAS1238, ULAS1335 and Jupiter. This may be due to ammonia, based on comparison to the transmission spectrum of Irwin et al. (1999). We note, however that the sharp feature blueward of this (indicated by a vertical red line); also likely due to ammonia is apparently absent from the spectra of the T dwarfs.
7 Physical parameters
Since metallicity is thought to only weakly impact the derivation of fundamental parameters from and log g (e.g., Saumon et al. 2007), we use the solar metallicity relations summarised by Burrows et al. (2001) to estimate the mass, age and radius for ULAS1017 and ULAS1335 from our and log g estimates.
For ULAS1017, the extreme cases from the model comparison, K and log g = 5.0–5.5 correspond to an age of 1.6–15 Gyr and a mass of 33–70 MJ. By estimating its radius from the same set of relations, and normalising the corresponding atmospheric models to the -band flux peak, we can estimate the distance to ULAS1017 to be in the range 31-54pc.
For ULAS1335, we use our best estimate of K and, since we suspect low-gravity for this object, we adopt a conservative range of for its surface gravity. These atmospheric parameters only weakly constrain the age to a range of 0.6–5.3 Gyr and the mass to 15–31 MJ.
In the absence of model spectra for K, we have estimated the bolometric flux for ULAS1335 using a pseudo-synthetic spectrum. This was constructed by bracketing our flux-calibrated YJHK spectrum with the model spectrum for K and log g = 4.5, scaling the synthetic parts with our band photometry in the optical and our IRAC [4.49] photometry in the mid-infrared. We then integrated this this pseudo-synthetic spectrum over all wavelengths to estimate the bolometric flux from ULAS1335. The uncertainty in this estimate is dominated by uncertainty in the photometry used to calibrate the spectrum. These uncertainties range from for the optical photometry to for our near-infrared photometry. These regions contribute and to the bolometric flux estimate respectively. The mid-infrared, which contributes of the bolometric flux, has an uncertainty of in its [4.49] magnitude, which we use to scale the synthesised spectrum. Allowing for additional uncertainty in the model spectrum match to the true mid-infrared spectrum, we estimate a total uncertainty in our bolometric flux to be , and the bolometric flux to be Wm-2.
The uncertainty in our distance estimate for ULAS1335 is dominated by the uncertainty in (and thus luminosity). For K and log g = 4.5–5.0 we estimate a luminosity of (by inferring radii using the relations in Burrows et al. 2001) and thus a distance of 8–12 pc. Table 8 summarises the inferred properties for the T dwarfs identified in this paper.
| Object | SpType | log g | mass | age | distance | |
|---|---|---|---|---|---|---|
| K | log(cm s-2) | MJ | Gyr | pc | ||
| ULAS1017 | T8p | 750–850 | 5.0–5.5 | 33–70 | 1.6–15 | 31–54 |
| ULAS1335 | T9 | 550–600 | 5.0 | 15–31 | 0.6–5.3 | 8–12 |
8 Summary
We have identified three very late-type T dwarfs in the UKIDSS LAS DR3: ULAS1017, ULAS1238 and ULAS1335, for which we have adopted the spectral types T8p, T8.5 and T9 respectively. ULAS1017 has a peculiar spectrum, with a -band typical of a T8 dwarf, but and -band peaks of a T6. In assigning spectral types to the our targets, we have defined the extension of the T-dwarf sequence to the type T9, using the H2O– and indices, and ULAS1335 as the spectral standard.
To estimate atmospheric parameters for ULAS1017 and ULAS1335, we have performed a detailed comparison with BT-Settl model spectra. For ULAS1017, we have estimated that its temperature lies in the range , with (assuming solar metallicity).
Our model comparison for ULAS1335 has suggested a that is cooler than the coolest available BT-Settl models (), and it may have low surface gravity possibly combined with high metallicity. As a result we have based our “best-guess” of the atmospheric parameters on an examination of the near- to mid-infrared SED. We have found ULAS1335 to be the reddest T-dwarf yet identified, with . By extrapolating the empirical – –[4.49] relation to lower , and guided by model trends, we have estimated that ULAS1335 has . This estimate suggests that ULAS1335 is the coolest brown dwarf yet discovered, although we await the determination of its distance by parallax with interest.
Acknowledgments
We wish to thank our anonymous referee for helpful suggestions that have improved the quality of this paper. We also thank P. Delorme for supplying us with an electronic version of the spectrum for CFBDS0059 for use in this work. We are extremely grateful to D. Saumon and M. Marley for providing us with model -[4.49] colours for their latest set of ultracool dwarf atmospheres. The UKIDSS project is defined in Lawrence et al. (2007). UKIDSS uses the UKIRT Wide Field Camera (WFCAM; Casali et al. 2007) and a photometric system described in Hewett et al. (2006). The pipeline processing and science archive are described in Irwin et al (2008) and Hambly et al. (2008). We have used data from the 3rd data release, which is described in detail in Warren et al. (in prep). Based on observations made with the European Southern Observatory telescopes obtained from the ESO/ST-ECF Science Archive Facility. Results reported here are based on observations obtained at the Gemini Observatory under program numbers GN-2007B-Q-26 and GN-2008A-Q-15. Gemini Observatory is operated by the Association of Universities for Research in Astronomy, Inc. (AURA), under a cooperative agreement with the NSF on behalf of the Gemini partnership: the National Science Foundation (United States), the Science and Technology Facilities Council (United Kingdom), the National Research Council (Canada), CONICYT (Chile), the Australian Research Council (Australia), Ministério da Ciência e Tecnologia (Brazil) and SECYT (Argentina). SKL is supported by the Gemini Observatory, which is operated by AURA, on behalf of the international Gemini partnership of Argentina, Australia, Brazil, Canada, Chile, the United Kingdom, and the United States of America. DBN is supported by Ministerio de Ciencia e Innovación (Spain). This research has made use of the SIMBAD database, operated at CDS, Strasbourg, France. Research has benefited from the M, L, and T dwarf compendium housed at DwarfArchives.org and maintained by Chris Gelino, Davy Kirkpatrick, and Adam Burgasser. This research has benefited from the SpeX Prism Spectral Libraries, maintained by Adam Burgasser at http://www.browndwarfs.org/spexprism.
References
- Allard et al. (2008) Allard F., Homeier D., Freytag B., Guillot T., Chabrier G., Ludwig H., Allard N., Ferguson J., Barman T., Hauschildt P., 2008, A&A, in prep.
- Burgasser et al. (2006) Burgasser A. J., Geballe T. R., Leggett S. K., Kirkpatrick J. D., Golimowski D. A., 2006, ApJ, 637, 1067
- Burgasser et al. (2002) Burgasser A. J., Kirkpatrick J. D., Brown M. E., Reid I. N., Burrows A., Liebert J., Matthews K., Gizis J. E., Dahn C. C., Monet D. G., Cutri R. M., Skrutskie M. F., 2002, ApJ, 564, 421
- Burgasser et al. (2008) Burgasser A. J., Liu M. C., Ireland M. J., Cruz K. L., Dupuy T. J., 2008, ArXiv e-prints, 803
- Burrows et al. (2002) Burrows A., Burgasser A. J., Kirkpatrick J. D., Liebert J., Milsom J. A., Sudarsky D., Hubeny I., 2002, ApJ, 573, 394
- Burrows et al. (2001) Burrows A., Hubbard W. B., Lunine J. I., Liebert J., 2001, Reviews of Modern Physics, 73, 719
- Casali et al. (2007) Casali M., Adamson A., Alves de Oliveira C., Almaini O., Burch K., Chuter T., Elliot J., Folger M., Foucaud S., Hambly N., Hastie M., Henry D., Hirst P., Irwin M., Ives D., Lawrence A., Laidlaw K., Lee D., Lewis J., Lunney D., McLay S., Montgomery D., Pickup A., Read M., Rees N., Robson I., Sekiguchi K., Vick A., Warren S., Woodward B., 2007, A&A, 467, 777
- Cruikshank & Binder (1969) Cruikshank D. P., Binder A. B., 1969, Commun. Lunar Planet. Lab., Vol. 6, (No. 103), p. 275 - 288, 6, 275
- Delorme et al. (2008) Delorme P., Delfosse X., Albert L., Artigau E., Forveille T., Reylé C., Allard F., Homeier D., Robin A. C., Willott C. J., Liu M. C., Dupuy T. J., 2008, A&A, 482, 961
- Duquennoy & Mayor (1991) Duquennoy A., Mayor M., 1991, A&A, 248, 485
- Dye et al. (2006) Dye S., Warren S. J., Hambly N. C., Cross N. J. G., Hodgkin S. T., Irwin M. J., Lawrence A., Adamson A. J., Almaini O., Edge A. C., Hirst P., Jameson R. F., Lucas P. W., van Breukelen C., and 31 co-authors, 2006, MNRAS, 372, 1227
- Fazio et al. (2004) Fazio G. G., Hora J. L., Allen L. E., Ashby M. L. N., Barmby P., Deutsch L. K., Huang J.-S., Kleiner S., Marengo M., Megeath S. T., 55 co-authors, 2004, ApJS, 154, 10
- Golimowski et al. (2004) Golimowski D. A., Leggett S. K., Marley M. S., Fan X., Geballe T. R., Knapp G. R., Vrba F. J., Henden A. A., Luginbuhl C. B., Guetter H. H., Munn J. A., Canzian B., Zheng W., and six co-authors, 2004, AJ, 127, 3516
- Hambly et al. (2008) Hambly N. C., Collins R. S., Cross N. J. G., Mann R. G., Read M. A., Sutorius E. T. W., Bond I., Bryant J., Emerson J. P., Lawrence A., Rimoldini L., Stewart J. M., Williams P. M., Adamson A., Hirst P., Dye S., Warren S. J., 2008, MNRAS, 384, 637
- Hewett et al. (2006) Hewett P. C., Warren S. J., Leggett S. K., Hodgkin S. T., 2006, MNRAS, 367, 454
- Hodapp et al. (2003) Hodapp K. W., Jensen J. B., Irwin E. M., Yamada H., Chung R., Fletcher K., Robertson L., Hora J. L., Simons D. A., Mays W., Nolan R., Bec M., Merrill M., Fowler A. M., 2003, PASP, 115, 1388
- Irwin et al. (1999) Irwin P. G. J., Calcutt S. B., Sihra K., Taylor F. W., Weir A. L., Ballard J., Johnston W. B., 1999, Journal of Quantitative Spectroscopy and Radiative Transfer, 62, 193
- Kendall et al. (2007) Kendall T. R., Tamura M., Tinney C. G., Martín E. L., Ishii M., Pinfield D. J., Lucas P. W., Jones H. R. A., Leggett S. K., Dye S., Hewett P. C., Allard F., Baraffe I., Barrado Y Navascués D., Carraro G., Casewell S. L., Chabrier G., Chappelle R. J., Clarke F., Day-Jones A., Deacon N., Dobbie P. D., Folkes S., Hambly N. C., Hodgkin S. T., Nakajima T., Jameson R. F., Lodieu N., Magazzù A., McCaughrean M. J., Pavlenko Y. V., Tadashi N., Zapatero Osorio M. R., 2007, A&A, 466, 1059
- Kirkpatrick et al. (1999) Kirkpatrick J. D., Reid I. N., Liebert J., Cutri R. M., Nelson B., Beichman C. A., Dahn C. C., Monet D. G., Gizis J. E., Skrutskie M. F., 1999, ApJ, 519, 802
- Kobayashi et al. (2000) Kobayashi N., Tokunaga A. T., Terada H., Goto M., Weber M., Potter R., Onaka P. M., Ching G. K., Young T. T., Fletcher K., Neil D., Robertson L., Cook D., Imanishi M., Warren D. W., 2000, in Presented at the Society of Photo-Optical Instrumentation Engineers (SPIE) Conference, Vol. 4008, Proc. SPIE Vol. 4008, p. 1056-1066, Optical and IR Telescope Instrumentation and Detectors, Masanori Iye; Alan F. Moorwood; Eds., Iye M., Moorwood A. F., eds., pp. 1056–1066
- Lawrence et al. (2007) Lawrence A., Warren S. J., Almaini O., Edge A. C., Hambly N. C., Jameson R. F., Lucas P., Casali M., Adamson A., and thirteen co-authors, 2007, MNRAS, 379, 1599
- Leggett et al. (2006) Leggett S. K., Currie M. J., Varricatt W. P., Hawarden T. G., Adamson A. J., Buckle J., Carroll T., Davies J. K., Davis C. J., Kerr T. H., Kuhn O. P., Seigar M. S., Wold T., 2006, MNRAS, 373, 781
- Leggett et al. (2002) Leggett S. K., Golimowski D. A., Fan X., Geballe T. R., Knapp G. R., Brinkmann J., Csabai I., Gunn J. E., Hawley S. L., Henry T. J., Hindsley R., Ivezić Ž., Lupton R. H., Pier J. R., Schneider D. P., Smith J. A., Strauss M. A., Uomoto A., York D. G., 2002, ApJ, 564, 452
- Leggett et al. (2007a) Leggett S. K., Marley M. S., Freedman R., Saumon D., Liu M. C., Geballe T. R., Golimowski D. A., Stephens D. C., 2007a, ApJ, 667, 537
- Leggett et al. (2007b) Leggett S. K., Saumon D., Marley M. S., Geballe T. R., Golimowski D. A., Stephens D., Fan X., 2007b, ApJ, 655, 1079
- Leinert et al. (1993) Leinert C., Zinnecker H., Weitzel N., Christou J., Ridgway S. T., Jameson R., Haas M., Lenzen R., 1993, A&A, 278, 129
- Lodieu et al. (2007) Lodieu N., Pinfield D. J., Leggett S. K., Jameson R. F., Mortlock D. J., Warren S. J., Burningham B., Lucas P. W., Chiu K., Liu M. C., Venemans B. P., McMahon R. G., Allard F., Baraffe I., Y Navascués D. B., Carraro G., Casewell S. L., Chabrier G., Chappelle R. J., Clarke F., Day-Jones A. C., Deacon N. R., Dobbie P. D., Folkes S. L., Hambly N. C., Hewett P. C., Hodgkin S. T., Jones H. R. A., Kendall T. R., Magazzù A., Martín E. L., McCaughrean M. J., Nakajima T., Pavlenko Y., Tamura M., Tinney C. G., Zapatero Osorio M. R., 2007, MNRAS, 379, 1423
- Looper et al. (2008) Looper D. L., Gelino C. R., Burgasser A. J., Kirkpatrick J. D., 2008, ArXiv e-prints, 803
- Looper et al. (2007) Looper D. L., Kirkpatrick J. D., Burgasser A. J., 2007, AJ, 134, 1162
- Manchado et al. (1998) Manchado A., Fuentes F. J., Prada F., Ballesteros E., Barreto M., Carranza J. M., Escudero I., Fragoso-Lopez A. B., Joven-Alvarez E., Manescau A., Pi M., Rodriguez-Ramos L. F., Sosa N. A., 1998, in Presented at the Society of Photo-Optical Instrumentation Engineers (SPIE) Conference, Vol. 3354, Proc. SPIE Vol. 3354, p. 448-455, Infrared Astronomical Instrumentation, Albert M. Fowler; Ed., Fowler A. M., ed., pp. 448–455
- Marley & Saumon (2008) Marley M. S., Saumon D., 2008, Private Cummunication
- Marley et al. (2002) Marley M. S., Seager S., Saumon D., Lodders K., Ackerman A. S., Freedman R. S., Fan X., 2002, ApJ, 568, 335
- Moorwood et al. (1998) Moorwood A., Cuby J.-G., Biereichel P., Brynnel J., Delabre B., Devillard N., van Dijsseldonk A., Finger G., 13 co-authors, 1998, The Messenger, 94, 7
- Patten et al. (2006) Patten B. M., Stauffer J. R., Burrows A., Marengo M., Hora J. L., Luhman K. L., Sonnett S. M., Henry T. J., Raghavan D., Megeath S. T., Liebert J., Fazio G. G., 2006, ApJ, 651, 502
- Pinfield et al. (2008) Pinfield D. J., Burningham B., Tamura M., Leggett S. K., Lodieu N., Lucas P. W., Mortlock D. J., Warren S. J., Homeier D., Ishii M., McMahon R. G., and 29 co-authors, 2008, MNRAS submitted
- Roche et al. (2003) Roche P. F., Lucas P. W., Mackay C. D., Ettedgui-Atad E., Hastings P. R., Bridger A., Rees N. P., Leggett S. K., Davis C., Holmes A. R., Handford T., 2003, in Presented at the Society of Photo-Optical Instrumentation Engineers (SPIE) Conference, Vol. 4841, Instrument Design and Performance for Optical/Infrared Ground-based Telescopes. Edited by Iye, Masanori; Moorwood, Alan F. M. Proceedings of the SPIE, Volume 4841, pp. 901-912 (2003)., Iye M., Moorwood A. F. M., eds., pp. 901–912
- Saumon et al. (2006) Saumon D., Marley M. S., Cushing M. C., Leggett S. K., Roellig T. L., Lodders K., Freedman R. S., 2006, ApJ, 647, 552
- Saumon et al. (2007) Saumon D., Marley M. S., Leggett S. K., Geballe T. R., Stephens D., Golimowski D. A., Cushing M. C., Fan X., Rayner J. T., Lodders K., Freedman R. S., 2007, ApJ, 656, 1136
- Vrba et al. (2004) Vrba F. J., Henden A. A., Luginbuhl C. B., Guetter H. H., Munn J. A., Canzian B., Burgasser A. J., Kirkpatrick J. D., Fan X., Geballe T. R., Golimowski D. A., Knapp G. R., Leggett S. K., Schneider D. P., Brinkmann J., 2004, AJ, 127, 2948
- Warren et al. (2007) Warren S. J., Mortlock D. J., Leggett S. K., Pinfield D. J., Homeier D., Dye S., Jameson R. F., Lodieu N., Lucas P. W., Adamson A. J., and 14 co-authors, 2007, MNRAS, 381, 1400