“Dark Matter” in Accretion Disks
Abstract
Using Spitzer Space Telescope photometric observations of the eclipsing, interacting binary WZ Sge, we have discovered that the accretion disk is far more complex than previously believed. Our 4.5 and 8 micron time series observations reveal that the well known gaseous accretion disk is surrounded by an asymmetric disk of dusty material with a radius approximately 15 times larger than the gaseous disk. This dust ring contains only a small amount of mass and is completely invisible at optical and near-IR wavelengths, hence consisting of “dark matter”. We have produced a model dust ring using 1 micron spherical particles with a density of 3 g/cm3 and with a temperature profile ranging from 700-1500K. Our discovery about the accretion disk structure and the presence of a larger, outer dust ring have great relevance for accretion disks in general, including those in other interacting binary systems, pre-main sequence stars, and active galaxies.
1 Introduction
Cataclysmic variables (CVs) are semi-detached binaries in which a white dwarf primary is accreting material from its close neighbor, a low-mass Roche-lobe filling object. The donor stars are often taken to be of the main sequence variety, but recent observational evidence frequently suggests that they may be more evolved and/or brown dwarf-like stars (e.g., Howell et al., 2006). Accretion disks that form in CVs have been well studied and modeled using observations obtained from X-rays to the near-IR spectral regions (Warner 1995). The derived picture of the “standard disk” model is a geometrically thin disk of gaseous material orbiting the white dwarf. Disk models, bolstered by observation, follow a temperature distribution, T(r), given by
where is proportional to the white dwarf mass and radius and the mass accretion rate (see Frank et al., 1992). Typical accretion disks produce a spectrum that in gross detail can be approximated by a sum of blackbody rings, each of increasing radius, decreasing temperature, and increasing emitting volume. The observed spectrum thus has a Rayleigh-Jeans-like tail that follows a distribution. In specific detail, accretion disks act more like plane parallel stellar atmospheres, providing an underlying continuum source and emission lines from their “chromosphere”. The highly broadened emission lines (due to the rapidly rotating disk) of H and He provide the classic spectral signature of the accretion disk in CVs. The history of accretion disk observations and models in interacting binaries is discussed in detail in Warner (1995).
During the Spitzer Space Telescope cycle 3 round of observations, we obtained the first and, to date, only mid-IR time series observations of an interacting binary containing a white dwarf primary and a low mass secondary star. This data set is one of only a relatively few Spitzer time series observations for any kind of astronomical object. Our target, the famous eclipsing interacting binary system WZ Sge, was chosen as a follow on to our cycle 2 Spitzer observations of magnetic CVs (polars). Our Spitzer observations of magnetic interacting binaries, in which we discovered the presence of extended circumbinary dust disks are discussed in Howell et al. (2006), Brinkworth et al. (2007), Hoard et al. (2007). WZ Sge, an eclipsing, non-magnetic, interacting binary, was observed in order to see if circumbinary dust disks were common in all types of interacting binaries or only those with strongly magnetic white dwarf primaries.
Our Spitzer observations are detailed in the next section. We then present evidence using nearly simultaneous optical and near-IR ground-based observations to show that WZ Sge was at quiescence and behaving normally at the time of our Spitzer mid-IR observations. Next we take a closer look at the phased mid-IR light curves we obtained and use these to develop a model for the intra-binary dust torus we believe to be present.
2 Observations
Table 1 provides an observing log for all of the WZ Sge observations discussed in this paper.
2.1 Spitzer Mid-IR Observations
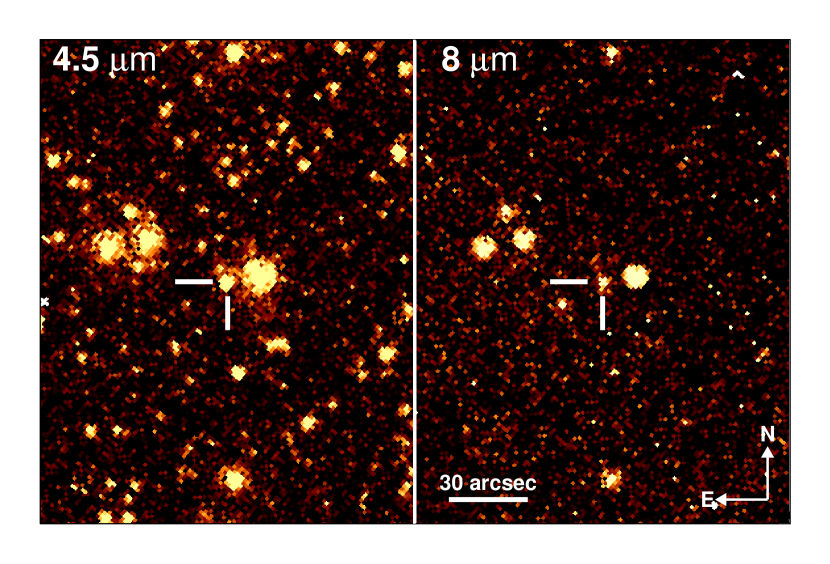
WZ Sge was observed simultaneously at 4.5 (channel 2) and 8.0 (channel 4) microns using the Infrared Array Camera (IRAC; Fazio et al. 2004) instrument on the Spitzer Space Telescope (Werner et al. 2004). The observations took place on 2007 July 03 UT (HJD 2454284.891 to 2454284.958) and lasted for 90 minutes, just over one orbital period for WZ Sge. We obtained continuous coverage of WZ Sge using 12 second exposures in both channels. As recommended by the Spitzer Science Center for time series observations, we did not perform dithers or other offsets during our exposures, achieving the desired time series of multiple exposures using “repeats”. The IRAC pmasks for channels 2 & 4 showed no bad pixels at the center of the array, so we centered WZ Sge in the field-of-view. The IRAC images were reduced and flux-calibrated with the S12 version of the Spitzer IRAC pipeline and downloaded from the archive as basic calibrated data (BCD). The BCD images were corrected for array location dependency using the correction frames provided by the Spitzer Science Center. Image mid-times were generated by converting spacecraft modified julian date (MJD) from the BCD image headers to heliocentric julian date (HJD). This time conversion utilized the algorithm that will generate HJD times in all IRAC BCD image headers starting with the S18 processing pipeline.
Taking these processed BCD images, we then performed IRAF111The Image Reduction and Analysis Facility is maintained and distributed by the National Optical Astronomy Observatory. aperture photometry on WZ Sge and four nearby stars to use as comparisons. These four nearby stars were also those used to photometrically calibrate WZ Sge in the optical (see §2.2). We used a star aperture size of 3 pixels for WZ Sge as well as all the comparison stars. From experience we found that the point response function (PRF) for the IRAC arrays is not well modeled, and we obtain more consistent results using aperture photometry rather than via PRF fitting. This is also the current advice from the IRAC Instrument Support Team at the Spitzer Science Center. Sky subtraction was accomplished by using a 3–7 pixel sky annulus around each star. The appropriate aperture correction from the IRAC Data Handbook222See http://ssc.spitzer.caltech.edu/irac/dh/. was applied to our measured flux densities. We did not perform a color correction other than to utilize the isophotal effective channel wavelengths (see Table 4) during our subsequent interpretation of the data. This accounts for all but % of the color correction. In addition, we examined light curves extracted for several field stars covering a range of brightness and found that, at the brightness of WZ Sge, the ”relaxation” effect that can sometimes cause a ”ramping-up” of measured flux densities in IRAC time series exposures had a negligible effect, so we did not apply a correction for it.
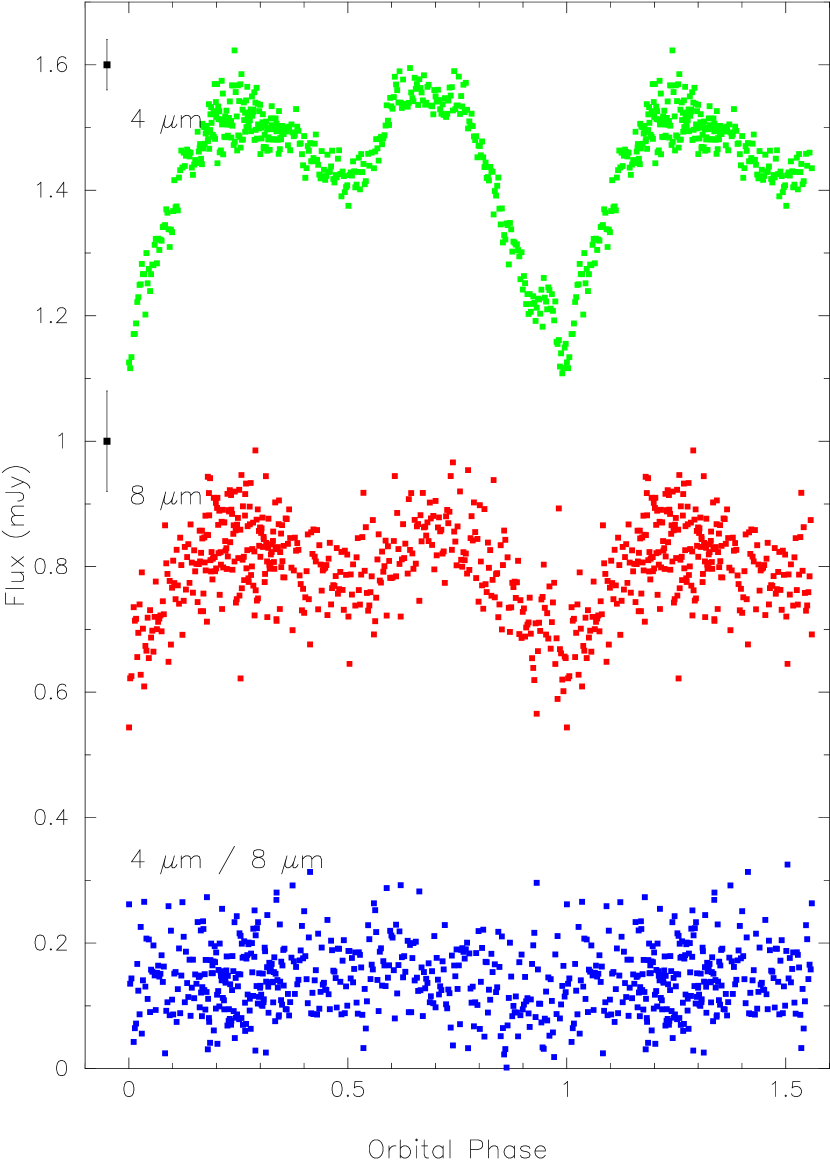
Representative IRAC images of WZ Sge at 4 and 8 microns are shown in Figure 1 and our mid-IR light curves of WZ Sge are presented in Figure 2. Phasing the Spitzer light curves to the well known 81-minute orbital period (0.0566878460 days) and the Patterson (1998) photometric ephemeris (photometric phase 0.0 = HJD 2437547.72840), we find that at the time of primary eclipse - when the white dwarf and optically emitting accretion disk gets eclipsed - we see a highly structured eclipse as well. The primary eclipse in the optical and near-IR is considered to be caused by the secondary star hiding flux from the gaseous accretion disk with photometric phase zero being the time when the secondary most directly hides the hot spot. True phase zero (that is, the time of inferior conjunction of the secondary star) is offset from photometric phase zero by -0.046 in orbital phase (Steeghs et al., 2007). We will use photometric phase 0.0 throughout this paper.
In contrast to our previous IRAC observations of magnetic interacting binaries (i.e., polars), we did not detect a rising SED from 4.5 to 8 microns but one that is approximately consistent with an extended RJ-like tail of the well known gaseous accretion disk. However, to our surprise, WZ Sge showed deep, broad eclipses in the 4.5 and 8 micron light curves (Fig. 2) indicating that the source of the mid-IR eclipsed light which provides a non-negligible fraction of the mid-IR emission is not circumbinary, but within the binary itself.
2.2 Optical and Near-IR Photometry
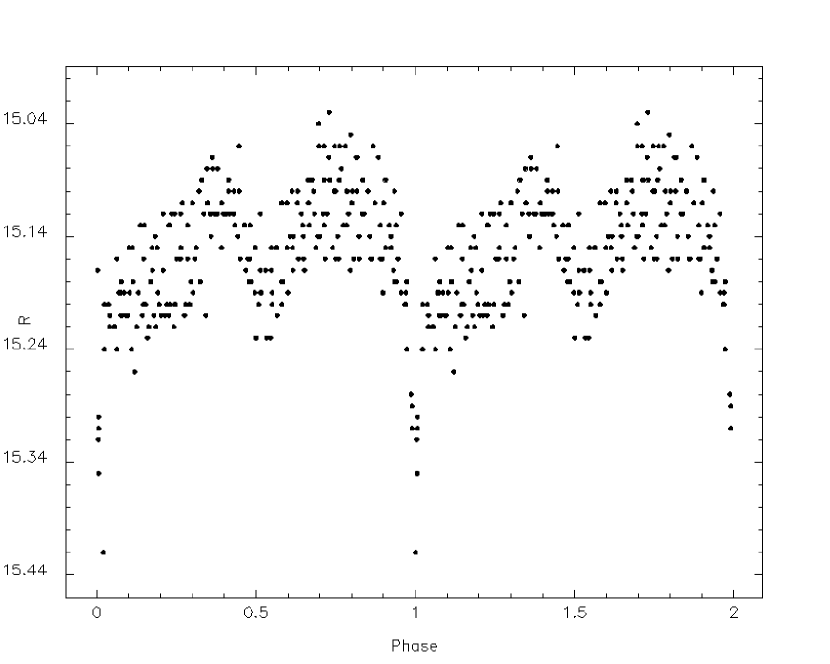
WZ Sge was observed on 26-29 June 2007 UT at the Kitt Peak 0.9-m telescope. CCD observations were obtained using the default imager at this telescope, S2KB, and light curves were collected in Johnson R band with some data obtained in Johnson B band. All images were reduced using IRAF and standard practices with aperture photometry performed for WZ Sge and three nearby stars used as comparisons. Light curves were constructed for the R band time series observations. Both R and B observations were placed on a standard magnitude scale using the listed magnitudes for the comparison stars in Henden & Honeycutt (1997) and Henden & Landolt (2001). Our four night combined R band light curve is presented in Figure 3 where the typical 1-sigma uncertainty is 0.04 magnitude and the out of eclipse scatter is real. The mean out of eclipse brightness of WZ Sge was B=15.33 and R=15.11.
We note that the R band light curve looks similar to previous light curves of WZ Sge, showing a “double-humped” structure outside of eclipse which is attributed to the observer viewing the broad side of the hot spot twice per orbit (see Skidmore et al., 2000). The primary eclipse is also typical for optical observations of WZ Sge: narrow in time (about 8 minutes long) and 0.2 magnitudes deep. The 0.9-m photometric observations occurred about 1 week prior to our Spitzer observations and we observed nothing unusual about WZ Sge in terms of its accretion state, accretion disk, or eclipse profile.
We also obtained one orbit of simultaneous R and Ks band photometry using Andicam on the SMARTS/CTIO 0.9-m telescope. These time series observations were made on 7 August 2007 UT. The R band light curve looked similar to that shown in Figure 3 while our Ks band observations required significant binning to provide good S/N thus only a single average out of eclipse Ks measurement could be obtained. WZ Sge’s Ks band brightness (Ks=14.05) was consistent with the Ks magnitude listed for this star in 2MASS (Hoard et al., 2002). Table 2 provides the near-IR brightness history of WZ Sge. Note that the last super-outburst by this star occurred in August/September 2001.
2.3 Optical Spectroscopy
Optical spectroscopy for WZ Sge was obtained both before and after our Spitzer observations. Spectra were obtained at the Kitt Peak 4-m on 3 June 2007 UT, at the Kitt Peak 2.1-m on 26-29 June 2007 UT, and at the CTIO Blanco 4-m on 3-5 July 2007 UT. The KPNO 4-m spectra covered 3800-5000 and provided only a few spectra of WZ Sge. These data looked typical of those presented herein but did not provide significant orbital coverage and are not discussed further. The 2.1-m spectra (4000-8000, 3 resolution), covered 4 sequential nights and thus provided coverage of multiple orbits of the star. The CTIO 4-m spectra spanned 4000-7600 at 3 resolution and covered a number of orbits of the star. All the spectral observations were reduced in the usual way using standard IRAF spectral reduction packages. Observations of calibration frames (bias and flat) were obtained each night with arc exposures obtained as needed, near in time and sky position to the target. Spectrophotometric standard stars were used to flux calibrate the data.
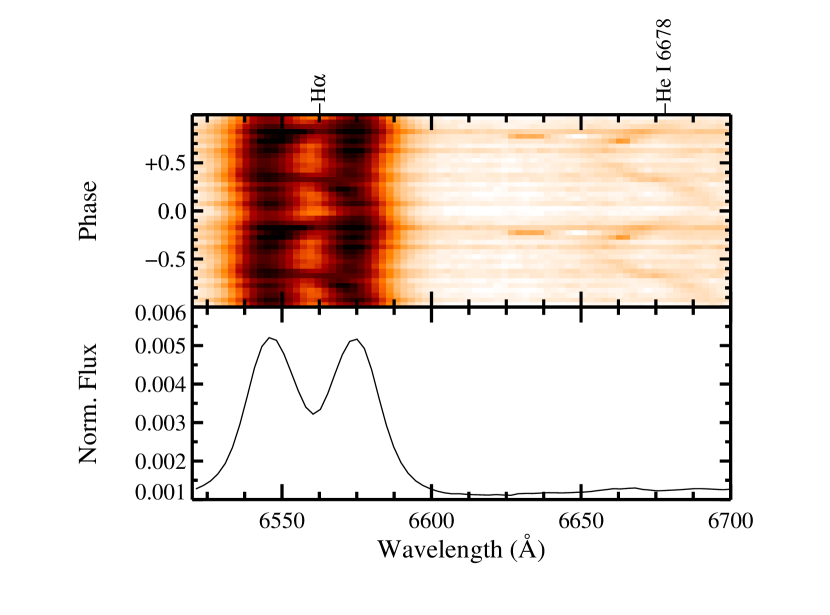
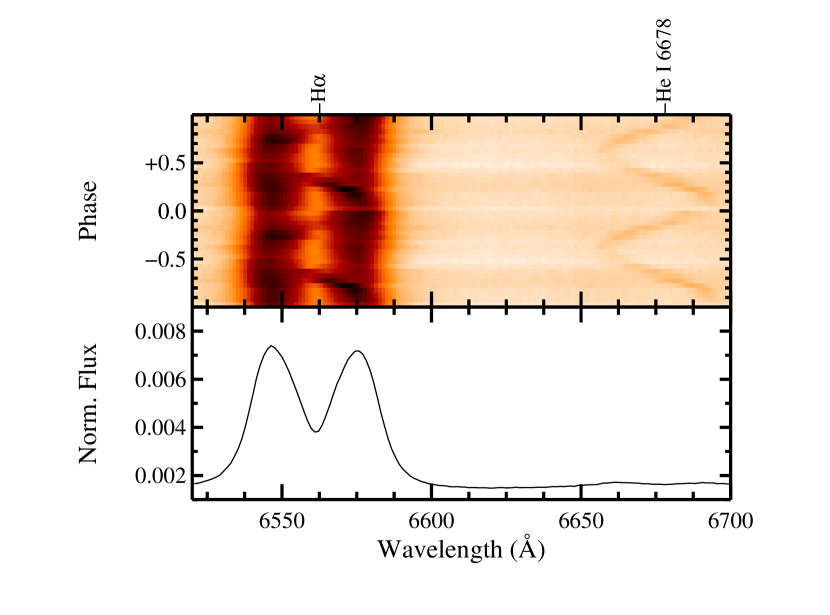
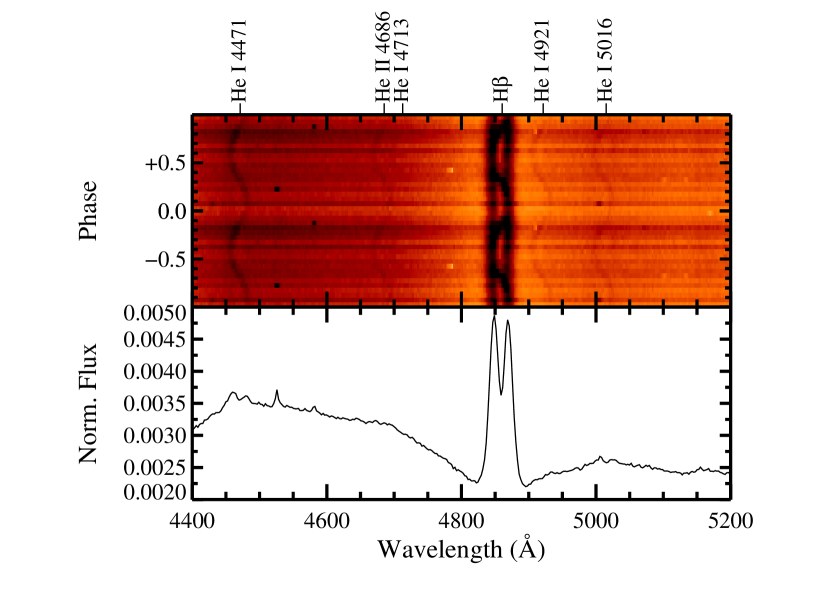
A representative mean 2.1-m spectrum is presented in Figure 4. All the Balmer lines are in emission and present the typical double peaked structure as usual for WZ Sge in quiescence, and are as expected for a high inclination cataclysmic variable containing an accretion disk. Figures 5 and 6 show the orbitally modulated S-wave, that is, the tell-tale signature of the gas stream interacting with the accretion disk (the hot spot). We note that the S wave of the H line is accompanied by the S-wave of the HeI 6678 line. Skidmore et al. (2000) obtained higher resolution (0.4), orbit-resolved optical spectra of WZ Sge and also presented trailed spectra of the H and H lines. Their spectra were obtained prior to WZ Sge’s last super-outburst in 2001. The Skidmore et al. results are very similar to those presented in our Figures 5 and 6. A more quantitative comparison of the emission lines is given in Table 3 in which we list the FWHM of H and H, measured in a similar manner to the Skidmore et al. (2000) paper. Our FWHM values, for the three nights of Blanco 4-m spectra obtained in July 2007, are again similar to those given in Table 6 of Skidmore et al. (2000).
All of our contemporaneous optical photometric and spectroscopic measurements and our Ks magnitude of WZ Sge are consistent with the star’s typical values during quiescence as outlined and presented in Skidmore et al. (2000) and references therein. We believe this consistency provides compelling evidence which assures us that at the time of our Spitzer IRAC observations, WZ Sge was displaying its usual quiescent behavior.
3 Mid-IR Light Curve Analysis
At the parallax-determined distance of 43 pc for WZ Sge (Harrison et al., 2004), the white dwarf will contribute 1% to the mid-IR flux. The optically observed gaseous accretion disk tail, roughly following a distribution for a sum of blackbodies (see Ciardi et al., 1998), should continue to fall in the absence of other flux sources. Thus, the only contributors to the flux in WZ Sge at 4.5 and 8.0 microns that were believed to be present prior to our mid-IR observations, were the tail of the gaseous accretion disk and the secondary star. Using this assumption, we can formulate a model view of what our Spitzer light curves are telling us.
At mid-IR wavelengths, the primary eclipse we observe must hide a source that is greater in flux than the hot gaseous accretion disk or any reasonable secondary star at these wavelengths. Additionally, the eclipsed source must be far more extended that the gaseous accretion disk observed in the optical due to the total time that the eclipse lasts in the mid-IR. The primary eclipse width we observe is nearly 0.3 in orbital phase (24 minutes), compared to the optically observed primary eclipse time of only 0.1 phase (8 minutes).
The phasing of the light curve tells us that cool material is being eclipsed by the secondary star from phase 0.74 to phase 0.14, with a slight asymmetric distribution to earlier phases. The time scale of the ingress, about 0.15 in phase, suggests a linear dimension of the eclipsed material of 120,000 km or about the radius of the white dwarf Roche Lobe.
The depth of the primary eclipse at 4.5 microns is about three times that observed at 8.0 microns, suggesting that the eclipsed material emits more flux (by this same ratio) at 4.5 microns. But, the color difference light curve (Flux[4.5]/Flux[8.0]), also shown in Figure 2, reveals a flat color term throughout the entire orbit. This lack of color variability sets a strict condition on the source being eclipsed; it must be generally featureless and monotonically decline from 4.5 to 8.0 microns.
The cool, dusty material being eclipsed must be very optically thin, being composed of relatively large (few micron) grains. We do not see such a large eclipse extent in the optical or near-IR (1-2.5 microns); thus our Spitzer observations have discovered that the dust disk contains dark matter - matter invisible in the optical or near-IR band-passes. The dust ring appears to be skewed from a uniform distribution and is concentrated on the side toward the secondary star, much like the accretion disk bulge observed in the interacting binary EX Hya (Belle et al., 2005). It is likely that the dust ring is not uniform in density, thickness, or radius and may show a bias toward the secondary star due to tidal forces (as it is closer to the secondary star than the white dwarf along the line of centers or due to the presence of the accretion stream and associated impact site that produces the optical bright spot.
Near phase 0.5, where a secondary eclipse would occur333Note, no secondary eclipse has ever been seen in WZ Sge in the optical or near-IR and none would be expected as the binary inclination is only 71 degrees., we see a dip in the light curve. This could be interpreted as a secondary eclipse caused by the vertically extended accretion disk itself hiding portions of the cool dust torus and/or the secondary star. If the cool dust ring is not extended, this secondary “eclipse” would be entirely due to the secondary star. However, the long duration (0.3 in phase, equal to the primary eclipse length) and the asymmetric nature of it, suggest it is not an eclipse at all, but simply a time of lower flux from the system components such as the similarly observed optical feature seen by Patterson et al., (1998, see the top panel of their Fig. 2).
4 Spectral Energy Distribution Model
4.1 The Code
In Brinkworth et al. (2007), we introduced our IR spectral energy distribution (SED) modeling code for CVs, which we applied in that work to photometric data for several magnetic cataclysmic variables (i.e., polars). Improvements to the code were described in Hoard et al. (2007), of which the most significant was the addition of a physical cyclotron model component. That component is not needed in our current study of WZ Sge (which does not contain a strongly magnetic WD). We have continued to improve the code by implementing a model component to represent the accretion disk in non-magnetic CVs. This component assumes an optically thick steady state disk composed of concentric rings emitting as blackbodies, following the “standard model” prescription in Frank, King, & Raine (2002). The accretion disk component (denoted with subscript ACD) is fully parameterized by a (constant) height (), inner and outer radii ( and ), and a mass transfer rate from the secondary star (Ṁ). The standard model radial temperature profile from Frank, King, & Raine (their Equation 5.41) is used to determine the temperature in each disk ring. The inclination of the disk is assumed to be the same as the binary inclination; higher inclination systems have smaller projected surface area, resulting in an overall decrease in the effective brightness of the disk. This component is discussed in more detail in Hoard et al. (2008), where we have successfully applied it to observations of the novalike CV V592 Cassiopeia spanning 0.1–24 microns.
The shape of the resulting model accretion disk SED is similar to a slightly flattened and stretched blackbody function; that is, it displays a relatively broad peak with a rapid drop in brightness on the short wavelength side and a gradual (Rayleigh-Jeans-like) decline on the long wavelength side (e.g., see Figure 20 in Frank, King, & Raine, 2002). In general, increasing either the disk area (i.e., making larger) or the mass transfer rate causes the overall accretion disk SED to become brighter. Increasing also tends to shift the peak of the accretion disk SED toward longer wavelengths, as more surface area is present in the cooler outer regions of the disk. Increasing Ṁ tends to shift the peak of the accretion disk SED toward shorter wavelengths, as the temperature in the inner disk increases. Thus, an accretion disk SED that contributes significantly (peaks) at short wavelengths will contribute less and less at longer wavelengths. An accretion disk SED that peaks at long wavelengths will contribute little at wavelengths only slightly shortward of the peak. So, in order to contribute significantly at long wavelengths (a case of interest here), the accretion disk SED must either peak at short wavelengths and be very bright overall, or peak at long wavelengths (in which case it will not contribute significantly at short wavelengths). These generalizations apply regardless of the exact nature of the accretion disk SED, provided that the disk follows a physically plausible radial temperature profile in which disk temperature decreases as disk radius increases.
We note that numerous attempts have been made to generate more realistic model CV accretion disks (e.g., Puebla et al. 2007; Collins et al. 1998); for example, by including effects of limb darkening, complex opacity laws, and so on. Typically, these modeling attempts are applied to the high Ṁ ( yr-1) cases (e.g., novalike CVs, dwarf novae in outburst), which makes them difficult to generalize to systems such as WZ Sge, which have extremely low mass transfer rates. In comparison, our accretion disk representation is an admittedly simple model. However, it is intended solely to approximate a realistic continuum shape for a steady state optically thick disk. It does not attempt to reproduce, for example, spectral line absorption or emission (which would require consideration of optically thin regions, such as disk chromospheres or coronae/winds). It has at least been found in more complex models (Collins et al. 1998) that the continuum spectrum emitted by an accretion disk is independent of the opacity, which provides support for the use of our simple model. Another commonality of more complex disk models is the strong degeneracy (i.e., non-uniqueness) of the solutions (Puebla et al. 2007). We are already concerned about the number of free parameters in our approach to matching the observed SED of WZ Sge (see §4.3). Previous detailed models have shown that for the continuum, at least, utilizing the simplest approach to representing the accretion disk (and other model components) works well.
4.2 The Data
Figure 7 (top) shows the observed SED for WZ Sge, composed of the weighted mean average of the out-of-eclipse portions of our IRAC light curve (i.e., excluding orbital phases 0.8–0.2), the 2MASS photometry, the weighted mean average of the out of eclipse ground-based and light curves, and a UV point at 1580 Å from the Hubble Space Telescope spectrum shown in Steeghs et al. (2007). The 2MASS J, H, and Ks magnitudes and the KPNO 0.9-m optical photometry (and their uncertainties) were converted to flux density in mJy using the absolute calibration zero points given in Cohen et al. (2003) and Cox (2000), respectively. These data are listed in Table 4.
Our measured band brightness from Andicam on 7 Aug 2007, near in time to our Spitzer observations of WZ Sge, is in close agreement with the 2MASS value. Consequently, we believe that the 2MASS photometry, which was obtained in 1998 (i.e., before the 2001 outburst), is still representative of the current post-outburst near-IR quiescent state of WZ Sge.
The flux density error bars for the IRAC data reflect the weighted standard deviations of the weighted averages plus a 3% allowance for systematic uncertainty in the flux calibration. The flux density error bars for the 2MASS and ground-based optical data are the photometric uncertainties propagated through the corresponding magnitude to flux density conversions. The flux density uncertainty on the UV point is estimated at 10%. In all cases, the “error bars” in the x-direction (wavelength) show the widths of the photometric bands.
4.3 The Model
Figure 7 (bottom) shows the SED data for WZ Sge with a representative model consisting of a WD, secondary star, gaseous accretion disk, and dusty ring around the outer accretion disk. The parameters of these model components are discussed below.
The WD (model component subscript WD) is represented by a blackbody curve with K, which was estimated by Godon et al. (2006) as the likely inter-outburst, quiescent WD temperature based on a cooling curve constructed during the decline from the 2001 outburst. The WD has and cm, obtained from the radial velocity study of Steeghs et al. (2007). The projected surface area of the WD has been reduced by 25%, consistent with obscuration by an accretion disk (see below) that extends outward from at the system inclination of (Spruit & Rutten 1998). If the full surface area of the WD is used, then the WD component alone accounts for all of the observed UV– flux density, which is inconsistent with spectroscopic observations in the optical, which show a significant non-WD contribution (see Figure 4; also Mason et al. 2000 and Gilliland et al. 1986).
The secondary star (model component subscript SS) is represented by an empirical template for an L5.0 brown dwarf based on 2MASS and Spitzer observations of the L5.0 stars GJ1001BC, SDSS J053951.99-005902.0, and 2MASS J15074769-1627386 (Patten et al. 2006). As noted by Steeghs et al. (2007), their mass of for the secondary star in WZ Sge implies a spectral type of L2; however, (as noted by those authors) this is contradicted by the lack of detection of the secondary star in the near-IR (e.g., we note that the -band flux density of an L2 brown dwarf at pc by itself exceeds the observed value for WZ Sge by almost 50%, whereas the -band flux density of an L5 brown dwarf is only % of the observed value).
For the accretion disk (model component subscript ACD), we assumed that the disk starts at the WD surface . The outer radius of the accretion disk is constrained by the relatively sharp peak in the UV–optical bands. If , then the peak of the accretion disk SED is shifted too far to the red, resulting in a much broader peak in the total model SED than is observed. This is a small accretion disk, but not unreasonably so considering that WZ Sge went through a major outburst in 2001 which likely completely (or nearly so) disrupted the accretion disk. The estimated mass transfer rate in Tremendous Outburst Amplitude Dwarf Novae (TOADs) like WZ Sge is Ṁ yr-1 (Howell et al. 1995). At low TOAD mass transfer rates, it could take a long time for the disk to re-establish itself. In the case of WZ Sge, the mass transfer rate is constrained to be even smaller ( yr-1) than the TOAD maximum so that the observed data at short wavelengths are not exceeded by the combined WD and accretion disk model components. The steady state accretion disk model component has a resultant maximum temperature of K, sufficiently hot to account for a significant amount of ionized H, as required by optical spectroscopic observations of WZ Sge. We note that forcing the accretion disk SED to account for the IRAC flux density values causes the total model SED to far exceed the observed flux densities at shorter wavelengths.
To account for the remaining long wavelength (IRAC bands) flux density, we utilized a circumstellar dust ring surrounding the accretion disk (model component subscript CSD). This component is calculated following the prescription in Brinkworth et al. (2007) and Hoard et al. (2007); namely, it is an optically and geometrically thin annular disk composed of dust grains with m and g cm-3. The dust ring is divided into 1000 concentric rings following a profile. Each ring contains the same mass of dust, resulting in a decreasing dust density at larger radii. The model is parameterized by picking inner and outer radii (which control the range of dust temperature and, hence, the overall shape of the SED), a height (which, with the two radii, determines the overall volume of the dust ring), and a total dust mass (which determines the number of re-radiating dust grains and, hence, the overall brightness of the dust ring). We constrained the inner radius to have a value such that the maximum temperature in the dust ring is in the range 1000–2000 K, corresponding to the likely temperatures of dust grain sublimation. The inner boundary condition for the radial temperature profile is provided by the WD temperature and radius; in principle, the accretion disk also heats the dust, but we have not accounted for this, primarily because of the complexity of calculating heating of the dust due to two sources, as described in Brinkworth et al. (2007). We note, however, that the end result of having a higher boundary condition temperature would be to move the dust ring radii to larger values in order to produce the same inner and outer dust temperatures. The model SED shown in Figure 7 requires inner and outer radii of 11 and 30 , respectively, resulting in dust temperatures of K throughout the ring. The requisite total dust mass is g (about or about ) This mass is equivalent to a relatively small asteroid in our solar system (e.g., about 5% of the mass of 433 Eros; Baer & Chesley 2008), which suggests a possible origin for the dust in the tidal disruption of an asteroid by the WD. Alternatively, the dust could have condensed out of material ejected from the WD and accretion disk during the 2001 outburst that did not escape from the WD Roche lobe.
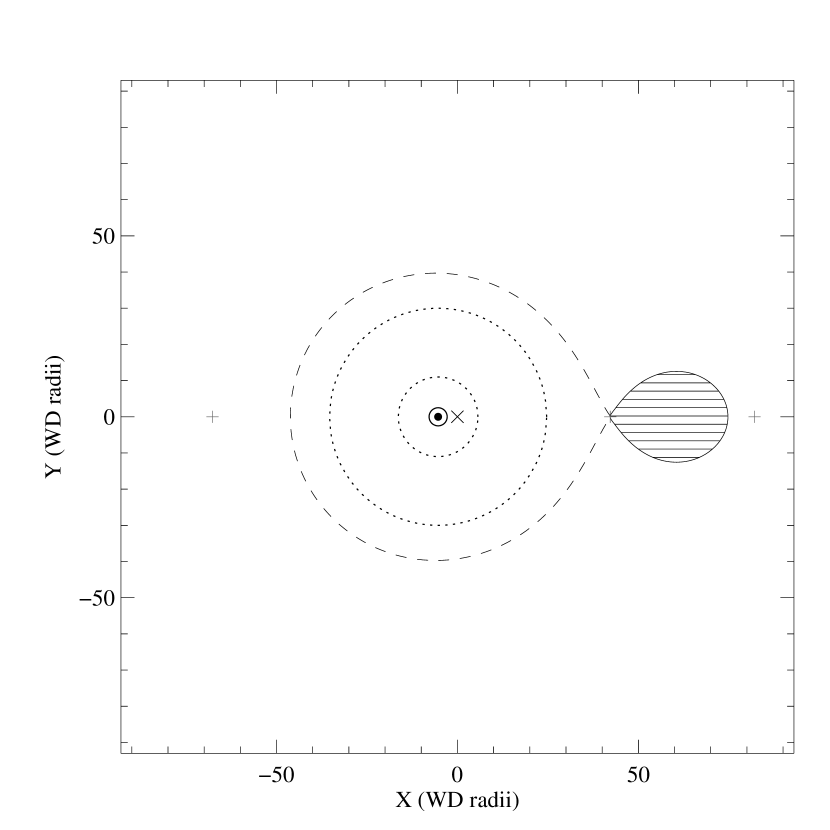
All of the model components were scaled to a distance of pc, which was determined from Hubble Space Telescope Fine Guidance Sensor trigonometric parallax measurements (Harrison et al. 2004). The values of the model component parameters are listed in Table 5. Figure 8 shows a to-scale diagram of the system.
As detailed more fully in §3.2.5 of Hoard et al. (2007), the model SED shown in this work is not, strictly speaking, a unique solution, in the sense that very similar results can be achieved from somewhat different combinations of input parameters. We have tried to minimize this effect as much as possible by constraining plausible parameter ranges based on whatever other information, observational data, and reasonable assumptions are available. In some cases, we can set firm upper and/or lower limits on the plausible ranges for parameters. For example, the inner and outer radii of the circumstellar dust ring are bounded by the radii at which the ambient temperature exceeds 2000 K (and dust sublimates) and the WD Roche lobe, respectively.
Other limits can be set by the requirement that the total model SED (or that of an individual model component) cannot (greatly) exceed the nominal observed SED – as described above, the mass transfer rate cannot be significantly larger than yr-1 or the WD and accretion disk together are brighter than the observed optical–near-IR data. Similarly, we can exclude L2 and earlier spectral types for the secondary star in WZ Sge because they are too bright at certain wavelengths compared to the observations. We note, however, that later spectral types for the secondary star (which, regardless of the exact value of its mass, can be largely a matter of the temperature – hence, cooling time – of this low mass, brown-dwarf-like object) cannot be strongly constrained. In fact, an L7 secondary star would improve the model results because the “hump” in the L5 SED between –3.5 m (which is actually unabsorbed continuum on the long wavelength side of a prominent methane absorption band) shifts to longer wavelengths in the L7 SED. This makes reproducing the sharp bend in the near-IR bands easier. Nonetheless, we have used an L5 secondary star as the most conservative estimate for WZ Sge.
On the other hand, the interplay between some model parameters (e.g., the dust grain size and density) is such that the effect of changing one parameter can be exactly offset by adjusting another. In such cases, we have had no choice but to fix the model parameters at reasonable values. In Table 5, we have included an estimate of the range over which certain model parameters (e.g., those which are not tightly constrained by published observations and analysis) still produce a total model SED that, while not as good as the representative model shown in Figure 7, nonetheless does not deviate significantly from the observed data (i.e., it reproduces the approximate flux density levels and gross details of the observed SED; namely, a narrow peak at optical wavelengths, a plateau in the near-IR out to m, and a gradual decline at longer wavelengths). We have made an attempt to re-optimize the total model SED after changing the value of one parameter by adjusting the others (e.g., the effect of decreasing the mass transfer rate can be somewhat offset by increasing the accretion disk outer radius). The accretion disk and circumstellar dust ring components are largely detached from each other in this regard: each of them is most significant over a different wavelength range (short wavelength for the accretion disk, long wavelength for the dust ring). This means that the largest discrepancies between model and observation, when changing the parameters of either of these components, occurs in the near-IR, where they overlap.
5 Discussion
Using Spitzer Space Telescope observations, we have discovered evidence that a cool circumstellar dust ring surrounds the hot, gaseous accretion disk in WZ Sge. This dust ring lies inside the binary within the Roche lobe of the white dwarf. Our best model suggests that the dust ring contains g of material, modeled as 1 micron spherical dust grains with density of 3 g cm-3 (silicate). Reasonable changes to the total mass of dust and/or the grain size and density can be balanced by adjusting the other parameters to produce equivalent model spectral energy distributions. The dust torus is optically thin and unseen in optical and near-IR bandpasses because of its low temperature and particle density, thus consisting of “dark matter”. The dust ring is believed to extend from beyond the outer edge of the gaseous accretion disk to , and to have a temperature profile that declines from 1460 K to 690 K.
This discovery was a complete surprise as it seems counter-intuitive to expect dust so close to a relatively hot star (i.e., the 13,000 K white dwarf). We do know, however, that observations have shown that dust exists in the colliding winds of hot (20,000 K to 50,000 K) Wolf-Rayet stars only a few tens of AU from their surfaces (Pittand & Dougherty 2006; Tuthill & Monnier 2008). The apparently high density of material formed at the shock regions allows for efficient shielding of the highly energetic photons that would otherwise destroy the dust grains. Perhaps the accretion disk contains a high enough outer disk density and a cool enough outer disk temperature to provide a shield against destruction of the dust by UV photons. Evidence for such outer accretion disk conditions has been observed for WZ Sge in the past in terms of the detection of CO and H2 emission from the accretion disk (Howell et al. 2004).
Our discovery of circumbinary dust disks in polars (Howell et al. 2006, Brinkworth et al. 2007, Hoard et al. 2007) may suggest that all interacting binaries have such material. However, if such a circumbinary dust disk existed in WZ Sge with similar emission properties as those we observed in polars of nearly equal orbital period, then it would have dominated the mid-IR flux distribution in WZ Sge. One important implication of that scenario is that we would not have observed a deep (or possibly any) mid-IR eclipse. The presence of the prominent mid-IR eclipse at both 4.5 and 8.0 microns argues that the dust must be inside the binary. In addition, owing to the much larger surface area of a circumbinary disk, the mid-IR flux distribution in WZ Sge would have been much brighter in comparison to its optical and near-IR flux densities (e.g., as observed for EF Eri, see Hoard et al. 2007) if the dust in WZ Sge was circumbinary instead of circumstellar.
The origin of the dust is a subject of debate. One possibility is that accretion disk material ejected during outburst or superoutburst can become dense enough in shocked regions associated with the outburst to both form dust and provide shielding from destruction by UV photons for some time period. Material that did not reach escape velocity would fall back in toward the white dwarf where its angular momentum would form it into a disk. WZ Sge had its most recent superoutburst in 2001 and if the dust formation is associated with such events, reobservation at mid-IR wavelengths over time may show a change (decrease) in the dust disk. Dust may also form in the atmosphere of the cool brown dwarf-like secondary star and be transferred to the white dwarf via the inner Lagrange point. As it sublimates, most of it becomes part of the gaseous accretion disk but any grains that remain may be the formation particles of the dust disk. Finally, we know of the discovery by the Spitzer Space Telescope of dust disks around isolated white dwarfs (e. g., Garcia-Berro et al. 2007). These disks are believed to be the remains of progenitor solar systems and are replenished by the infall and breakup of cometary or Kuiper belt objects. This mechanism may be true in WZ Sge as well, albeit complicated by the binary nature of the system.
The gaseous accretion disk will behave like an accretion disk and be replenished from the (gaseous) matter stream from the L1 point. But the dust ring does not act like an accretion disk (i.e., no viscous interactions), it acts more like the rings of Saturn. There certainly could be (and probably is) some tenuous “grey zone” between the gaseous accretion disk and the dust ring, that is part gas and part dust (and dust precursors). How long might such dust last if its only destruction mechanism is to spiral in close to the white dwarf via the Poynting-Robertson effect and be destroyed through sublimation? The spiral in time for a (spherical) dust grain is given by the expression (Rybicki & Lightman 1979),
where is the grain density, is the luminosity of the white dwarf, is the grain radius, and is the radius of the initial orbital location. As the grain spirals in toward the white dwarf, it is assumed that the orbit is always circular. For the solar system, a one micron dust particle orbiting at 1 AU requires about 1000 years to spiral in and sublimate due to Poynting-Robertson drag. In the WZ Sge system, we ignore the partial shadowing of the white dwarf by the accretion disk, a fact that in reality would lower the effective value of and increase the spiral in time; . For WZ Sge’s dust disk, assuming 1 micron grains, = 3 g cm-3, and is, on average, 15 RWD, Poynting-Robertson drag will spiral the dust into the gaseous disk causing grains to evaporate, in 0.87 years. The source of the dust in the intra-binary dust disk must therefore replenish itself approximately yearly. This short time scale would seem to eliminate the possibility that the dust forms only via ejected material during superoutburst, the last being 6 years prior to our observations. However, the mass transfer rate for WZ Sge’s donor star is 10-12 M⊙ yr-1, while our dust disk mass estimate is 10-16 M⊙, only 1/10,000 of the mass loss rate each year. Thus, it appears that the dust torus can easily be replenished continuously by a small amount of dusty material transferred from the cool brown dwarf-like secondary star. Other than Poynting-Robertson drag, the dust ring should be fairly static.
Further study is required to determine if all cataclysmic variables have dark matter in the form of a greatly extended dust disk surrounding the gaseous accretion disk. Certainly in cases where the white dwarf is very hot (e.g., 40,000–50,000 K as found in some novalike CVs), the temperature everywhere inside its Roche lobe is likely to be formally too high for dust to exist. However, even in these cases, shielding by the gaseous accretion disk might still allow some dust to survive inside the white dwarf Roche lobe. Temporal study would be helpful as well to aid in the determination of the origin of the dust. For any accretion disks that do have a similar dust ring surrounding them, measurements attributed solely to the flux of the central object at mid-IR wavelengths may need to be reexamined. In the case of WZ Sge, attributing our measured mid-IR flux densities to the white dwarf, secondary star, and accretion disk would have overestimated their contributions by a factor of 2–3. If all accretion disks are complicated by the presence of previously unsuspected “dark matter” in the form of cool dust, then this could have important implications for the development of disk models, accounting for the full energy budget of accreting systems, and the determination of bolometric (integrated) luminosities of the components in systems ranging from pre-main sequence stars to active galaxies and quasars.
References
- Baer & Chesley (2008) Baer, J., & Chesley, S. R. 2008, Celestial Mechanics and Dynamical Astronomy, 100, 27
- Belle et al. (2005) Belle, K., Howell, S. B., Mukai, K., et al., 2005, AJ, 129, 1985
- Brinkworth et al. (2007) Brinkworth, C. S., Hoard, D. W., Wachter, S., Howell, S. B., Ciardi, D., et al., 2007 ApJ, 659, 1541
- Ciardi et al. (1998) Ciardi, D. R., Howell, S. B., Hauschildt, p., & Allard, F., 1998, ApJ, 504, 450
- Cohen et al. (2003) Cohen, M., Wheaton, W. A., & Megeath, S. T. 2003, AJ, 126, 1090
- Collins et al. (1998) Collins, T. J. B., Helfer, H. L., & Van Horn, H. M. 1998, ApJ, 502, 730
- Cox (2000) Cox, A. N. 2000, in Allen’s Astrophysical Quantities, 4th ed. (New York: Springer-Verlag), p. 387
- Frank, King, & Raine (2002) Frank, J., King, A., & Raine, D. 2002, in Accretion Power in Astrophysics (Cambridge: Cambridge University Press), Ch. 5
- GAR (2007) Garcia-Berro, E., et al., 2007, ASPC, 372, 321
- Gilliland et al. (1986) Gilliland, R. L., Kemper, E., & Suntzeff, N. 1986, ApJ, 301, 252
- Godon et al. (2006) Godon, P., Sion, E. M., Cheng, F., Long, K. S., Gänsicke, B. T., & Szkody, P. 2006, ApJ, 642, 1018
- Harrison et al. (2004) Harrison, T. E., Johnson, J. J., McArthur, B. E., Benedict, G. F., Szkody, P., Howell, S. B., & Gelino, D. M. 2004, AJ, 127, 460
- Henden & (1997) Henden, A. A., & Honeycutt, R. K. 1997, PASP, 109, 441
- Henden & Landolt (2001) Henden, A. A., & Landolt, A. U. 2001, IBVS, 5166, 1
- Hoard et al. (2008) Hoard, D. W., et al., 2008, ApJ, submitted
- Hoard et al. (2007) Hoard, D. W., Howell, S. B., Brinkworth, C. S., Ciardi, D. R., & Wachter, S. 2007, ApJ, 671, 734
- Howell et al. (1995) Howell, S. B., Walter, F., Harrison, T. E., et al., 2006, ApJ, 652, 709
- Howell et al. (1995) Howell, S. B., Harrison, T. E., & Szkody, P., 2004, ApJ, 602, L49
- Howell et al. (1995) Howell, S. B., Szkody, P., & Cannizzo, J. K. 1995, ApJ, 439, 337
- Howell et al. (2000) Howell, S. B., Brinkworth, C., Hoard, D. W., Wachter, S., Harrison, T., et al., 2006 ApJ, 646, 65
- Mason et al. (2000) Mason, E., Skidmore, W., Howell, S. B., Ciardi, D. R., Littlefair, S., & Dhillon, V. S. 2000, MNRAS, 318, 440
- Patten et al. (2006) Patten, B. M., et al. 2006, ApJ, 651, 502
- Patt et al. (2006) Patterson, J.,Richman, H., Kemp, J, & Mukai, K., 1998, PASP, 110, 403
- Pritt et al. (2006) Pittand, J. M., & Dougherty, S. M., 2006, MNRAS, 372, 801
- Puebla et al. (2007) Puebla, R. E., Diaz, M. P., & Hubeny, I. 2007, AJ, 134, 1923
- RL (1979) Rybicki, G. B., & Lightman, A. P., 1979, “Radiative Processes in Astrophysics”, John Wiley and Sons, p. 153
- Skidmore et al. (1997) Skidmore, W., Welsh, W. F., Wood, J. H., & Stiening, R. F. 1997, MNRAS, 288, 189
- Skidmore et al. (2000) Skidmore, W., Mason, E., Howell, S. B., Ciardi, D. R., Littlefair, S., & Dhillon, V. S. 2000, MNRAS, 318, 429
- Spruit & Rutten (1998) Spruit, H. C., & Rutten, R. G. M. 1998, MNRAS, 299, 768
- Steeghs et al. (2007) Steeghs, D., Howell, S. B., Knigge, C., Gänsicke, B. T., Sion, E. M., & Welsh, W. F. 2007, ApJ, 667, 442
- Steeghs et al. (2001) Steeghs, D., Marsh, T., Knigge, C., Maxted, P. F. L., Kuulkers, E., & Skidmore, W. 2001, ApJ, 562, L145
- tut (08) Tuthill, P. G., & Monnier, J. D., 2008, ApJ, 675, 698
- Warner (1995) Warner, B., 1995, ”Cataclysmic Variables”, Chp. 2, Cambridge University Press
| UT Date | Telescope | Type | Bandpass |
|---|---|---|---|
| 2007 June 26-29 | KPNO 0.9-m | Phot | B,R |
| 2007 June 3 | KPNO 4-m | Spec | 3800-5000 |
| 2007 June 26-29 | KPNO 2.1-m | Spec | 4000-7000 |
| 2007 July 3 | Spitzer/IRAC | Phot | 4.5 & 8.0 m |
| 2007 July 3-5 | CTIO 4-m | Spec | 4000-7600 |
| 2007 August 7 | SMARTS/0.9-m | Phot | R, Ks |
| UT Date | J | H | K | Ref |
|---|---|---|---|---|
| 1996 Sept. 23 | 14.20.2 | 13.80.2 | 13.30.2 | Ciardi et al., (1998) |
| 1998 Oct. 2 | 14.8770.039 | 14.5350.051 | 14.0190.059 | Hoard et al. (2002) |
| 2007 Aug. 7 | – | – | 14.050.21 | this paper |
| Date | line | FWHM |
|---|---|---|
| 2007-07-02 | H | 16.52 |
| 17.88 | ||
| H | 12.43 | |
| 13.59 | ||
| 2007-07-03 | H | 18.69 |
| 17.16 | ||
| H | 13.98 | |
| 13.12 | ||
| 2007-07-04 | H | 17.79 |
| 17.54 | ||
| H | 13.73 | |
| 13.20 |
| Band | Wavelength | Flux Density | Date Obtained |
|---|---|---|---|
| (microns) | (mJy) | (UT) | |
| UV | 10 Jul 2004 | ||
| B | 27–28 Jun 2007 | ||
| R | 27–28 Jun 2007 | ||
| 2MASS-J | 23 Sep 1998 | ||
| 2MASS-H | 23 Sep 1998 | ||
| 2MASS-Ks | 23 Sep 1998 | ||
| IRAC-2 | 4 Jul 2007 | ||
| IRAC-4 | 4 Jul 2007 |
| Component | Parameter | Value | “Good” Range | Source |
|---|---|---|---|---|
| System: | Inclination, (∘) | 77(2) | Spruit & Rutten (1998) | |
| Orbital Period, (d) | 0.05668784740(28) | Skidmore et al. (1997) | ||
| Distance, (pc) | 43.5(3) | Harrison et al. (2004) | ||
| WD: | Temperature, (K) | 13,000 | Godon et al. (2006) | |
| Mass, () | 0.88 | Steeghs et al. (2007) | ||
| Radius, (cm) | Steeghs et al. (2007) | |||
| SS: | Spectral Type | L5.0 | L5 or later | Steeghs et al. (2007) |
| Mass, () | 0.078 | Steeghs et al. (2007) | ||
| ACD: | Mass Transfer Rate, Ṁ ( yr-1) | – | this work | |
| Maximum Temperature, (K) | 9200 | 8300–9900 | this work | |
| Inner Radius, () | 1.0 | this work | ||
| Outer Radius, () | 2.5 | 2–4 | this work | |
| CSD: | Optical Depth Prescription | thin | this work | |
| Temperature Profile Exponent | 0.75 | this work | ||
| Constant Height, () | 0.1 | this work | ||
| Grain Density, (g cm-3) | 3.0 | this work | ||
| Grain Radius, (m) | 1 | this work | ||
| Inner Radius, () | 11 | 7.5–15 | this work | |
| Outer Radius, () | 30 | 20–40 | this work | |
| Inner Temperature, (K) | 1460 | 1150–2000 | this work | |
| Outer Temperature, (K) | 690 | 550–930 | this work | |
| Total Mass, ( g) | 2.94 | 1.8–7.0 | this work |