11email: vlahakis@strw.leidenuniv.nl 22institutetext: Sterrenkundig Observatorium, Universiteit Gent, Krijgslaan 281 S9, 9000 Gent, Belgium 33institutetext: Astrophysics Group, Imperial College, Blackett Laboratory, Prince Consort Road, London SW7 2AZ, UK 44institutetext: ESO, Casilla 19001, Santiago 19, Chile
LABOCA and MAMBO-2 imaging of the dust ring of the Sombrero galaxy (NGC 4594) ††thanks: This publication is based on data acquired with the IRAM 30m telescope and the Atacama Pathfinder Experiment (APEX). APEX is a collaboration between the Max-Planck-Institut fur Radioastronomie, the European Southern Observatory, and the Onsala Space Observatory.
The Sombrero galaxy (NGC 4594) is an Sa galaxy with a symmetric dust ring. We have used the Large APEX BOlometer CAmera (LABOCA) at 870 µm and the MAx-Planck Millimeter BOlometer (MAMBO-2) at 1.2 mm to detect the dust ring for the first time at submillimetre and millimetre wavelengths. We have constructed a model of the galaxy to separate the active galactic nucleus (AGN) and dust ring components. The ring radius at both 870 µm and 1.2 mm agrees well with the radius determined from optical absorption and atomic gas studies. The spectral energy distribution of the ring is well fitted by a single grey-body with dust emissivity index and a dust temperature =18.4 K. The dust mass of the ring is found to be which, for a Galactic gas-to-dust ratio, implies a gas mass that is consistent with measurements from the literature.
Key Words.:
galaxies: active – galaxies: individual (NGC 4594) – galaxies: ISM – galaxies: nuclei – submillimeter – dust, extinction1 Introduction
The Sombrero galaxy is one of the best studied early-type spiral galaxies. It is an Sa galaxy with a prominent dust lane, which is actually a symmetric dust ring seen nearly edge-on, and a nucleus that hosts a supermassive black hole (Kormendy et al. 1996). These two features are the highest surface brightness infrared sources in the galaxy Bendo et al. 2006a, hereafter B06. At a distance of 9.4 Mpc (the average of measurements from Ford et al. 1996 and Tonry et al. 2001), it is an ideal laboratory for investigating different astrophysical processes, in particular, the connection between star formation and an active galactic nucleus (AGN) and the effects of these mechanisms on nuclear and global galaxy properties. The galaxy is also ideal for studying the separate spectral energy distributions (SEDs) of diffuse interstellar dust and the dust heated by an AGN, since the majority of diffuse dust is located in a ring relatively far from the AGN, making it thus relatively simple to model either component (B06).
Until recently, investigation of this galaxy in the far-infrared (FIR) and submillimetre (submm) (e.g. Rice et al. 1998; Krause et al. 2006) was limited to the global SED due to the resolution of IRAS. B06 investigated the mid- and far-infrared SED of the separate components using Spitzer (3.6–160 µm) and SCUBA (850 µm) observations. However, only the AGN component was detected with SCUBA, and the SCUBA map covered only , while the diameter of the dust ring as seen by Spitzer measures 5′ (B06).
We present observations of the Sombrero galaxy (NGC 4594) at 870 µm with the Large APEX BOlometer CAmera (LABOCA; Kreysa et al. 2003; Siringo et al. 2007) and at 1.2 mm with the MAx-Planck Millimeter BOlometer (MAMBO-2; Kreysa et al. 1998). In order to separately examine the dust ring and the AGN, we have modelled the dust emission using the method described in B06. We present the first results from this analysis, and focus on the FIR/submm emission from the dust ring. Investigation of the FIR/submm emission from the nucleus will be the subject of a separate paper (Vlahakis et al. in prep.).
2 Observations and Data Reduction
The 870 µm data were taken with the newly commissioned LABOCA bolometer array, located on the Atacama Pathfinder EXperiment (APEX) telescope on Chajnantor, Chile, during its science verification phase in May 2007. The full width half maximum (FWHM) of the point spread function (PSF) at 870 µm is 19″. The observations were carried out using a raster-spiral observing mode (Weiss et al. 2007) in which each scan consists of 4 spiral pointings offset by 27″, each spiral providing a fully sampled map of the full field of view (FOV) of LABOCA (11.4′). The total map thus covers an area slightly larger than the FOV. The total on-source integration time was 40 minutes, reaching an rms level of 8 mJy beam-1 in the unsmoothed map. We reduced the data with the BoA111http://www.astro.uni-bonn.de/boawiki/Boa software package. The data reduction process included correction for atmospheric zenith opacity (opacity, , values ranged from 0.2 to 0.3), flat-fielding, despiking, correlated sky noise removal, and the removal of further correlated noise due to instrumental effects. The data were calibrated using observations of Mars and Uranus. The uncertainty due to calibration is the main source of uncertainty, and is estimated to be 10%. For presentation purposes, we smoothed the final map to a resolution of 22″ by convolving it with a Gaussian.
We carried out the 1.2 mm observations with the MAMBO-2 117-element bolometer array on the 30m telescope on Pico Veleta, Spain, during the pooled observing sessions in December 2006 and March 2007. The FWHM of the PSF at 1.2 mm is 11″. We used a standard on-the-fly mapping technique and a wobbler switching mode with a chop throw of 240″ to map an area of . The total integration time was 96 minutes, reaching an rms of 3 mJy beam-1 in the unsmoothed map. Opacity () values ranged from 0.1 to 0.3, while the sky noise was consistently low. We reduced the data using standard methods in MOPSIC, part of the GILDAS software package. This included correction for atmospheric opacity, flat-fielding, despiking, and removing correlated sky noise. The data were calibrated using observations of standard calibration sources, resulting in a calibration uncertainty of 15%. For presentation purposes, we smoothed the final map to a resolution of 15″ by convolving it with a Gaussian.
3 Results
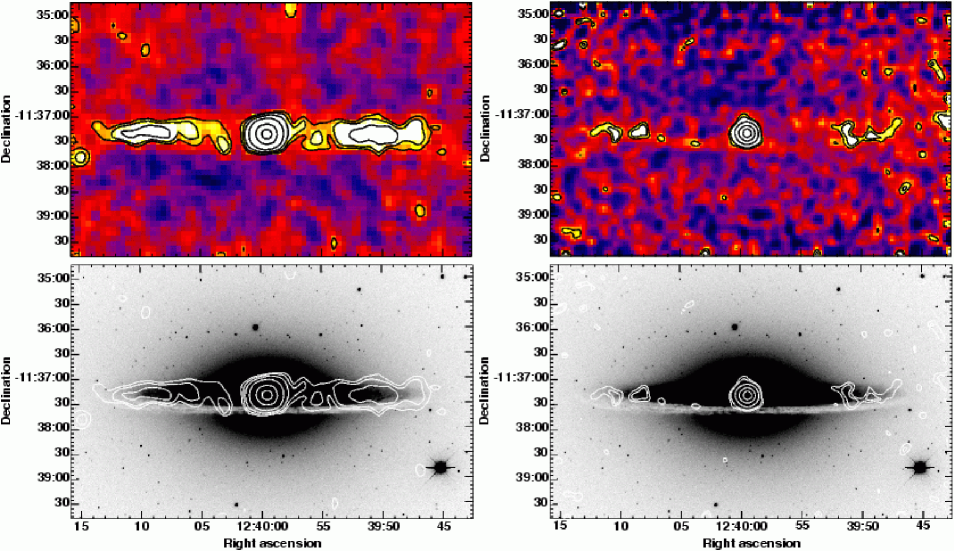
The 870 µm LABOCA image and the 1.2 mm MAMBO-2 image are shown in Fig. 1. Contours showing levels of equal flux density are overlaid onto the images. These same contours are also shown overlaid onto an optical B-band image (from the Spitzer Infrared Nearby Galaxies Survey (SINGS) Legacy Data; Kennicutt et al. 2003). The dust ring and the nucleus are clearly detected in the LABOCA map. While the nucleus was detected previously at 850 µm with SCUBA and at 870 µm with the Heinrich Hertz Telescope (B06; Krause et al. 2006, respectively), here the dust ring is detected for the first time at submm wavelengths. The dust ring and nucleus are also detected in the MAMBO-2 map. In both the submm and mm images, there is no evidence of dust outside the ring or outside the plane of the ring, and we do not detect any substructure in the ring at this signal-to-noise level.
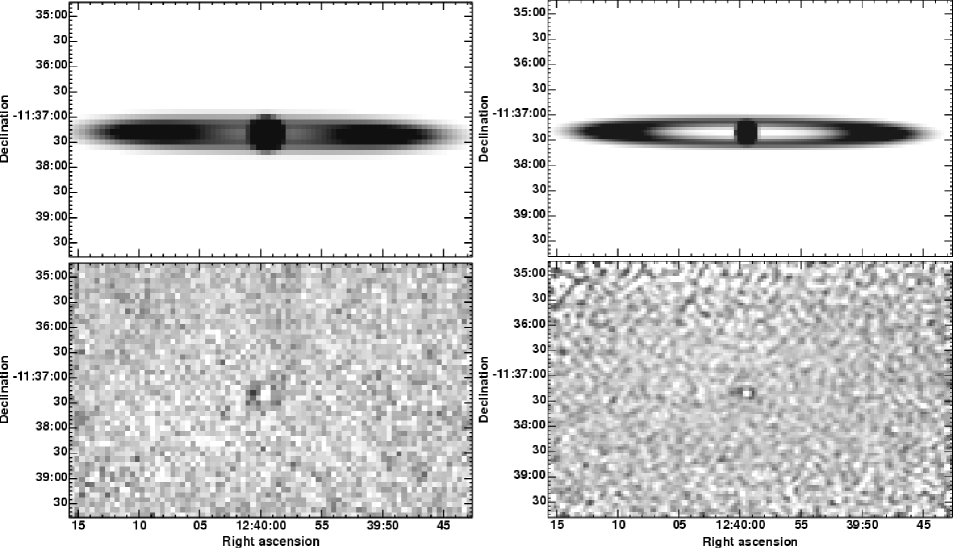
In order to separate the nuclear and ring components, we fitted a model to the unsmoothed data using the method described in B06. To summarise this method, the model consists of two components, a Gaussian ring and a central point source, which were convolved with a Gaussian PSF with a FWHM equivalent to that for LABOCA and MAMBO-2; the fit was performed over a region corresponding to the optical disk. The image models are shown in Fig. 2 together with the residuals from the model fits.
The 870 µm and 1.2 mm flux densities for the two components are given in Table 1, together with the global flux density. The uncertainties given are those resulting from the model fitting process, while the largest source of uncertainly comes from the calibration. We note that the 870 µm flux density we find for the nucleus is in excellent agreement with previous submm observations B06; Krause et al. 2006, which are listed in Table 1 for comparison. The ring model parameters are given in Table 2, along with the parameters determined from the 5.7–70 µm data by B06.
We have fitted a modified Planck function (‘grey-body’) to the 70 µm–1.2 mm SED of the dust ring, using the 70- and 160- µm Spitzer measurements from B06 and our 870- µm and 1.2 mm measurements from Table 1. In this fit, the Planck function was modified by a emissivity function with dust emissivity index =2, and the dust temperature was allowed to vary. The SED of the dust ring is found to be well fitted by a single grey-body with =18.4 K (Fig. 3).
| Flux density (Jy) | |||
| Wavelength | |||
| ( µm) | Global | Nucleus/AGN | Ring |
| 1200 | 0.442 | 0.1850.002222Uncertainties are from the fits to the data and do not include calibration uncertainties (see Section 2). | 0.2570.006 |
| 870 | 0.924 | 0.2420.003\footreffn:uncert | 0.6820.016 |
| 870 | … | 0.2300.035333Previous submm measurements B06; Krause et al. 2006. | … |
| 850 | … | 0.250.06\footreffn:comp | … |
| Parameter444Definitions of the parameters are as given by B06. | 1.2 mm | 870 µm | 5.7–70 µm555Values from B06. |
|---|---|---|---|
| Min/Maj axis ratio | 0.07570.0014 | 0.07100.0013 | 0.09900.0015 |
| Position angle | 90.430.04∘ | 90.690.09∘ | 89.250.06∘ |
| Ring radius | 169.9″1.0″ | 162.0″3.0″ | 144.7″0.5″ |
| Ring width | 33.0″2.0″ | 45.7″0.6″ | 22.9″1.1″ |
We estimate the dust mass of the ring with
| (1) |
where is the 870 µm flux density; D is the distance (9.4 Mpc); is the Planck function for the fitted temperature ; and is the dust mass opacity coefficient at 870 µm. Assuming a value m2 kg-1 (Li & Draine 2001), we obtain . Here, the uncertainty is derived from the uncertainty on the 870 µm flux density, which is the main source of uncertainty for the measured parameters. We note, however, that a potentially larger source of uncertainty could arise due to the value of , which is notoriously uncertain.

4 Discussion
The dust ring detected at 870 µm and at 1.2 mm is wider than the dust ring detected at 5.7–70 µm. This indicates that the dust ring is not monochromatic; the dust on the inside of the ring is warmer and radiates primarily at shorter wavelengths than the dust on the outside. This interpretation is consistent with the dust temperature gradient suggested by the analysis of dust opacity measurements presented by Emsellem (1995). These results imply that the primary heating sources for the ring are located on the inside of the ring.
The 170″ radius of the dust ring found at 870 µm and 1.2 mm is consistent with the outermost of two rings determined in optical absorption (e.g., Dettmar 1986; Wainscoat et al. 1990; Emsellem 1995) and neutral hydrogen (Hi) emission (Bajaja et al. 1984). The 5.7–70 µm dust, molecular gas, radio synchrotron emission, and part of the neutral hydrogen (Hi) emission lies in a 140″ ring (Bajaja et al. 1988, 1991; Krause et al. 2006). This ring is consistent with the innermost of the two rings detected in optical absorption. Thus, it appears that emission from wavebands more commonly associated with star formation originates from the 140″ ring whereas ‘quiescent’ dust and gas emission, not necessarily associated with star formation, originates from the 170″ ring.
The 1.2 mm data point is useful for constraining the Rayleigh-Jeans (RJ) tail of the SED, yet we note that the 70-, 160-, and 870- µm data alone are also well fitted by this grey-body. This result is in contrast with Galliano et al. (2005) and Bendo et al. (2006b), who found that the RJ side of the SED deviates from thermal dust emission at wavelengths longer than 850 µm.
The dust mass we calculated from our measured 870 µm flux density and fitted dust temperature is about a factor of two higher than the dust mass estimated from optical absorption by Emsellem (1995) (8.3 , scaled to 9.4 Mpc). Part of this discrepancy can probably be explained if there is an inconsistency between the dust opacity model used by Emsellem (1995) and the Li & Draine (2001) model. Our estimated dust mass is also a factor of two higher than found by B06 using the FIR measurements alone. This is not surprising, since the RJ part of the SED, which is sampled at the LABOCA and MAMBO-2 wavelengths, is more sensitive to the mass of dust and less sensitive to temperature. Draine et al. (2007) comment that the models used in B06 to estimate dust masses are only accurate to within a factor of 1.5 when no submm data are available. Thus, the additional submm/mm data points are needed to better trace the bulk of the dust mass.
Adopting a Galactic gas-to-dust ratio (165; Li 2005), our dust mass implies a total gas mass of 2.6 . We can compare this value to the total (molecular + atomic) gas mass using measurements from the literature. Bajaja et al. (1984) find an Hi mass of 3.3 (scaled to our adopted distance of 9.4 Mpc). Preliminary results from Sengupta et al. (2003) are in good agreement with this value. Bajaja et al. (1991) used their detection of CO at one position in the ring to estimate an upper limit to the molecular gas mass of 4.6 (scaled to 9.4 Mpc), though they note that this value could be uncertain by up to a factor of five. Thus, the total gas mass implied by our dust mass is consistent with measurements of the total (molecular + atomic) gas mass.
5 Conclusions
We have observed the Sombrero galaxy (NGC 4594) at 870 µm with the LABOCA bolometer camera at the APEX telescope and at 1.2 mm with the MAMBO-2 bolometer array at the IRAM 30m telescope.
We have detected the dust ring for the first time at submm and mm wavelengths. We have constructed a model of the galaxy to separate the AGN and dust ring components. The ring radius at both 870 µm and 1.2 mm agrees well with the radius determined from optical absorption and atomic gas studies.
We find that the 70 µm–1.2 mm SED of the dust ring is well fitted by a single grey-body with =2 and a dust temperature =18.4 K. Using this dust temperature we find the ring to have a dust mass of . For a Galactic gas-to-dust ratio, our estimated dust mass implies a gas mass that is consistent with measurements from the literature.
Acknowledgements.
Thanks go to Alexandre Beelen, Frederic Schuller, and Axel Weiss for useful discussions about BoA data reduction, and to the anonymous referee for helpful comments. We are also grateful to the staff at the IRAM 30m telescope and the APEX telescope for their support with the observations.References
- Bajaja et al. (1984) Bajaja, E., van der Burg, G., Faber, S. M., et al. 1984, A&A, 141, 309
- Bajaja et al. (1988) Bajaja, E., Dettmar, R.-J., Hummel E., & Wielebinski, R. 1988, A&A, 202, 35
- Bajaja et al. (1991) Bajaja, E., Krause, M., Dettmar, R.-J., Wielebinski, R. 1991, A&A, 241, 411
- Bendo et al. (2006a) Bendo, G. J. et al. 2006a, ApJ, 645, 134 (B06)
- Bendo et al. (2006b) Bendo, G. J. et al. 2006b, ApJ, 652, 283
- Dettmar (1986) Dettmar, R. 1986, Ph.D. Thesis, University of Bonn
- Draine et al. (2007) Draine, B. et al. 2007, ApJ, 663, 866
- Emsellem (1995) Emsellem, E. 1995, A&A, 303, 673
- Ford et al. (1996) Ford, H. C., Hui, X., Ciardullo, R., Jacoby, G. H., & Freeman, K. C. 1996, ApJ, 458, 455
- Galliano et al. (2005) Galliano, F. et al. 2005, A&A, 434, 867
- Kennicutt et al. (2003) Kennicutt, R. C., Jr., et al. 2003, PASP, 115, 928
- Krause et al. (2006) Krause, M., Wielebinski, R., & Dumke, M. 2006, A&A, 448, 133
- Kreysa et al. (1998) Kreysa, E., Gemuend, H., Gromke, J. et al. 1998, Proc. SPIE, 3357, 319
- Kreysa et al. (2003) Kreysa, E. et al. 2003, Proc. SPIE, 4855, 41
- Kormendy et al. (1996) Kormendy, J. et al. 1996, ApJ, 473, L91
- Li (2005) Li A. 2005, in Penetrating Bars through Masks of Cosmic Dust, ed. D. L. Block et al. (Springer), 535 (astro-ph/0503571)
- Li & Draine (2001) Li, A., & Draine, B. T. 2001, ApJ, 554, 778
- Rice et al. (1998) Rice, W., Lonsdale, C. J., Soifer, B. T., et al. 1988, ApJS, 68, 91
- Sengupta et al. (2003) Sengupta C., Balasubramanyam R., & Bekki K. 2003, BASI, 31, 419
- Siringo et al. (2007) Siringo, G., Weiss, A., Kreysa, E., et al. 2007, The Messenger, 129, 2
- Tonry et al. (2001) Tonry J. L., Dressler A., Blakeslee J.P. et al. 2001, ApJ, 546 681
- Wainscoat et al. (1990) Wainscoat, R. J., Hyland, A. R., & Freeman, K. C. 1990, ApJ, 348, 85
- Weiss et al. (2007) Weiss, A., Siringo, G., Kreysa, E., Kóvacs, A., & Schuller, F. 2007, LABOCA Commissioning Report