High precision microlensing maps of the Galactic bulge
Abstract
We present detailed maps of the microlensing optical depth and event density over an area of 195 deg2 towards the Galactic bulge. The maps are computed from synthetic stellar catalogues generated from the \bes Galaxy Model, which comprises four stellar populations and a three-dimensional extinction map calibrated against the Two-Micron All-Sky Survey. The optical depth maps have a resolution of 15 arcminutes, corresponding to the angular resolution of the extinction map. We compute optical depth and event density maps for all resolved sources above , for unresolved (difference image) sources magnified above this limit, and for bright standard candle sources in the bulge. We show that the resulting optical depth contours are dominated by extinction effects, exhibiting fine structure in stark contrast to previous theoretical optical depth maps. Optical depth comparisons between Galactic models and optical microlensing survey measurements cannot safely ignore extinction or assume it to be smooth. We show how the event distribution for hypothetical and -band microlensing surveys, using existing ground-based facilities such as VISTA, UKIRT or CFHT, would be much less affected by extinction, especially in the band. The near infrared provides a substantial sensitivity increase over current -band surveys and a more faithful tracer of the underlying stellar distribution, something which upcoming variability surveys such as VVV will be able to exploit. Synthetic population models offer a promising way forward to fully exploit large microlensing datasets for Galactic structure studies.
keywords:
gravitational lensing – stars: statistics – Galaxy: bulge – Galaxy: structure1 Introduction
Several microlensing survey teams have been monitoring millions of stars over a large region of the Galactic bulge for more than a decade (Sumi et al., 2003; Popowski et al., 2005; Sumi et al., 2006; Hamadache et al., 2006). These surveys have detected thousands of events and the combined detection rate of the OGLE-III and MOA-II surveys is currently around 800 unique events per year. The microlensing optical depth, that is the instantaneous number of ongoing microlensing events per source star, is a key measurable for these surveys and provides an important constraint on the bulge surface mass density. Its dependence upon direction provides, in principle, a powerful probe of the three-dimensional geometry of the bulge stellar mass distribution.
To date several measurements have been made of the optical depth along different directions. The MOA survey (Sumi et al., 2003) find an optical depth from difference image analysis (DIA) of 28 events of for bulge and disc sources around Baade’s Window . Most recent measurements of the optical depth have been based upon a restricted subset of red clump giant (RCG) stars, which act approximately as standard candles and are known to be confined to the bulge. From a sample of 42 RCG events the MACHO collaboration (Popowski et al., 2005) measures a standard candle optical depth of at . The OGLE-II survey (Sumi et al., 2006) reports a value of determined from 32 RCG events in the direction . The largest single sample analysed to date involves 120 RCG events obtained by the EROS-2 experiment (Hamadache et al., 2006), from which it measured the optical depth over a large region, including within . EROS-2 also reports an optical depth gradient with latitude of deg-1 at , in line with similar gradient determinations by MACHO and OGLE-II.
Despite initial disagreement, optical depth measurements from RCG sources are now largely in accord with recent theoretical models (Evans & Belokurov, 2002; Han & Gould, 2003; Wood & Mao, 2005) and support the existence of a bar-like bulge which is oriented from the Sun—Galactic Centre line. However RCG events represent less than 10% of all bulge microlensing events. A major limitation to the study of the remaining events comes from the current simplicity of theoretical models. A fully developed model must account for the line of sight distribution of the sources in both the disc and bulge components. This distribution is a function not only of the underlying density models but also of the experimental sensitivity, the source luminosity function and the distribution of dust. The latter factor is particularly problematic for studies of the spatial distribution of events since extinction varies strongly with sky position. Until recently realistic three dimensional extinction maps were unavailable.
In this paper we present the first microlensing optical depth maps to incorporate a realistic three-dimensional extinction map. The map was developed by Marshall et al. (2006) as part of the \bes Galaxy Model (Robin, Reylé, Derrière & Picaud, 2003). In Section 2 we briefly overview the \bes Model including how the three-dimensional dust map was generated. In Section 3 we describe how we set up the optical depth calculations. In Section 4 we present maps of optical depth and of event density for current -band microlensing surveys, as well as for a hypothetical near-infrared survey which, as we show, would be much less affected by dust. We end with a discussion in Section 5.
2 The Besançon Galaxy Model
The \bes Galaxy Model is a simulation tool aimed at testing galaxy evolution scenarios by comparing stellar distributions predicted by these scenarios with observational constraints, such as photometric star counts and kinematics. A complete description of the model ingredients can be found in Robin, Reylé, Derrière & Picaud (2003). The model assumes that the Sun is at a Galactocentric distance kpc. We summarise here the model’s principal features which are relevant to the present analysis. In particular, we do not discuss the details of the kinematics and metallicity of each population as the microlensing optical depth does not depend on them.
2.1 Stellar populations
The model assumes that stars are created from gas following a star formation history and an initial mass function; stellar evolution follows evolutionary tracks. To reproduce the overall galaxy formation and evolution we distinguish four populations of different ages and star formation history.
-
•
The spheroid population is described in Robin, Reylé & Crézé (2000) as a single burst population of age 14 Gyr. Its density in the central regions is small compared to other populations and it is therefore only a marginal contributor to the optical depth.
-
•
The thick disc is formed from stars born about 11-12 Gyr ago in a short period of time as implied by recent metallicity determinations for this population. We also assume a single burst for simplicity. For the thick disc, star formation occurred from the gas already settled in the disc. Kinematics, deduced from observational constraints (Ojha et al., 1996; Ojha, Bienaymé, Mohan & Robin, 1999), imply that it has undergone a merging event shortly after the disc formation (Robin et al., 1996), increasing the disc thickness and giving a higher velocity dispersion and scale height. The initial mass function (IMF), density distribution and local normalisation are constrained from star counts (Reylé & Robin, 2001).
-
•
The bulge population is present in the centre of the Galaxy and extends to about 3-4 kpc. Its age is around 10 Gyr. The population is modeled from Bruzual & Charlot (2003) population synthesis, as a single burst and a Salpeter IMF. This population reflects a triaxial bar distribution, as determined by Picaud & Robin (2004) from near-infrared star counts. The angle of the major axis of the bulge with the sun-Galactic Centre axis is found to be . The scale lengths are 1.590 kpc, 0.424 kpc and 0.424 kpc. The total bulge mass is .
-
•
For the thin disc a standard evolutionary model is used to compute the disc population, comprising an IMF, a star formation rate (SFR) and a set of evolutionary tracks, as described in Haywood, Robin, & Crézé (1997b) and references therein. The disc population is assumed to evolve during 10 Gyr, with multiple periods of star formation creating seven distinct age populations. A set of IMF slopes and SFRs are tentatively assumed and then tested against star counts. The tuning of disc parameters against relevant observational data has been described in Haywood, Robin, & Crézé (1997a, b). A revised IMF has been adjusted to agree with the most recent Hipparcos results: the age-velocity dispersion relation is from Gomez et al. (1997), the local luminosity function from Jahreiß & Wielen (1997), giving an IMF slope = 1.5 in the low mass range (0.5-0.08 M☉), in good agreement with Kroupa (2001). The scale height has been computed self-consistently using the potential via the Boltzmann equation. The local dynamical mass is taken from Crézé et al. (1998).
Stellar remnants are also included in the model, though their role in the optical depth analysis is only indirect in contributing to the overall mass of lensing stars and in limiting the overall mass normalisation for visible stars which act as microlens sources; the microlensing optical depth is insensitive to the stellar or remnant mass function of the lenses (see Section 3). We assume all white dwarfs to be of type DA and use evolutionary tracks and atmosphere models from Bergeron, Leggett, & Ruiz (2001), complemented by Chabrier (1999) for the very cool end, applicable to the halo. No brown dwarfs are included in the present model. All simulated stars are single stars.
The evolutionary model fixes the distribution of stars in the space of intrinsic parameters: effective temperature, gravity, absolute magnitude, mass and age. These parameters are converted into colours in various systems through stellar atmosphere models.
The detectability of stars computed in the simulations is subject to interstellar extinction and to observational errors. The latter are computed assuming Gaussian distributions with a dispersion as a function of the star magnitude. The extinction distribution is obtained as described below.
2.2 Extinction distribution
Marshall et al. (2006) have built a 3D model of the distribution of the dust in the inner Galaxy () from an analysis of the 2MASS survey (Skrutskie et al., 2006) using the \bes Galaxy Model. By comparing the observed reddened stars to the unredenned simluated stars of the \bes model, they were able to calculate the extinction as a function of distance for any given line of sight in the Galaxy. The extinction along a line of sight is that which minimises the chi-squared difference between the colour distributions of the observed and simulated stars. The final map has an angular resolution of 15 arcmins and a distance resolution of 100-500 pc. Better angular resolutions are possible but at the cost of reducing the resolution in distance.
Having established the Galactic model we now turn our attention to its microlensing properties.
3 Optical depth evaluation
The optical depth is one of the primary measurables which can be obtained from statistical analyses of microlensing events. It depends only on the distribution and mass normalisation of the source and lens stellar populations and is therefore potentially a very powerful probe of Galactic structure. The optical depth to a source at distance is (Paczyński, 1986)
| (1) |
where is the observer–lens distance, is the lens mass, is the lens mass density and is the Einstein radius of the lens, with and having their usual meaning.
An evaluation of must involve an average over the observed source population. Such an average must take account of, among other factors, the survey sensitivity. Current microlensing surveys such as OGLE-III and MOA-II are observing in the band and are capable of photometry at approximately (c.f. Figure 5 of Udalski et al., 2002). We therefore adopt this limit for our -band calculations. We shall also consider a hypothetical near-infrared microlensing survey observing in the or band. We assume it to be capable of photometry at and for comparison. Such a survey could be conducted with facilities such as UKIRT, VISTA or CFHT and, as we shall see, would have the advantage of being much less affected by dust than the -band surveys. One survey which will be capable of detecting bulge microlensing events in the near-infrared is the Vista Variables in the Via Lactea (VVV) survey, which is scheduled to commence soon after the completion of VISTA in 2009.
We start by computing optical depths according to equation (1) over a three dimensional grid of source positions , where and are Galactic coordinates. For the lenses we employ the same underlying mass density distributions as are used in the \bes Model simulations. We then use the \bes population synthesis program to generate synthetic catalogues of millions of source stars. The catalogues cover the region , , giving a total area of 195 deg2. Each catalogue probes 3239 lines of sight to give a map resolution of , which is the limit of the resolution of the dust map. Finally, we interpolate the optical depth grid at the position of each synthetic source to arrive at a source-averaged optical depth, , for each line of sight.
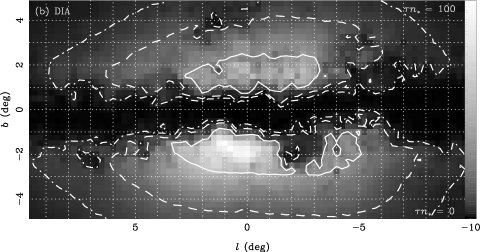
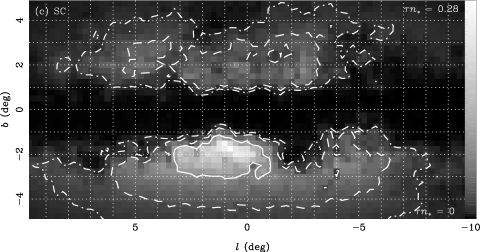
We consider three different optical depth quantities. The first is , which is the optical depth averaged over all “resolved” sources, i.e. those which at baseline are brighter than the assumed survey limit of , or . The second optical depth quantity is which represents the average over all “difference image analysis” (DIA) sources, i.e. those which at peak magnification are brighter than the assumed survey limit. DIA sources can be significantly fainter than the survey limit at baseline and so our simulated source catalogues go four magnitudes fainter than our assumed survey limits. We weight the optical depth contribution of each DIA source by , where is the largest impact parameter, in units of , which allows the event to be detected above the survey limit. This is necessary because, at any instant, only a fraction of unresolved sources are expected to be magnified sufficiently to be detectable as events. Many recent optical depth measurements have been based upon a subset of events involving bright red clump giant (RCG) sources, which are approximate standard candles. We therefore compute a third optical depth quantity, , where is averaged over a subset of bright “standard candle” sources. Our standard candle source selection has
| (2) |
where subscript 0 denotes de-reddened magnitude and the red clump magnitude , with the Galactic longitude expressed in degrees. This prescription follows the “extended red clump” selection algorithm of Sumi et al. (2006), where we have adopted a weighted linear fit to the zero-point corrected red clump magnitude values, , listed in Table 2 of Sumi et al. (2006) for Galactic latitudes .
4 Optical depth and Event Density maps
We present the results from Section 3 in two forms. Firstly as straightforward -band maps of optical depth and secondly we present -band maps of event density, which we define as the product of optical depth and source number density. The latter provides an instantaneous snapshot of the distribution of microlensing events on the sky. In the last part of this section we also present near-infrared microlensing maps.
4.1 Maps of Optical Depth
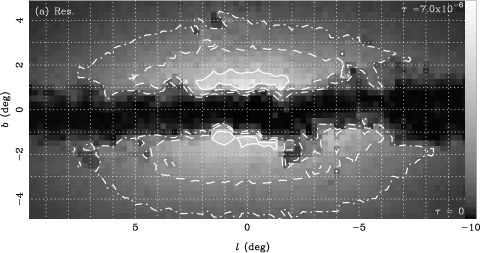
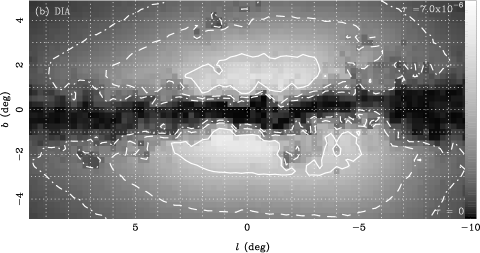
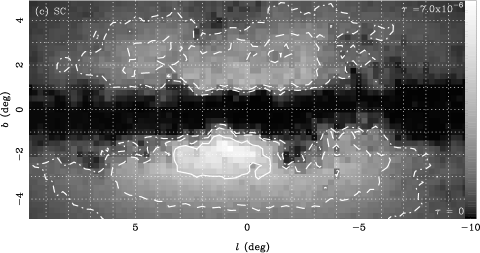
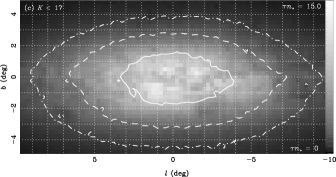
In Figure 1 we present -band optical depth maps for resolved sources (), DIA sources () and bulge “standard candle” sources (). The optical depth is indicated both by the greyscale level and by the contours, which are set at 1, 2 and .
The most obvious distinguishing feature of these maps from previously published predictions is the irregularity of the contour line shapes. This is a direct consequence of the effect of dust. At latitudes the very high column density of dust results in a negligible optical depth because only relatively nearby sources are detectable and these have an intrinsically small lensing optical depth from equation (1). The region of high extinction centred at is also clearly evident from the microlensing optical depth distribution. Also noticeable is the steep optical depth gradient towards the plane at . Away from the Galactic plane the optical depth contours are smoother and comparable to previous models (e.g. Wood & Mao, 2005). In particular the predicted “standard candle” optical depth gradient south of the plane and away from regions of high dust density is deg-1, in very good agreement with measurements from RCG sources (Popowski et al., 2005; Sumi et al., 2006; Hamadache et al., 2006).
In the absence of the dust the central hotspot in the optical depth and event density maps would be located at negative Galactic longitude due to the higher optical depth towards the far side of the bar (e.g. Wood & Mao, 2005). However, this is much more difficult to see in the presence of the dust distribution. When the dust is included the -band optical depth peaks in a localised hotspot centred around with a value of for standard candle sources in the bulge, for resolved sources and for DIA sources. Evidence for such a hotspot comes from EROS-2 (Hamadache et al., 2006) and from the OGLE-II Early Warning System (EWS, Udalski et al., 2003). The EROS-2 bright star event sample clearly shows the greatest contribution from the measured optical depth coming from events in this area (c.f. Figure 14 in Hamadache et al., 2006). In Section 4.2 we discuss the distribution of events from the OGLE-III EWS.
One interesting feature which emerges from Figure 1 is that the DIA optical depth appears less prone to the effects of extinction, with a noticeably narrower avoidance zone due to dust near the Galactic plane. Also interesting are differences in the optical depth between the three measures for specific locations. For example, at Baade’s Window , both and yield optical depths whilst .
Comparison of the optical depth maps with recent optical depth measurements (Popowski et al., 2005; Sumi et al., 2006; Hamadache et al., 2006) indicates a tendency of the model to overestimate the optical depth of bulge standard candle sources towards the plane at (at ). One factor which may be contributing to this is the relatively large Galactocentric distance scale employed in the model ( kpc). Equally, this tendency may also indicate that the bulge model and resulting extinction map may not be optimal. Another contributing factor may be that the extinction map effectively saturates in higher extinction regions where the 2MASS -band sensitivity is relatively low. Consequently, the extinction may be underestimated in regions where (Schultheis et al, in preparation). Either way, a new bulge model for the \bes simulation is in preparation and microlensing data should provide a useful consistency check for it.
Another important factor when comparing predicted and observed optical depths is the photometric cuts used to define the source sample from which the optical depth is computed. The resolved source optical depth produces a significantly lower optical depth than either of the other two measures, highlighting the need for theoretical optical depth calculations to consider the photometric characteristics of individual survey selections. Whilst survey detection efficiency calculations may account for factors such as colour selections, they nonetheless assume some underlying luminosity function for the microlensing sources, which may not necessarily be the same as assumed in theoretical calculations.
4.2 Maps of Event Density
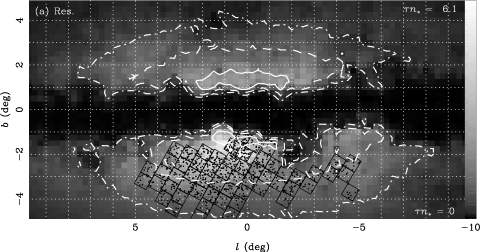
Figure 2 shows equivalent -band maps for the instantaneous event number density, which we define as the product of source-averaged optical depth and the source number density. This quantity is indicative of the spatial variation in the event rate provided there are not significant spatial gradients in the average event duration. The grayscale map in the plots in Figure 2 trace the event density and, to aid comparison, we have overplotted the optical depth contours from Figure 1. In the upper panel of Figure 2 we plot the positions of 57 OGLE-III fields together with 1069 events detected within these fields between 2005 and 2007 by the OGLE-III EWS111http://www.astrouw.edu.pl/ogle/ogle3/ews/ews.html. We have excluded events with Einstein radius crossing times days in order to suppress the bias induced by the fact that some of the OGLE-III fields are monitored several times per night whilst others are monitored nightly. Additionally we exclude long-duration events with days so as to minimise the risk of tracing kinematic structures that would not be represented in our maps which are based only on optical depth.
For all the -band maps there is a predicted hot-spot in the event density at around .The maps clearly indicate that one expects many more events south of the plane than north of it, supporting the current strategy of the survey teams in focussing predominately on the southern side of the plane.
Interestingly the distribution of OGLE-III EWS alerted events also shows hotspots in the regions predicted by the model, and generally the model correlates quite well with the alert event distribution. Of course the detection efficiency of the EWS events is completely uncalibrated so one must be wary of drawing too much from such a comparison, but on the face of it the model appears capable of reproducing clumpy features seen in the observed event distribution. One exception may be at where the model predicts a strong -band microlensing signature for resolved sources but which is not covered by the OGLE survey, which has been optimised over 16 seasons in order to concentrate on high event yield locations. Nonetheless, with sufficiently sophisticated models there is clearly the exciting prospect of using the large available samples of microlensing events to constrain fine structure in the underlying Galactic structure. However, to do this the detection efficiency of the event samples must be known.
4.3 Near-infrared microlensing
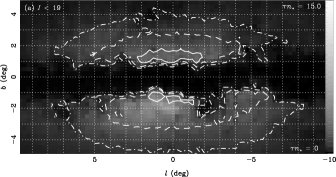
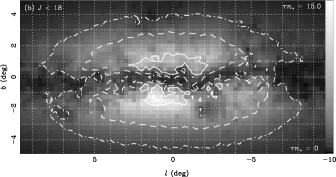
We finish by considering the potential impact of microlensing surveys in the near-infrared (Gould, 1995; Evans & Belokurov, 2002). Specifically, we consider the event density in the and -bands for resolved sources, assuming a survey capable of photometry at and . Such a survey could be performed using the wide-field infrared cameras available on telescopes such as UKIRT, VISTA or CFHT. Indeed the Vista Variables in the Via Lactea (VVV) survey is scheduled to commence on VISTA in 2009 as an ESO Public Survey. VVV will survey some 520 deg2 of the disk and bulge, primarily in the band, over five seasons, with at least one season of almost nightly monitoring from which a substantial number of microlensing events should be detected.
The top, middle and bottom panels in Figure 3 show, respectively, the -band map (also shown in the top panel of Figure 2), the -band map and the -band map of event density for resolved sources (i.e. using ). The grayscale levels of the maps are matched for direct comparison and, as in Figure 2, the contours indicate the optical depth. The advantage of observing in the near-infrared is very clear. Firstly the effects of extinction are greatly reduced, especially in , so that the event density is much higher and, as attested by the smoothness of the -band optical depth contours, more faithfully traces the shape of the underlying mass distribution. These two factors alone mean that a -band survey like VVV would have powerful advantages over -band surveys for Galactic structure studies. However the other main advantage of observing in or is that the northern hemisphere also becomes an attractive target for microlensing studies. In particular the region around exhibits a strong microlensing hotspot in the band, and a reasonably strong hotspot in . The significance of this is that this region includes the far side of the bar at negative . The ability to survey both the near and far sides of the bar would allow the separate microlensing contributions of the disc and bulge to be separated, as the far bar should have a significantly higher disc optical depth than the near bar.
5 Discussion
We have used a synthetic population synthesis model of the Galaxy to construct maps of the microlensing optical depth and event density. The \bes Model employs a three-dimensional extinction map and allows optical depth maps to be computed for individual passbands, and for the maps to adopt sophisticated cuts in source colour and magnitude.
We have computed -band optical depths maps for three distinct event samples: stars which at baseline are resolved at (), comparable to current microlensing survey limits, stars which reach at peak magnification (), and sources which are selected using colour cuts similar to those used to define standard candle samples such as red clump giants (). The structure in the resulting optical depth maps is dominated by the effects of extinction towards the Galactic pane, and demonstrates a much stronger microlensing signal South of the Galactic plane, which is where most of the survey effort is being concentrated. We find that tends to be less affected by the dust. More generally, the comparison between the observed and modelled optical depth can be quite sensitive to the photometric characteristics of the event selection.
We also compute maps of event density, that is the product of optical depth and source density. We find good correlation between these maps and the location of 1069 events detected by the OGLE-III Early Warning System (EWS). A direct quantitative comparison cannot be made since the efficiency of the EWS is unknown. However the model successfully predicts the region of highest event yield as seen by both the OGLE-III and EROS-2 surveys, suggesting that the large scale features of the model are correct. We also find good agreement between the predicted optical depth gradient with latitude and that determined by microlensing surveys. However, the model presented here tends to over-predict the bulge optical depth towards the plane in the case of standard candle source samples. This may possibly be due to a combination of a relatively large assumed Galactocentric distance and an underestimation of extinction in high extinction regions. An improved Galactic model is currently being developed.
We also investigate the potential of near-infrared microlensing surveys by computing event density maps in the and bands. The band in particular is extremely promising in circumventing the worst effects of interstellar dust. -band optical depth contours more faithfully trace the underlying structure of the disc and bulge and also allow both the near- and far-bar to be probed for microlensing. Comparison of near- and far-bar microlensing samples would allow the separate microlensing signatures of disc and bulge lenses to be decoupled, providing additional constraints on Galactic models. Upcoming near-infrared variability surveys, such as VVV, have the potential to provide excellent microlensing samples for Galactic structure studies.
The number of discovered microlensing events is approaching 5000, and yet so far only a few hundred have been analysed for Galactic structure studies. Whilst theoretical models which ignore extinction (or assume it to be smooth) can be compared reasonably successfully with samples of events, they likely will be inadequate for dealing with samples of several thousand events, where fine structure may start to become evident. An accurate calibration of the stellar mass budget in the inner Galaxy is also a vital prerequisite to evaluating the allowable mass budget of dark matter in the inner Galaxy. The analysis of microlensing datasets can therefore provide important indirect constraints on the dark matter halo profile. We believe that synthetic modelling provides an excellent way forward for such work. By fully exploiting the large and expanding catalogues of microlensing samples, synthetic modelling provides the potential for microlensing to be used as a high-precision probe of Galactic structure.
Acknowledgements
EK is supported by an Advanced Fellowship from the Science and Technology Facilities Council. DJM is supported by the Natural Sciences and Engineering Research Council of Canada through its SRO programme. EK wishes to thank Shude Mao for helpful discussions. EK and ACR would like to thank James Binney for hosting a European Science Foundation Workshop on Galaxy modelling, from which came the idea for this work.
References
- Bergbush & VandenBerg (1992) Bergbush P., VandenBerg D., 1992, ApJS, 81, 163
- Bergeron, Leggett, & Ruiz (2001) Bergeron P., Leggett S. K., Ruiz M. T., 2001, ApJS, 133, 413
- Chabrier (1999) Chabrier G., 1999, ApJ, 513, L103
- Bruzual & Charlot (2003) Bruzual G., Charlot S., 2003, MNRAS, 344, 1000
- Crézé et al. (1998) Crézé M., Chereul E., Bienaymé O., Pichon C., 1998, A&A, 329, 920
- Dorman (1992) Dorman B., 1992, ApJS, 81, 221
- Dwek et al. (1995) Dwek E. et al., 1995, ApJ, 445, 716
- Evans & Belokurov (2002) Evans N.W., Belokurov V., 2002, ApJ, 567, 119
- Gomez et al. (1997) Gomez A. E., Grenier S., Udry S., Haywood M., Meillon L., Sabas V., Sellier A., Morin D., 1997, ESASP, 402, 621
- Gould (1995) Gould A., 1995, ApJ, 446, L71
- Hamadache et al. (2006) Hamadache C., et al., 2006, A&A, 454, 185
- Han & Gould (2003) Han C., Gould A., 2003, ApJ, 592, 172
- Haywood, Robin, & Crézé (1997a) Haywood M., Robin A. C., Crézé M., 1997a, A&A, 320, 440
- Haywood, Robin, & Crézé (1997b) Haywood M., Robin A. C., Crézé M., 1997b, A&A, 320, 428
- Jahreiß & Wielen (1997) Jahreiß H., Wielen R., 1997, ESASP, 402, 675
- Kroupa (2001) Kroupa P., 2001, MNRAS, 322, 231
- Lejeune, Cuisinier & Buser (1997) Lejeune T., Cuisinier F., Buser R., 1997, A&AS, 125, 229
- Lejeune, Cuisinier & Buser (1998) Lejeune T., Cuisinier F., Buser R., 1998, A&AS, 130, 65
- Marshall et al. (2006) Marshall D.J., Robin A.C., Reylé C., Schultheis M., Picaud S., 2006, A&A, 453, 635
- Ojha et al. (1996) Ojha D. K., Bienaymé O., Robin A. C., Crézé M., Mohan V., 1996, A&A, 311, 456
- Ojha, Bienaymé, Mohan & Robin (1999) Ojha D. K., Bienaymé O., Mohan, V., Robin A. C., 1999, A&A, 351, 945
- Paczyński (1986) Paczyński B., 1986, ApJ, 304, 1
- Picaud & Robin (2004) Picaud S., Robin A. C., 2004, A&A, 428, 891
- Popowski et al. (2005) Popowski P. et al., 2005, ApJ, 631, 879
- Reylé & Robin (2001) Reylé C., Robin A. C., 2001, A&A, 373, 886
- Robin et al. (1996) Robin A. C., Haywood M., Crézé M., Ojha D. K., Bienaymé O., 1996, A&A, 305, 125
- Robin, Reylé & Crézé (2000) Robin A., Reylé C., Crézé M., 2000 A&A, 359, 103
- Robin, Reylé, Derrière & Picaud (2003) Robin A., Reylé C., Derrière S., Picaud S., 2003, A&A, 409, 523
- Skrutskie et al. (2006) Skrutskie M. F., et al., 2006, AJ, 131, 1163
- Sumi et al. (2003) Sumi T. et al., 2003, ApJ, 591, 204
- Sumi et al. (2006) Sumi T. et al., 2006, ApJ, 636, 240
- Twarog (1980) Twarog B., 1980, ApJS, 44, 1
- Udalski et al. (2002) Udalski A. et al., 2002, AcA, 52, 217
- Udalski et al. (2003) Udalski A. et al., 2003, AcA, 53, 291
- Wood & Mao (2005) Wood A., Mao S., 2005, MNRAS, 362, 945