Zooming in on a sleeping giant: milliarcsecond HSA imaging of the black hole binary V404 Cyg in quiescence
Abstract
Observations of the black hole X-ray binary V404 Cyg with the very long baseline interferometer HSA (the High Sensitivity Array) have detected the source at a frequency of 8.4 GHz, providing a source position accurate to 0.3 mas relative to the calibrator source. The observations put an upper limit of 1.3 mas on the source size (5.2 AU at 4 kpc) and a lower limit of K on its brightness temperature during the normal quiescent state, implying that the radio emission must be non-thermal, most probably synchrotron radiation, possibly from a jet. The radio lightcurves show a short flare, with a rise time of min, confirming that the source remains active in the quiescent state.
keywords:
X-rays: binaries – radio continuum: stars – stars: individual (V404 Cyg) – ISM: jets and outflows – astrometry1 Introduction
Accreting black hole X-ray binary systems spend the majority of their time in the so-called “quiescent” state, a low-luminosity state (below a few of the Eddington luminosity) whose X-ray emission is characterised by a hard () power-law spectrum (McClintock & Remillard, 2006). Despite such highly sub-Eddington systems being so numerous, their intrinsic faintness poses serious observational challenges to any attempt to understand the nature of the accretion flow in these systems.
Accreting black holes have been studied in much more depth in the “hard” state, a regime with a similarly hard spectrum but occurring at higher X-ray luminosities (up to a few per cent of the Eddington luminosity). In this state, they show flat radio spectra, (e.g Fender, 2001) interpreted as synchrotron emission arising from partially self-absorbed, conical jets (Blandford & Konigl, 1979; Hjellming & Johnston, 1988). Such jet-like structures have been directly imaged in two systems, GRS 1915+105 (Dhawan et al., 2000) and Cygnus X-1 (Stirling et al., 2001), at X-ray luminosities of 5 and 0.3 per cent of the Eddington luminosity respectively. With only two relatively luminous examples of self-absorbed jets, it has not been possible to study the dependence of the jet size and geometry with system parameters such as orbital period, nature of the mass donor, accretion rate, and black hole mass.
On moving from the hard to the quiescent state, the radio properties of X-ray binaries become progressively less constrained, owing to the limitations of current instrumentation. In particular, the questions of whether radio-emitting outflows persist into quiescence, and if so, what form they take, remain to be answered. Quiescence is currently defined (McClintock & Remillard, 2006) only by the luminosity criterion erg s-1 (i.e. , where is the Eddington luminosity and is the black hole mass), although there are indications that the X-ray spectrum in quiescence softens from the canonical power-law index of the hard state to a value closer to 2 (Gallo et al., 2006; Corbel et al., 2006; Bradley et al., 2007). However, at such low luminosities, instrumental sensitivity begins to hamper efforts to characterise the behaviour of quiescent systems, and the detailed spectral properties of the quiescent state remain to be determined. Extrapolation of the observed hard state behaviour suggests that it is a reasonable assumption that jets should also exist in the quiescent state. This hypothesis is supported by the detection of A0620-00 in the quiescent state in both the radio and X-ray bands (Gallo et al., 2006), which demonstrated that the radio/X-ray correlation seen in the hard state (Gallo et al., 2003) remains unbroken down to . Further support is provided by the observed flat radio spectrum in V404 Cyg (Gallo et al., 2005). However, the evidence is circumstantial, and direct empirical proof for the existence of such quiescent jets is still lacking.
1.1 V404 Cyg
V404 Cyg (GS 2023+338) is the most luminous of the quiescent black hole X-ray binaries, with a mean X-ray luminosity of erg s-1 (Garcia et al., 2001; Kong et al., 2002; Hynes et al., 2004; Bradley et al., 2007). Its high, accurately-determined mass function, (the most statistically significant measurement of a mass function above ; Casares & Charles, 1994), implies that the compact object must be a black hole. The best-fitting system parameters indicate that the mass donor is a K0 IV star (Casares et al., 1993) in a 6.5-d orbit with a black hole of mass (Shahbaz et al., 1994), although contamination of the infrared spectrum by light from the accretion disc could reduce this to , with a firm lower limit of (Shahbaz et al., 1996). Han & Hjellming (1992) measured a kinematic Hi distance of kpc. Assuming Eddington-limited X-ray emission during the 1989 outburst gives a maximum distance of kpc, whereas the optical magnitude and reddening information suggests kpc (Jonker & Nelemans, 2004). We will adopt the latter value for the rest of this work.
The radio spectrum of V404 Cyg was measured to be flat, with a spectral index of (Gallo, Fender & Hynes 2005), defining . Its flux density is mJy at radio wavelengths (Gallo, Fender & Pooley 2003), although it is known to vary up to levels of 1.5 mJy (Hjellming et al., 2000). The radio emission is believed to be of synchrotron origin (Gallo et al., 2005), and the quiescent radio and X-ray luminosities are consistent with an extrapolation of the non-linear radio/X-ray correlation found for hard state X-ray binaries (Gallo et al., 2003), suggestive of jet emission. However, the collimated nature of the outflow remains to be proven.
Muno & Mauerhan (2006) detected 4.5- and 8- m infrared emission from V404 Cyg in excess of that expected from the Rayleigh-Jeans tail of the companion star, which they attributed to emission from the accretion disc. However, Gallo et al. (2007) demonstrated that the broadband radio through X-ray spectral energy distribution (SED) could be well fitted with a maximally jet-dominated model, suggesting that the excess infrared emission was consistent with being synchrotron emission from a partially self-absorbed jet.
As the most luminous quiescent black hole X-ray binary, and with so much circumstantial evidence for jets, V404 Cyg is the ideal candidate in which to try to demonstrate empirically the existence of jets in a quiescent accreting black hole system. Since the source is so faint ( mJy; other quiescent systems are fainter still), we proposed for Very Long Baseline Interferometry (VLBI) observations with the High Sensitivity Array (HSA) in an attempt to resolve the jets, and as a pilot to check the feasibility of a future parallax measurement to determine the source distance.
2 Observations and data reduction
V404 Cyg was observed for 4.25 h with the HSA on 2007 December 2, from 18:00:00 until 22:15:00 UT, under program code BG 168. We used nine antennas of the Very Long Baseline Array (VLBA; the tenth antenna, St. Croix, was down for maintenance) plus the Green Bank Telescope (GBT), Effelsberg and the phased Very Large Array (VLA). Eleven of the 24 available VLA stations were retrofitted EVLA antennas. We observed at 8.4 GHz, in dual-circular polarization, with a bandwidth of 32 MHz per polarization. Samples were quantized to 2-bits, giving a total bit rate of 256 Mb s-1. We used J 2025+3343, a 2-Jy source located only 16.6 arcmin from the target, as both the fringe finder and phase reference source. We observed in 3-min cycles, spending 2 min on the target and 1 min on the calibrator in each cycle. Every 24 min, we also made observations of a check source, J 2023+3153, the next nearest bright calibrator (1.9° from the phase reference source), followed by a rephasing of the VLA.
Data were reduced according to standard procedures within the National Radio Astronomy Observatory’s Astronomical Image Processing System (AIPS) software (Greisen, 2003). During the self-calibration of the phase reference source, the initial model of the calibrator was created using only the VLBA antennas, since the a priori calibration (using system temperatures) for the VLBA antennas is better than that for the larger dishes. Amplitude self-calibration was then used to correct the gains of the large dishes according to the VLBA-only model. Since the sensitivites on the typically long baselines connecting the large dishes dominated the self-calibration solutions, their absolute flux scale could not be sufficiently well determined using standard calibration. The visibilities on baselines from the Los Alamos (LA) station to the VLA were compared to those at similar (u,v) co-ordinates between the LA and Pie Town (PT) stations, and a global scaling factor of 0.89 was applied to correct the VLA gains and bring the two sets of visibilities into agreement. A similar procedure was applied to baselines from the North Liberty (NL) station to both the Hancock (HN) antenna and the GBT, although it was found that no scaling was necessary for the GBT gains. Finally, the calibration derived on the phase reference source was transferred to the target. Owing to the low flux density of the target, no self-calibration was performed.
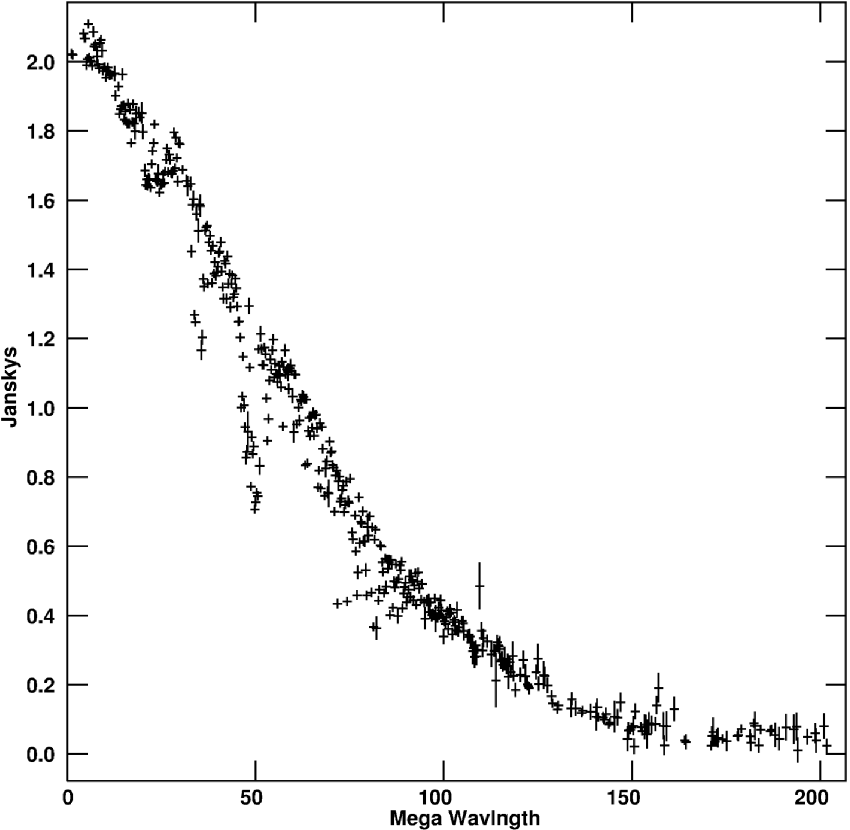
The extreme scattering towards the phase reference source (Fey et al., 1989) meant that the achievable resolution was set by the longest unscattered baseline to the calibrator, rather than the expected instrumental resolution. For this reason, the data from Effelsberg had to be rejected. Visibilities were scattered to zero amplitudes on baselines longer than 150 M (Fig. 1), whereas baselines to Effelsberg were between 120 and 290 M. Those in the range 120–150 M were taken at the lowest elevations, and it was not deemed possible to achieve accurate gain calibration for any of the data from this station.
The VLA data were independently reduced and imaged, using standard procedures within AIPS. Weather conditions at the VLA were excellent throughout the observations. Amplitude calibration was performed using observations of 3C 48, adopting the flux density scale set by the coefficients derived at the VLA in 1999.2, as implemented in the 31DEC08 version of AIPS. While no proper polarization calibration could be performed, the low polarization leakage of the VLA (of order a few per cent) meant that we could obtain approximate constraints on the linear () and circular () polarization of the source by imaging the two internal IF pairs separately in all four Stokes parameters , , and , and forming .
3 Results
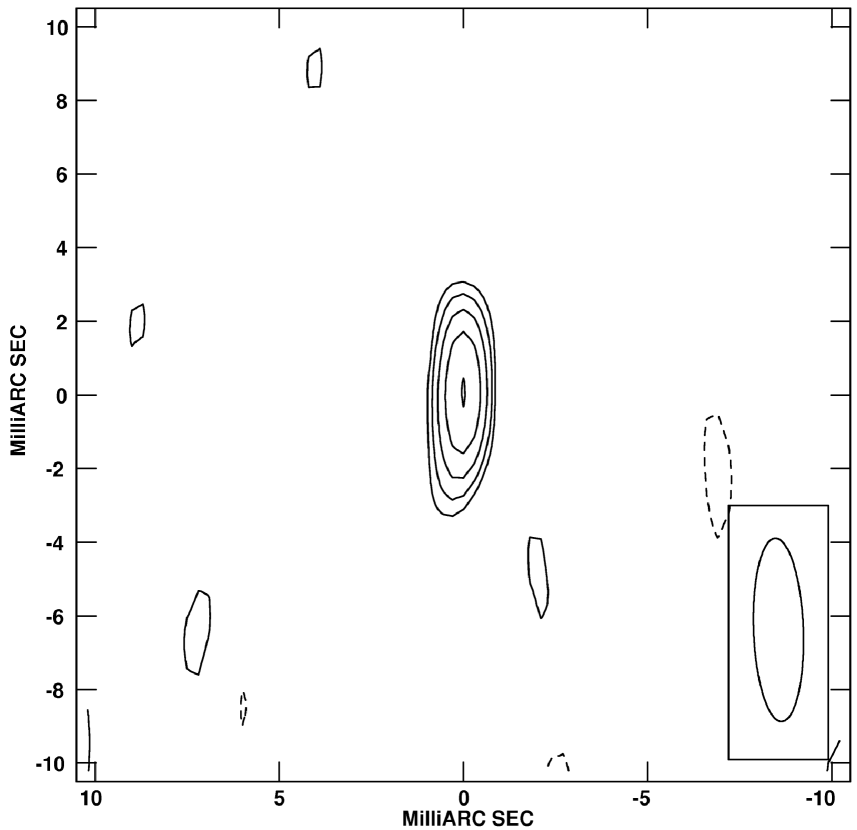
V404 Cyg was detected by the HSA at a level with a mean flux density of mJy bm-1 (here and in all the following sections, unless specified, we quote error bars). The source was unresolved down to a beamsize of mas2 in PA 20 (Fig. 2). The elongation is caused by the high sensitivities of the GBT and phased VLA, with baselines to (and particularly between) those antennas dominating the naturally-weighted sampling function.
We independently reduced the VLA data, to measure the total flux density of the source and ascertain whether any emission was being resolved out by the HSA. The flux density measured by the VLA, averaged over the length of the observation, was mJy, showing that the HSA is detecting most of the flux density, and constraining the majority of the emission to come from a region smaller than 5 mas (Section 4 discusses the size constraint in more detail).
3.1 Variability
To search for shorter-timescale variability, the VLA data were split into short (30-min) time segments and imaged. The source was fit in the image plane with a point source model during each 30-min interval, and the resulting lightcurve is shown in Fig. 3.
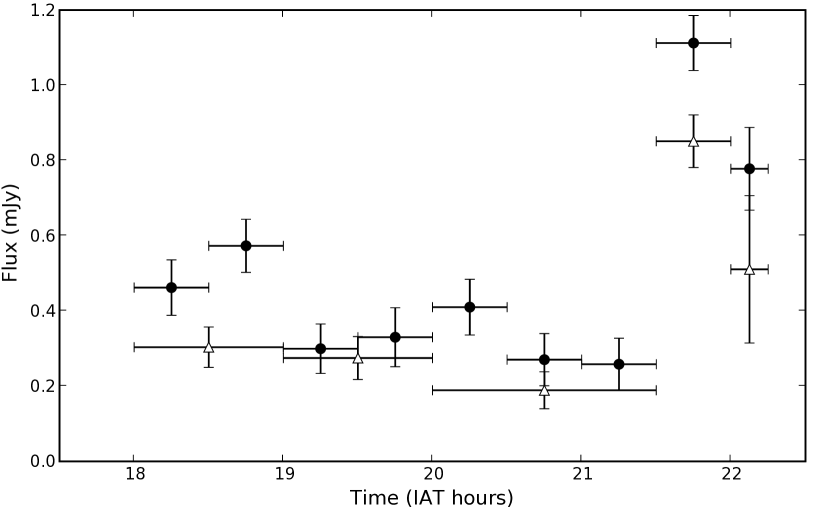
The measured HSA flux density is consistent with recovering per cent of the total flux density measured with the VLA at all times. When imaging the data from the flare at the end of the observations, editing out the data from the phased VLA resulted in recovering a much higher fraction of the total source flux ( mJy out of mJy), suggesting possible amplitude calibration or phasing problems with the VLA. However, a similar analysis performed on the non-flare data showed no significant discrepancy between the results with and without including the phased VLA. Thus any problems with the phased VLA were confined to the time of the flaring observations.
3.1.1 Flaring emission
The source flux density as measured by the VLA rose by a factor of 3 during the flare at the end of the observing run, and there is also the suggestion of a smaller flare earlier in the observation, at 18:45. The rise time of the main flare was min, and it showed no detectable circular or linear polarization (to a limit of 32 per cent), ruling out coherent stellar bursts from the donor as the origin of the emission. However, incoherent gyrosynchrotron stellar flares with timescales of tens of minutes and much lower degrees of circular polarization are common in RS CVn and Algol-type systems (Güdel, 2002), and the peak radio luminosities of such flares can reach levels of – erg s-1 Hz-1 (e.g. Mutel et al., 1987; Benz & Güdel, 1994; García-Sánchez et al., 2003). One such system, UX Ari, with a K0 subgiant in a 6.44-d orbital period with a G5 main sequence star (Strassmeier et al., 1993), makes for a good comparison to V404 Cyg in terms of the rotation rate and stellar type of the flaring subgiant star. The maximum flare strength seen in this system in 3 years of radio monitoring was 0.82 Jy at 8.3 GHz (Richards et al., 2003), implying a peak luminosity of erg s-1 Hz-1, among the highest observed to date in such systems. The peak luminosity of the flare seen in V404 Cyg was an order of magnitude higher still, making it unlikely (if not impossible) that the observed flare in our data originates from the donor star.
Splitting the HSA observations into 1-h chunks for imaging (Fig. 3), we found that the flare was also seen in the high-resolution data. Imaging only the data from during the flare also showed that the source was unresolved, being smaller than the beamsize of mas2 in PA 9.
3.1.2 Non-flaring emission
Taking only the data prior to the flare (18:00–21:30 UT), the HSA measured a mean quiescent flux density of mJy beam-1, and the source was unresolved with a beamsize of mas2 in PA 55. The VLA alone measured mJy beam-1. There was no evidence for any source polarization with the VLA, down to a limit of 40 per cent for both linear and circular polarization.
3.2 Source position
The shift in source position between quiescent and flaring states was mas ( uncertainty), consistent with zero. Using all the available data, the measured VLBI position, relative to the phase reference source J 2025+3343 (whose position was taken to be111http://vlbi.gsfc.nasa.gov/solutions/2005f_astro/2005f_astro_cat.txt (J 2000) 20h25m108421050(224) 33°43′0021443(42)) was
where the quoted error bars are the purely statistical errors from fitting in the image plane. Imaging of the check source, J 2023+3153, phase referenced to J 2025+3343, showed that the shift in its position, relative to the catalogued position, was 0.34 mas in RA and 0.09 mas in Dec., compared to uncertainties of 0.24 and 0.41 mas respectively in the catalogued position of J 2023+3153. Since the check source was seven times further away from the phase reference calibrator than the target source, we are therefore confident that the systematic errors in the source position (e.g. due to atmospheric phase gradients) are small and the positional uncertainty is dominated by the signal-to-noise ratio on the target.
The unresolved nature of the source makes this system a good candidate for a future parallactic distance determination, free from the extra positional uncertainties introduced by source structure. The current measurement of the position would be used as an initial starting point. A distance of kpc (Jonker & Nelemans, 2004) would imply a parallax of mas, which is certainly feasible with current instrumentation.
4 Jet size constraints
4.1 Image and visibility-based limits
In order to put limits on the size of any extension, we fitted the source with an elliptical Gaussian in both the image plane (with the AIPS task JMFIT) and the uv-plane (using the AIPS task UVFIT and the Caltech VLBI package Difmap). Using the whole data set with all available stations, the () upper limit on the FWHM of the major axis was found to be mas. We note that a sufficiently low-level extension would not show up in the fitting results, so this is not a rigorous upper limit to the source size.
4.2 Brightness temperature limits
Radio surface brightness may be parameterized in terms of the temperature a blackbody would need to have in order to produce a source of the observed size and flux density, at the observed frequency, in the Rayleigh-Jeans limit. This is the brightness temperature, given by
| (1) |
where is the speed of light, the source flux density at frequency , is Boltzmann’s constant and the solid angle subtended by the source. Our most stringent constraint comes from the microflare, when the flux density measured by the HSA was mJy and fitting an elliptical Gaussian to the source in the image plane gave an upper limit to the source size of mas2. This gives a lower limit to the brightness temperature of K. For comparison, for the non-flaring data, fitting an elliptical Gaussian in the image plane gave an upper limit to the size of mas2 and a consequent lower limit to the brightness temperature of K.
Previous VLBI observations of Galactic X-ray binary jets have measured brightness temperatures of K (e.g Dhawan et al., 2000; Mirabel et al., 2001). Should this be the case in V404 Cyg, we can use the flux density during the flare to place an upper limit of sr on the solid angle subtended by the source, corresponding to a geometric mean size of 0.16 mas. However, most resolved X-ray binary systems have shown collimated jets, so as an example, for an axial ratio of 4:1 (the definition of jets adopted by Bridle & Perley, 1984), the derived solid angle would translate into a jet length of 0.3 mas.
The inverse Compton catastrophe limits the brightness temperature of a radio-emitting source to K, if it is not relativistically boosted. For the flux density of 1.0 mJy beam-1 measured during the flare, this limits the source size to as ( as for the non-flaring emission with a flux density of 0.24 mJy beam-1).
4.3 Variability limits
The -min rise time of the flare corresponds to a distance of m for a source moving at the speed of light, or an angular size of 0.9 mas if the motion is in the plane of the sky. However, sources moving at small angles to the line of sight can show apparent superluminal motion, with . We have no constraints on the speed or inclination angle to the line of sight of the source, but constrain the size of the flaring region to be mas.
Similarly, for the brightness temperature size constraints derived in Section 4.2, we can derive limits on the jet speed, for a rise time of 30 min. For K, the jet speed is limited to , and for K, the jet speed is km s-1. If the jet is to be moving close to the speed of light, it would have to be more elongated, and have a lower brightness temperature.
4.4 Theoretical limits
Heinz (2006) derived an expression for the length of a flat-spectrum, partially self-absorbed jet, as a function of basic jet parameters, normalizing the relation using the VLBA measurements of the jet in Cygnus X-1 (Stirling et al., 2001). The observed angular extent of the jet, , within which 50 per cent of the flux density is contained, can be written as
| (2) |
where is the source distance, is the Doppler factor, the inclination angle of the jet to the line of sight, the Lorentz factor , and is the jet velocity in units of the speed of light. Shahbaz et al. (1994) derived an inclination angle of ° for V404 Cyg, and we measured a flux density of 0.3 mJy. Heinz (2006) took values of mas, mJy and ° for Cygnus X-1. With these parameters, a distance of 4 kpc, and assuming that the Doppler factor is similar in the two sources (since scales as , the exact value is unimportant) and that the disc is perpendicular to the jet, we predict a jet length of 0.6 mas in V404 Cyg.
4.5 Previous constraints
Mioduszewski et al. (2008) also observed V404 Cyg with the VLBA and phased VLA. From their non-detection at 15 GHz, when the VLA lightcurve suggested that an source should have been seen, they inferred that the source was being resolved out, putting a lower limit on the source size of 1 mas. Together with light-travel time arguments applied to the flares they detected, they constrained the source size to lie in the range 4–7 AU. While this is consistent with our upper limit of 1.3 mas, it might initially appear to be difficult to reconcile with the theoretical predictions of 0.3–0.6 mas. Either the models are out by a factor of 2–3 (quite possible given some of the inherent assumptions), or some unknown instrumental problem (possibly similar to the apparent suppression of the flux density we found when using the VLA during the flare) caused the source brightness to be reduced below their expected detection. In order to resolve the jet, high-frequency, global VLBI would be required, to overcome the scattering (which scales as ) and achieve a resolution of mas. Should the jets not be detected with higher-resolution observations, it would present a serious challenge to the jet interpretation of the radio emission from quiescent systems.
5 Scattering
The line of sight to the Cygnus region is known to be highly scatter-broadened (Fey et al., 1989). Fluctuations in the electron density in the interstellar medium (ISM) modify the refractive index of the plasma, inducing distortions in a wavefront travelling through the medium. This reduces the coherence of the electric field measured by two separated antennas, reducing the amplitude of the visibilities measured on long baselines, or, equivalently, giving rise to angular broadening in the image plane. Rickett (1990) discusses other effects of interstellar scattering, such as scintillation and temporal broadening of pulsed emission.
Fey et al. (1989) measured the scattering properties along the lines of sight to several extragalactic calibrators in the Cygnus region, including our phase reference source, J 2025+3343 (i.e. B 2023+336) and our amplitude check source, J 2023+3153 (i.e. B 2021+317). The scattering is clearly non-uniform, and the scattering properties can differ dramatically with small position offsets on the sky. Between our two calibrators, separated by only 1.9∘, the scattering measure varies by a factor of five. The measured scattering size of J 2025+3343 at 4.99 GHz was mas, scaling as , with . At 8.4 GHz, we measured a scattering disc size of mas2, fitting in either the image or uv-plane. This is significantly larger than the previously-derived scattering size, although the size is known to vary; Fey & Desai (2000) claimed evidence for a 50 per cent increase in scattering disc size at all frequencies, in observations taken three years after their original data.
5.1 Source distance
V404 Cyg lies behind the Cygnus superbubble. Uyanıker et al. (2001) found that the superbubble was not a single physical entity, but a projection of unrelated features at different distances. Nevertheless, the structures are all believed to lie between 0.5 and 2.5 kpc from us. While the line of sight to V404 Cyg does not pass through any of the known OB associations in the region, we can limit the location of the major scattering screen to be within the same range of distances. Assuming a single thin phase screen is responsible for the majority of the scattering, then according to the relative distance of the scattering screen and scattered source, we can predict the expected scattering size,
| (3) |
where is the scattering size of the galactic source at distance , is the scattering size of the background extragalactic source, and is the distance from the observer to the phase screen. As demonstrated by Lazio & Cordes (1998), the observed scattering size of a galactic source depends on the relative distance of the source and the intervening phase scattering screen. The closer the source is to the scattering screen, the less scattered the source will be.
The major axis of the calibrator scattering disc, 2.2 mas, together with the maximum major axis size of mas permitted by the fits to the source data in the image and uv planes shows that if the assumption of a thin phase screen is valid, and the scattering measure is similar along the lines of sight to the source and calibrator, then the lower limit to the source distance is . This gives limits of and kpc respectively, for screen distances of 0.5 and 2.5 kpc, consistent with the range of 2.8–6.2 kpc range derived by Jonker & Nelemans (2004). While this is not terribly constraining, it shows that lower-frequency observations which resolved the scattering disc of V404 Cyg could potentially provide an alternative, albeit model-dependent, estimate of the source distance.
5.2 Scintillation
Given the high scattering towards the source, we should determine whether the observed variability is intrinsic to the source, or whether it could be caused by interstellar scintillation. From the scattering measure of m-20/3 kpc measured towards the phase reference source by Fey et al. (1989), and assuming a scattering screen located at kpc, then the standard scattering equations (e.g. Goodman, 1997) imply that we are in the strong scattering regime (for which the cutoff frequency is GHz with these parameters). Our observing bandwidth of 32 MHz is too large to detect diffractive scintillation (the decorrelation bandwidth is MHz), and the source size, limited to as by the inverse Compton limit of K, is also too large (diffractive scattering would require as). Thus we are in the regime of refractive scintillation. For intrinsic source sizes between 5 as and 1.3 mas (from the brightness temperature limit and the measured upper limit on the source size from the visibilities), the timescale of refractive scintillation is between 140 and 1000 h (scaling almost linearly with ), with a modulation index (scaling as ). Thus the observed variability, an increase by a factor of 3 on a timescale h, must be intrinsic to the source.
6 Flaring and the nature of the quiescent state
Despite being in a “quiescent” state, V404 Cyg exhibits sub-orbital variability in the optical (Wagner et al., 1992) and infrared (Sanwal et al., 1996) bands, with some evidence for a 6-h quasi-periodicity (Casares et al., 1993). Hynes et al. (2002) found that variable photo-ionization of the accretion disc by the X-ray source was responsible for the observed H flares, a conclusion reinforced by observations of correlated X-ray and H variability (Hynes et al., 2004). The optical continuum flares did not correlate as well with the X-ray flares, leading Hynes (2005) to suggest that the continuum variability could be due to synchrotron emission from a jet. The source is known to vary in the radio band (e.g. Hjellming et al., 2000), and Mioduszewski et al. (2008) presented tentative evidence for a similar 6-h radio periodicity. The similar variability characteristics (timescales and flare amplitudes) seen at the different wavebands are suggestive of a common origin.
While certainly intrinsic to the source, and clearly a common phenomenon in this system, the nature of the radio flaring is still to be determined. A thermal bremsstrahlung origin is ruled out, since it would produce too high an X-ray luminosity for the system. This suggests that the radio emission is non-thermal (certainly plausible given the relatively high brightness temperature), although a spectral index measurement during a flare is needed to determine whether such flares are optically thick or optically thin. Due to a paucity of simultaneous multiwavelength observations, any connection with the optical continuum flares remains purely speculative. We note, however, evidence for a correlation between the optical and radio bands is seen in the identical power-law decay timescale measured in the two wavebands during the 1989 outburst (Han & Hjellming, 1992).
The min rise time of the flare implies that the source of the flaring emission must be of size AU, times the size of the binary orbit (Shahbaz et al., 1994). Mioduszewski et al. (2008) suggested three possibilities for the origin of such flaring; collimated jets, shocks in the circumstellar medium, or diffuse emission as seen in SS 433 (Blundell et al., 2001). The latter was on much larger scales (several hundred AU), and was interpreted by the authors as bremsstrahlung emission, for which reasons, we are inclined to favour the jet or shock interpretations.
The flat radio spectrum seen in the quiescent state of V404 Cyg (Gallo et al., 2005) implies optically-thin thermal or optically-thick synchrotron emission. Thermal emission is ruled out due to overpredicting the observed X-ray emission. Optically-thick synchrotron emission is typically interpreted as a partially self-absorbed conical jet in X-ray binary systems, which would make flaring in the jet, possibly due to internal shocks, a potential candidate for the observed variability. Other circumstantial evidence for the existence of jets in the quiescent state is seen in the correlation between the X-ray and radio luminosities of hard-state black hole X-ray binaries at X-ray luminosities below (Gallo et al., 2003). This correlation was later demonstrated to hold across the entire black hole mass spectrum (Merloni, Heinz & di Matteo 2003; Falcke, Körding & Markoff 2004), and simultaneous X-ray and radio observations of A0620-00 (Gallo et al., 2006) demonstrated that this correlation persists in quiescence, down to X-ray luminosities as low as . The resolved jets seen in GRS 1915+105 and Cygnus X-1 at the high-luminosity end of the correlation then make it plausible that jets are also present at much lower luminosities. However, there are several caveats to this argument. A number of sources have recently been found with lower than expected radio luminosities (Corbel et al., 2004; Chaty, 2006; Cadolle Bel et al., 2007; Rodriguez et al., 2007), calling into question the universality of the correlation (Gallo, 2007). Also, in the absence of direct imaging, nothing is known about the extent and degree of collimation of such quiescent jets, should they exist. The inferred larger inner disc radii derived in the quiescent state (McClintock et al., 2003) could potentially affect the collimation of the outflow. While the SED of the quiescent source A0620-00 has been well-fitted with a maximally jet-dominated model (Gallo et al., 2007), other models cannot be ruled out. Extended, flat-spectrum radio emission not arising from a jet has been seen in the relatively uncollimated expanding structures observed in CI Cam (Mioduszewski & Rupen, 2004) and RS Oph (Rupen et al., 2007) and the equatorial emission of SS 433 (Blundell et al., 2001). Thus the true morphology of the emission in V404 Cyg cannot be definitively ascertained without high-resolution radio imaging.
Han & Hjellming (1992) suggested that the short-timescale variability in the radio lightcurves of the 1989 outburst of V404 Cyg could be interpreted as shocks at the ends of jets. Circumstellar shocks have been directly imaged in the high-mass X-ray binary CI Cam (Mioduszewski & Rupen, 2004). This system has a very dense stellar wind, which is thought to have smothered the jets ejected during the outburst, giving rise to an expanding shell of radio emission seen on VLBI scales. While the wind in V404 Cyg is likely to be less strong, the size constraint on the flares of V404 Cyg implies that they are occurring closer to the binary than the shock seen in CI Cam, where any wind from the donor star would be densest. With the available single-frequency, unresolved radio image, we cannot hope to pin down the location of the shocks. Ultimately, some explosive event is required to cause the radio flares, and whether they are shocks within or at the ends of jets cannot yet be determined.
As the most luminous black hole X-ray binary in quiescence, V404 Cyg is the only source in which such flaring activity has been detected in the quiescent state. The question of whether the flares are unique to this source, or are commonplace in such systems, has implications for the nature of the accretion process at low luminosities. Owing to the limitations of current instrumentation, it has not been possible to observe other quiescent systems with sufficient time resolution in the radio band to detect such flares. Models fitting the SEDs of quiescent sources often assume a non-varying source, such that non-simultaneous observations in different bands could be used to build up the SED (e.g. Gallo et al., 2007). If flaring emission is ubiquitous in these sources, the need for strict simultaneity will have to be more rigorously enforced.
Observations of XTE J 1118+480 and GX 339-4 in their hard states (currently differentiated from the quiescent state only by a fairly arbitrary luminosity criterion) have shown evidence for fast variability in the optical and X-ray regimes (Motch et al., 1983; Hynes et al., 2003). In XTE J 1118+480, both the autocorrelations and the cross-correlation between the two wavebands were inconsistent with X-ray reprocessing and more indicative of optical synchrotron variability (Kanbach et al., 2001), which Malzac, Merloni & Fabian (2004) were able to explain with a jet-dominated model. The timescales are shorter in this source than seen in V404 Cyg however, and there were no high-time resolution radio data for comparison (although we note that we would not expect to see radio variability on timescales shorter than a few minutes, since any variations occurring at the base of a jet would be smoothed out further downstream where the source became optically thin in the radio regime). A better comparison is the quiescent black hole in the centre of our Galaxy, Sgr A*, accreting at . It shows radio and infrared flaring activity (although any connection between the two bands is as yet unclear), and the radio flaring has been explained as adiabatic expansion of a self-absorbed transient population of relativistic electrons (e.g Yusef-Zadeh et al., 2006).
There is thus significant evidence that flaring activity in or at the end of a jet is a feature of the quiescent state of accreting black hole systems. Whether there is a truly steady underlying jet as assumed by standard jet models (Blandford & Konigl, 1979) or whether the emission is composed of multiple overlapping flares, or some more uncollimated structure, remains to be determined. More sensitive instruments such as the Expanded VLA (EVLA), e-MERLIN and the upgraded VLBA are necessary to probe these short-timescale flares and determine the nature of the quiescent emission.
7 Conclusions
We have detected the quiescent black hole X-ray binary system V404 Cyg with the High Sensitivity Array at 8.4 GHz. The unresolved source has a brightness temperature of K, and the emission is inferred to be non-thermal synchrotron radiation. Our detection provides the most accurate source position to date, which can serve as an initial point for future proper motion studies. We have also constrained the length of the jet in this system to be mas, consistent with previous measurements and theoretical expectations.
A small flare was detected with both the VLA and the HSA, with a rise timescale of 30 min, in which the source flux density rose by a factor of 3. This flare is certainly intrinsic to the source, and cannot be caused by interstellar scintillation. This is further evidence that source flux densities in the quiescent state are not stable, mandating the use of strictly simultaneous observations when constructing and modelling SEDs to determine the contribution of different components (such as jets) to the observed emission in different wavebands.
The detection of an unresolved quiescent black hole X-ray binary system opens the way for further high-resolution observations. If the inferred jets indeed exist, and are flat-spectrum, as has been proposed, then higher-frequency observations would be well-placed to resolve the jets, if the theoretical predictions for the jet length are correct. Furthermore, the unresolved source at 8.4 GHz is an ideal candidate for a parallactic distance determination, free from the uncertainties associated with the source structure seen when such systems are observed with VLBI during outburst.
Acknowledgments
This research has made use of NASA’s Astrophysics Data System. J.C.A.M.-J. is a Jansky Fellow of the National Radio Astronomy Observatory. E.G. is supported through Chandra Postdoctoral Fellowship grant number PF5-60037, issued by the Chandra X-Ray Center, which is operated by the Smithsonian Astrophysical Observatory for NASA under contract NAS8-03060. The VLBA is a facility of the National Radio Astronomy Observatory which is operated by Associated Universities, Inc., under cooperative agreement with the National Science Foundation.
References
- Benz & Güdel (1994) Benz A. O., Güdel M., 1994, A&A, 285, 621
- Blandford & Konigl (1979) Blandford R. D., Konigl A., 1979, ApJ, 232, 34
- Blundell et al. (2001) Blundell K. M., Mioduszewski A. J., Muxlow T. W. B., Podsiadlowski P., Rupen M. P., 2001, ApJ, 562, L79
- Bridle & Perley (1984) Bridle A. H., Perley R. A., 1984, ARA&A, 22, 319
- Bradley et al. (2007) Bradley C. K., Hynes R. I., Kong A. K. H., Haswell C. A., Casares J., Gallo E., 2007, ApJ, 667, 427
- Cadolle Bel et al. (2007) Cadolle Bel M. et al., 2007, ApJ, 659, 549
- Casares & Charles (1994) Casares J., Charles P. A., 1994, MNRAS, 271, L5
- Casares et al. (1993) Casares J., Charles P. A., Naylor T., Pavlenko E. P., 1993, MNRAS, 265, 834
- Chaty (2006) Chaty S., 2006, in Belloni T., ed., Proceedings of the “VI Microquasar Workshop: Microquasars and Beyond”, PoS: Trieste, 14
- Corbel et al. (2004) Corbel S., Fender R. P., Tomsick J. A., Tzioumis A. K., Tingay S., 2004, ApJ, 617, 1272
- Corbel et al. (2006) Corbel S., Tomsick J. A., Kaaret P., 2006, ApJ, 636, 971
- Desai & Fey (2001) Desai K. M., Fey A. L., 2001, ApJS, 133, 395
- Dhawan et al. (2000) Dhawan V., Mirabel I. F., Rodríguez, L. F. 2000, ApJ, 543, 373
- Falcke et al. (2004) Falcke H., Körding, E., Markoff S., 2004, A&A, 414, 895
- Fender (2001) Fender R. P., 2001, MNRAS, 322, 31
- Fey & Desai (2000) Fey A. L., Desai K. M., 2000, BAAS, 197, 722
- Fey et al. (1989) Fey A. L., Spangler S. R., Mutel R. L., 1989, ApJ, 337, 730
- Gallo et al. (2003) Gallo E., Fender R. P., Pooley G. G., 2003, MNRAS, 344, 60
- Gallo et al. (2005) Gallo E., Fender R. P., Hynes R. I., 2005, MNRAS, 356, 1017
- Gallo et al. (2006) Gallo E., Fender R. P., Miller-Jones J. C. A., Merloni A., Jonker P. G., Heinz S., Maccarone T. J., van der Klis M., 2006, MNRAS, 370, 1351
- Gallo (2007) Gallo E., 2007, in L.A. Antonelli et al., AIP Conf. Ser. 924, The multicolored landscape of compact objects and their explosive origins, AIP, New York, p.715
- Gallo et al. (2007) Gallo E., Migliari S., Markoff S., Tomsick J. A., Bailyn C. D., Berta S., Fender R., Miller-Jones J. C. A., 2007, ApJ, 670, 600
- Garcia et al. (2001) Garcia M. R., McClintock J. E., Narayan R., Callanan P., Barret D., Murray S. S., 2001, ApJ, 553, L47
- García-Sánchez et al. (2003) García-Sánchez, J., Paredes J. M., Ribó M., 2003, A&A, 403, 613
- Goodman (1997) Goodman J., 1997, New Astronomy, 2, 449
- Greisen (2003) Greisen E. W., 2003, in Information Handling in Astronomy: Historical Vistas, ed. A. Heck (Dordrecht: Kluwer), 109
- Güdel (2002) Güdel, M., 2002, ARA&A, 40, 217
- Han & Hjellming (1992) Han X., Hjellming R. M., 1992, ApJ, 400, 304
- Heinz (2006) Heinz S., 2006, ApJ, 636, 316
- Hjellming & Johnston (1988) Hjellming R. M., Johnston K. J., 1988, ApJ, 328, 600
- Hjellming et al. (2000) Hjellming R. M., Rupen M. P., Mioduszewski A. J., Narayan R., 2000, ATel. 54
- Hynes (2005) Hynes R. I., 2005, in ASP Conf. Ser. 330, The Astrophysics of Cataclysmic Variables and Related Objects, eds. J. M. Hameury & J.-P. Lasota, (San Francisco: Astronomical Society of the Pacific), 237
- Hynes et al. (2002) Hynes R. I., Zurita C., Haswell C. A., Casares J., Charles P. A., Pavlenko E. P., Shugarov S. Y., Lott D. A., 2002, MNRAS, 330, 1009
- Hynes et al. (2003) Hynes R. I. et al., 2003, MNRAS, 345, 292
- Hynes et al. (2004) Hynes R. I. et al., 2004, ApJ, 611, L125
- Jonker & Nelemans (2004) Jonker P. G., Nelemans G., 2004, MNRAS, 354, 355
- Kanbach et al. (2001) Kanbach G., Straubmeier C., Spruit H. C., Belloni T., 2001, Nature, 414, 180
- Kong et al. (2002) Kong A. K. H., McClintock J. E., Garcia M. R., Murray S. S., Barret D., 2002, ApJ, 570, 277
- Lazio & Cordes (1998) Lazio T. J. W., Cordes J. M., 1998, ApJS, 118, 201
- Malzac et al. (2004) Malzac J., Merloni A., Fabian A. C., 2004, MNRAS, 351, 253
- McClintock & Remillard (2006) McClintock J. E., Remillard R. A., 2006, in Compact stellar X-ray sources, ed. W. H. G. Lewin & M. van der Klis (Cambridge: Cambridge University Press), 157
- McClintock et al. (2003) McClintock J. E., Narayan R., Garcia M. R., Orosz J. A., Remillard R. A., Murray S. S., 2003, ApJ, 593, 435
- Merloni et al. (2003) Merloni A., Heinz S., di Matteo T., 2003, MNRAS, 345, 1057
- Mioduszewski & Rupen (2004) Mioduszewski A. J., Rupen M. P., 2004, ApJ, 615, 432
- Mioduszewski et al. (2008) Mioduszewski A. J., Hynes R. I., Rupen M. P., Dhawan V., 2008, in AIP Conf. Ser., A Population Explosion: The Nature and Evolution of X-ray Binaries in Diverse Environments, eds. R. M. Bandyopadhyay, S. Wachter & D. M. Gelino & C. R. Gelino (New York: American Institute of Physics),
- Mirabel et al. (2001) Mirabel I. F., Dhawan V., Mignani R. P., Rodrigues I., Guglielmetti F., 2001, Nature, 413, 139
- Motch et al. (1983) Motch C., Ricketts M. J., Page C. G., Ilovaisky S. A., Chevalier C., 1983, A&A, 119, 171
- Muno & Mauerhan (2006) Muno M. P., Mauerhan J., 2006, ApJ, 648, L135
- Mutel et al. (1987) Mutel R. L., Morris D. H., Doiron D. J., Lestrade J. F., 1987, AJ, 93, 1220
- Richards et al. (2003) Richards M. T., Waltman E. B., Ghigo F. D., Richards D. S. P., 2003, ApJS, 147, 337
- Rickett (1990) Rickett B. J., 1990, ARA&A, 28, 561
- Rodriguez et al. (2007) Rodriguez J., Bel M. C., Tomsick J. A., Corbel S., Brocksopp C., Paizis A., Shaw S. E., Bodaghee A., 2007, ApJ, 655, L97
- Rupen et al. (2007) Rupen M. P., Mioduszewski A. J., Sokoloski J. L., ApJ, accepted
- Sanwal et al. (1996) Sanwal D., Robinson E. L., Zhang E., Colome C., Harvey P. M., Ramseyer T. F., Hellier C., Wood J. H., 1996, ApJ, 460, 437
- Shahbaz et al. (1994) Shahbaz T., Ringwald F. A., Bunn J. C., Naylor T., Charles P. A., Casares J., 1994, MNRAS, 271, L10
- Shahbaz et al. (1996) Shahbaz T., Bandyopadhyay R., Charles P. A., Naylor T., 1996, MNRAS, 282, 977
- Stirling et al. (2001) Stirling A. M., Spencer R. E., de la Force C. J., Garrett M. A., Fender R. P., Ogley R. N., 2001, MNRAS, 327, 1273
- Strassmeier et al. (1993) Strassmeier K. G., Hall D. S., Fekel F. C., Scheck M., 1993, A&AS, 100, 173
- Uyanıker et al. (2001) Uyanıker, B., Fürst, E., Reich W., Aschenbach B., Wielebinski R., 2001, A&A, 371, 675
- Wagner et al. (1992) Wagner R. M., Kreidl T. J., Howell S. B., Starrfield S. G., 1992, ApJ, 401, L79
- Yusef-Zadeh et al. (2006) Yusef-Zadeh F., Roberts D., Wardle M., Heinke C. O., Bower G. C., 2006, ApJ, 650, 189