A Mini-survey of Ultracool Dwarfs at 4.9 GHz
2 Computational Astrophysics Laboratory, I.T. Building, National University of Ireland, Galway, Ireland)
Abstract
A selection of ultracool dwarfs are known to be radio active, with both gyrosynchrotron emission and the electron cyclotron maser instability being given as likely emission mechanisms. To explore whether ultracool dwarfs previously undetected at 8.5 GHz may be detectable at a lower frequency. We select a sample of fast rotating ultracool dwarfs with no detectable radio activity at 8.5 GHz, observing each of them at 4.9 GHz. From the 8 dwarfs in our sample, we detect emission from 2MASS J07464256+2000321, with a mean flux level of 286 24 . The light-curve of 2MASS J07464256+2000321, is dominated towards the end of the observation by a very bright, 100 left circularly polarized burst during which the flux reached 2.4 mJy. The burst was preceded by a raise in the level of activity, with the average flux being 160 in the first hour of observation rising to 400 in the 40 minutes before the burst. During both periods, there is significant variability. The detection of 100% circular polarization in the emission at 4.9 GHz points towards the electron cyclotron maser as the emission mechanism. However, the observations at 4.9 GHz and 8.5 GHz were not simultaneous, thus the actual fraction of dwarfs capable of producing radio emission, as well as the fraction of those that show periodic pulsations is still unclear, as indeed are the relative roles played by the electron cyclotron maser instability versus gyrosynchrotron emission, therefore we cannot assert if the previous non-detection at 8.5 GHz was due to a cut-off in emission between 4.9 and 8.4 GHz, or due to long term variability.
KeywordsStars: low-mass, brown dwarf – Radio continuum: stars – Radiation mechanism: general – Masers
1 Introduction
Ultracool dwarfs (UCDs) are defined as those dwarfs with spectral type M7 or later (Kirkpatrick et al. 1997). Due to the low and in most instances non-detectable levels of H and X-ray emission, radio emission was considered to be insignificant until Berger et al. (2001) reported a detection from the brown dwarf LP 944-20. Additional sources were reported by Berger (2002), Burgasser & Putman (2005), Berger (2006) and Phan-Bao et al. (2007) with the emission mechanism assumed to be gyrosynchrotron. A highly polarized flare, detected by Burgasser & Putman (2005) from the M8 dwarf DENIS 1048-3956, was interpreted as due to coherent electron cyclotron maser emission.
Hallinan et al. (2006) reported a periodicity in the radio emission of the UCD TVLM 513-46546 (hereafter TVLM 513), consistent with the rotation period of the dwarf (Lane et al. 2007). They suggested that the emission process was due to an electron cyclotron maser (ECM), similar to the emission process in the magnetized planets in the solar system (Zarka 1998, Ergun et al. 2000). In a higher sensitivity followup study, Hallinan et al. (2007) observed extremely bright, periodic bursts of both left and right hand 100 circularly polarized emission from the same source. The characteristics of these short duration bursts were consistent with a coherent process, the electron cyclotron maser instability.
There have been a number of surveys of ultracool dwarfs in the radio (see references above). Thus far, 9 out of the UCDs observed at radio frequencies have been detected as radio sources. All of these surveys, however, were conducted at 8.5 GHz. This may have major implications for the number of radio active cool dwarfs if the electron cyclotron maser is the dominant mechanism as in this case the emission is mostly at the fundamental or second harmonic of the cyclotron frequency , i.e. for an object to have detectable emission at 8.5 GHz requires a magnetic field strength of 3 kG. Thus, it is possible that dwarfs, with maximum field strengths below that value may be detectable in the radio at lower frequencies.
In order to investigate this possibility, we conducted observations with the Very Large Array (VLA)111The National Radio Astronomy Observatory is a facility of the National Science Foundation operated under cooperative agreement by Associated Universities, Inc. for a sample of 8 ultracool dwarfs (previously undetected at 8.5 GHz) at the lower frequency of 4.9 GHz. Here we present the results of our observations and the detection of another ultracool dwarf producing electron cyclotron maser emission, the L0.5 binary system 2MASS J07464256+2000321.
2 The Sample
Our sample consists of 8 ultracool dwarfs spanning the spectral
range M8.5 – T6. All our targets were previously undetected at 8.5
GHz. Below we summarize the main properties of each dwarf in the sample.
2MASS J03350208+2342356 (2MASS0335+23)
This object was identified as a young M8.5 brown dwarf, based on the
presence of Li i absorption, situated at a distance of 19.2 pc
(Gizis et al. 2000, Reid et al. 2002). It also exhibits H
emission, with in the range 4.6 – 6.5Å, while
Berger (2006) reported an 8.5 GHz radio emission upper limit of Jy. The projected rotational velocity = 30 km
s-1 (Reid et al. 2002).
2MASP J0345432+254023 (2MASS0345+25)
This is an L0 spectral type brown dwarf (Kirkpatrick et al. 1999) with
km s-1 (Berger, 2006 and references therein).
It shows no evidence of H or Li i emission, has
2430 K, log
(Vrba et al. 2004) at an estimated distance of 27 pc (Gizis et al. 2003). Bailer-Jones & Mundt (2001) reported it as photometrically
variable. The upper limit for the 8.5 GHz radio flux, given by
Berger (2002) is Jy.
2MASS J07464256+2000321 (2MASS0746+20)
This dwarf was discovered by Kirkpatrick et al. (2000) and was later
resolved as a near equal mass binary system, with a separation of
2.7 AU (Reid et al. 2001). Dahn et al. (2002) determined its
distance to be 12.2 0.05 pc. Vrba et al. (2004) estimated log for the system, with an effective
temperature in the range K. Several studies
reported detection of H emission and only an upper limit on
Li i (Bouy et al. 2004). In the radio, Berger (2006) give an
upper limit of Jy. Bouy et al. (2004) made the
first measurement of the dynamical mass of the system, classifying
both components as L0 0.5 and L1.5 0.5 respectively. In
a recent study, Gizis & Reid (2006) argued that it is still unclear
whether 2MASS0746+20B is actually a brown dwarf. They argue that the
system is much older ( 1 Gyr) and the second component has
a mass which is above or just at the sub-stellar limit. Rotational
velocity studies give in the range 23.0 – 28.8 km
s-1 and a rotational period between 1.84 and 5.28 hrs (Bailer-Jones, 2004).
Such a rotational period is in very good
agreement with a photometric variability detected by Clarke
et al. (2002), with a periodicity of 3 hrs.
2MASS J22244381-0158521 (2MASS2224-01)
This is another fast rotator, e.g. Bailer-Jones (2004) reported a
projected rotational velocity in the range
km s-1 giving an expected rotational period of 3.8 hrs. The
dwarf was first discovered by Kirkpatrick et al. (2000), classifying
it as L4.5. The distance to the dwarf is 11.4 pc, it has 1790 K (Dahn et al. 2002) and a bolometric luminosity log (Golimowski et al. 2004).
H emission has been detected, with = 1Å and only an upper limit for Li i (Kirkpatrick et al. 2000). In
the radio, Berger (2006) gives an upper limit of the flux at 8.5 GHz
Jy.
2MASS J15074769-1627386(2MASS1507-16)
This is a nearby L5 brown dwarf, located at 7.3 pc (Dahn et al. 2002). It has an estimated age of 1 Gyr and K, log (Vrba
et al. 2004) and only upper limits on Li i and H of
less than 0.1Å and 0.5Å respectively (Reid et al. 2000). For
this dwarf, Bailer-Jones (2004) reported a projected rotational
velocity of km s-1 giving an expected
rotational period of 3.5 hrs. Berger (2002)
give an upper limit to the 8.5 GHz radio flux as Jy.
2MASS J13054019-2541059 (Kelu-1)
This is the fastest rotator in our sample with
km s-1 (Mohanty & Basri 2003), it has a parallax of 18.7 pc
(Dahn et al. 2002), and a bolometric luminosity of log, which together with an age,
constrained to 0.3 - 1 Gyr, yields K
(Golimowski et al. 2004 and references therein). Kelu-1 appears
over-luminous compared to other early type L dwarfs, which could be
either due to a very young age or a close companion (Leggett et al.2002). It exhibits H emission (Ruiz et al. 1997) but is
undetected in X-rays (Neuhäuser et al. 1999) and radio
wavelengths. Berger (2006) gives an upper limit of Jy
at 8.5 GHz. Using the Keck laser guide star adaptive optics system,
Liu & Leggett (2005) resolved the dwarf as a binary with separation
5.4 AU, with estimated spectral types L1 - L3 and L3 - L4.5
respectively, with masses in the sub-stellar regime
for both components. Recently Audard et al. (2007) conducted
simultaneous X-ray and 8.5 GHz observations of this system, resulting
in a detection in X-rays, erg s-1
and a upper limit of Jy at 8.5 GHz.
SDSS J162414.37+002915.6 (SDSS1624+00)
This is the first field T dwarf discovered (Strauss et al. 1999),
and is classified as a T6. It has a parallax of 11.00 0.15 pc
(Burgasser et al. 2006) and a bolometric luminosity log. It has a rotational velocity of
= 34 – 38 km s-1 (Zapatero Osorio et al. 2006). It
has no detected H emission (Burgasser et al. 2000) and no
detection of radio emission at 8.5
GHz (Jy, Berger 2006).
2MASP J1632291+190441 (2MASS1632+19)
This is an L8 brown dwarf, first discovered by Kirkpatrick et al. (1999), situated at a distance of 15.2 pc (Dahn et al. 2002). It’s
effective temperature and luminosity are = 1346 K and
log respectively (Vrba et al. 2004). This dwarf
has upper limits for emission in both H (Mohanty &
Basri 2003) and radio (Jy, Berger 2006). The
reported projected rotational velocity for 2MASS1632+19 is km s-1 according to Mohanty & Basri (2003), while Zapatero
Osorio et al. (2006) give km s-1.
| Name | (J2000) | (J2000) | SpT | |||
|---|---|---|---|---|---|---|
| () | (km s-1) | (Jy) | ||||
| 2MASS 0335+23 | 03 35 02.08 | +23 42 35.6 | M8.5 | 51.2 | 30 | 45 |
| 2MASS 0345+25 | 03 45 43.16 | +25 40 23.3 | L0 | 37.1 | 25 | 36 |
| 2MASS 0746+20 | 07 46 42.56 | +20 00 32.2 | L0.5 | 81.9 | 25.8 | 286 24 |
| Kelu-1 | 13 05 40.18 | -25 41 06.0 | L2 | 53.6 | 60.0 | 84 |
| 2MASS 1507-16 | 15 07 47.69 | -16 27 38.6 | L5 | 136.4 | 27.2 | 57 |
| SDSS 1624+00 | 16 24 14.37 | +00 29 15.6 | T6 | 91.5 | 36 | 81 |
| 2MASS 1632+19 | 16 32 29.11 | +19 04 40.7 | L8 | 65.6 | 30.0 | 39 |
| 2MASS 2224-01 | 22 24 43.81 | -01 58 52.1 | L4.5 | 88.1 | 24.7 | 46 |
Note. - The columns are (left to right): name of the object; right ascension; declination; spectral type; parallax; rotational velocity; radio flux at 4.9 GHz References. Ruiz et al. (1997), Kirkpatrick et al. (1999), Strauss et al. (1999), Gizis et al. (2000), Kirkpatrick et al. (2000), Berger (2002), Dahn et al. (2002), Reid et al. (2002), Gizis et al. (2003), Mohanty & Basri (2003), Bailer-Jones (2004), Golimowski et al. (2004), Vrba et al. (2004), Berger (2006), Zapatero Osorio (2006).
3 Observations and Data Reduction
The observations were conducted at a frequency of 4.9 GHz (6 cm) with the NRAO Very Large Array (VLA) on 22–23 January 2007. During the observations, the instrument was in full array mode and DnC configuration. We used the standard continuum mode with 2 50 contiguous bands, sampling every 10 s. The flux density calibrator was 3C147. The phase was monitored using calibration sources selected to be within 10 degrees of the target. The total time on each source was 2 hours (time on source in a single scan being 8 minutes, before moving to the phase calibrator for 90 s) enabling confirmation of all sources with average flux levels of Jy.
Data reduction was carried out with the Astronomical Image Processing System (AIPS) software package. The visibility data were inspected for quality both before and after the standard calibration procedures, and noisy points removed. For imaging the data, we used the task IMAGR. We also CLEANed the region around each source and used the UVSUB routine to subtract the resulting source models for the background sources from the visibility data. We then used the task UVFIX to shift the tangent point coordinates of the target source to coincide with the phase centre of the map. The subtraction of the background sources and the shifting of the map are necessary since the side-lobes of those sources and the change in the synthesised beam shape during the observation may result in creating false variability of the target source, or contamination of any real variability present. As a next step we re-imaged the visibility data set in both total intensity (Stokes I), and circular polarization (Stokes V). For examining the light curves we used the AIPS task DFTPL.
4 Results
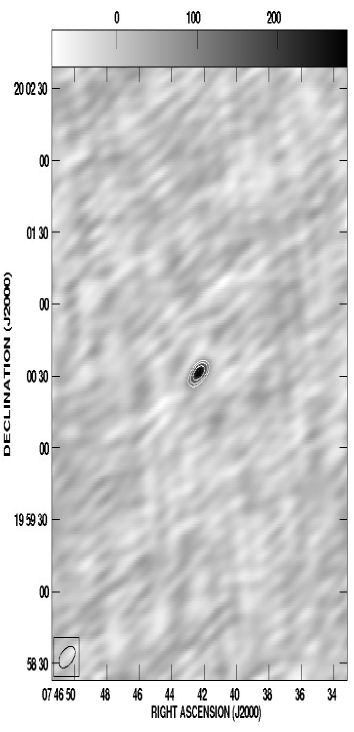
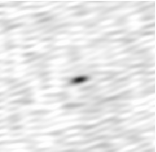
In Table 1 we list the main properties of the observed sources, as well as the measured radio flux or upper limits at 4.9 GHz, based on detection/non-detection respectively. From the 8 dwarfs in our sample, we detect emission from 2MASS0746+20, with a mean flux level of 286 24 (Fig. 1). The object’s derived position was consistent with its expected location after correcting for proper motion (Dahn et al. 2002).
The flux, detected from 2MASS0746+20 implies a radio luminosity erg and log() = –16.24. Due to the low spatial resolution of our observation, we do not resolve the system, thus we cannot determine which component is dominant.
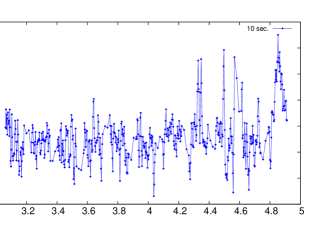
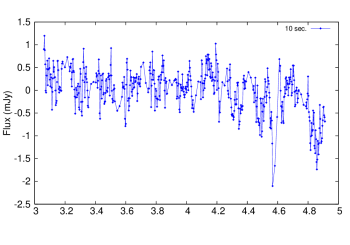
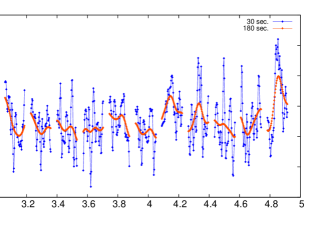
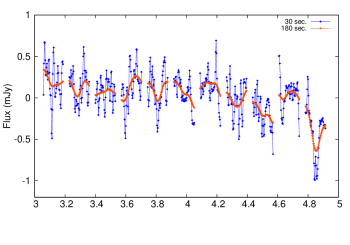
To further examine the behaviour of the source, we plot its light-curve in total intensity (Stokes I) and circular polarization (Stokes V) (Fig. 2). We show three different time resolutions (10s, 30 s and 180 s) The light-curve of 2MASS0746+20, is dominated towards the end of the observation by a very bright, 100 left circularly polarized burst during which the flux level reached 2.3 mJy. The burst was preceded by a raise in the level of activity, with an average flux of 160 in the first hour of observation rising to 400 in the 40 minutes before the burst. This rise is in part due to a series of other bursts, e.g. one at 4.3 hr. and another at 4.6 hr. Unfortunately, the larger of these occurs during a phase calibration, and thus we only detect the rise and delay. It is however detectable in both I and V.
The above fluxes were determined by separately imaging the two time intervals. During both intervals, there is significant variability. Because the total observing time (2 hours) is less than the expected rotational period of the dwarf ( 3.7 hours, Bailer-Jones 2004), searching for rotational modulation (as in Hallinan et al. 2006, 2007) is not possible.
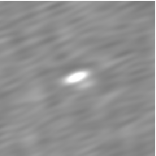
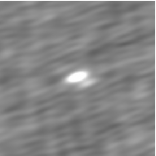
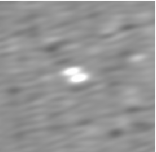
As a next step, we imaged the field around the dwarf separately in three time intervals in both Stokes I and Stokes V, keeping a close-by ( 12 arcsec), bright background source for comparison. Fig. 3 shows the resulting maps. The top left panel shows the Stokes I map of the 3 to 4 hrs UT interval, the top right panel is the Stokes I map during the 4 – 4.75 hrs UT interval, while the bottom left and right show Stokes I and Stokes V images of the last 10 minutes of the observation. The background source is the dominant feature in the map during the first two intervals (as well as the map of the entire 2 hour observation), while in the last one, it is actually fainter than 2MASS 0746+20 in total intensity and is absent from the map in circular polarization, where the ultracool dwarf is clearly visible. Imaging the map in Stokes V during the first two time intervals did not reveal a source at the position of the dwarf.
The behaviour of the 2MASS0746+20 light-curve, i.e. the low flux levels at the start of the observation, followed by a brightening and a strong, but short-lived burst, led us to an interesting question. What if a source has pulsed emission, but its quiescent emission is absent, or too low to be detected? In this case, since the pulses span only a few minutes, the overall flux will be very low and most likely at, or below the 3 detection limit. If , where and are the flux density during a pulse and the average flux density of the whole observation, and and are the duration of the pulse and the duration of the whole observation respectively, the SNR will be higher for the pulse than for the entire observation. To investigate such a possibility, we reexamined our X band data for TVLM 513 (Hallinan et al. 2007), taken with the VLA in May 2006. It spans over 10 hours, covers 5 periods of rotation of the dwarf and clearly shows bursts of 100 left and right circularly polarized flux. The SNR of a single 8 min burst exceeded the SNR of the entire observation by factor of 1.5 (for 2MASS0746+20 the SNR during the pulse exceeds the SNR of the whole observation by a factor of 2). Therefore to rigorously determine whether an ultracool dwarf is detected or not, it is necessary to image subsets of the data for the possible presence of pulses.
To determine which subsets to image, we produced three sets of ten second resolution time series of the May 2006 TVLM 513 data: with the source at the phase center and the field sources removed, with the source at the phase center and the field sources still present and a set of time series with the source not at the phase center but with the field sources present. Comparing those three sets of time series, showed that even though the presence of the background sources affects the shape of the target’s light-curve, the pulses are still clearly visible when the target is at the phase centre of the map. If the target is shifted from the phase centre, the shape of the light-curve changes drastically and the pulses are no longer visible. We repeated the same experiment on our 2MASS0746+20 data. The result was the same - even with the background sources present, when the dwarf is at the phase centre, i.e. the burst in the last 10 min of the observation is still clearly present in the light curve. Shifting the position of the target off, on the other hand, makes the picture less clear and the presence of the burst is not obvious.
Encouraged by these results, we repeated the experiment for the rest of the targets in our sample. We first acquired from the literature accurate proper motion measurements for each dwarf, then calculated the dwarfs’ coordinates at the epoch of our observation. Using the AIPS task UVFIX, we shifted the phase centre of every map to coincide with the position of the respective dwarf and then plotted the visibilities in both total intensity and circular polarization, using the task DFTPL. Inspecting the light curves did not reveal any additional detections.
5 Discussion
Until recently, radio emission from UCDs has been attributed to incoherent gyrosynchrotron emission, similar to that detected from early to mid-type M dwarfs (Berger et al. 2005, 2006, Burgasser & Putman 2005, Osten et al. 2006). However, Hallinan et al. (2006) argued that the more likely scenario is a coherent, electron cyclotron maser emission from a low-density region above the magnetic poles of the dwarf. This model would require the presence of a stable, large-scale magnetic field, with field strengths 3 kG. The presence of fields with such strength on low mass stars and UCDs has been suggested by direct observations (Donati et al. 2007 and Reiners & Basri 2007). Subsequent observations of TVLM 513 (Hallinan et al. 2007) have revealed extremely bright, periodic, 100 circularly polarized bursts, produced by the strong beaming of the radio emission and the rapid rotation of the dwarf. These properties, especially the high levels of polarization and the inherent directivity of the emission, together with the resulting high brightness temperature, provide confirmation of the coherent nature of the emission.
For the electron cyclotron maser operation, a population inversion in the electron distribution is needed, as well as a relatively strong magnetic field and low-density plasma, so that the electron cyclotron frequency is greater than the plasma frequency , where and Hz. An efficient mechanism for reaching the necessary anisotropy in the electron distribution, is the shell instability, proposed as a source of Earth’s auroral kilometric radiation, when it became clear that the loss-cone distribution was a poor fit to the observations (see Treumann 2006 for review). It is suggested that the main source for any strong electron-cyclotron maser is found in the presence of a magnetic-field-aligned electric potential drop which has several effects. For example, it can dilute the local plasma to such an extent that the plasma enters the regime in which the electron-cyclotron maser becomes effective and favours emission in a direction roughly perpendicular to the ambient magnetic field. This emission is the most intense, since it implies the coherent resonant contribution of a maximum number of electrons in the distribution function. What is more, such an instability can be sustained over a range of heights above the stellar surface, thus producing pseudo broadband, coherent radio emission, which would explain the simultaneous detection of both 8.4 and 4.9 GHz emission from TVLM 513 (Hallinan et al. 2006, 2007) and 2MASS0036+18 (Berger et al. 2002, 2005). These conditions are fulfilled in the low density, high magnetic field strength regions over the poles of a large scale magnetic field.
The striking similarities in the emission of TVLM 513 and now 2MASS0746+20, in particular the highly polarized pulse, strongly suggest that 2MASS0746+20 is an analog of TVLM 513, i.e. another UCD producing electron cyclotron emission. Since we do not resolve the system, we cansnot say which component is responsible for the observed emission. Yet, as in the cases of TVLM 513, the emission during the burst most likely comes from an active region with a size much smaller than the radius of the dwarf.
ECM emission is emitted at the electron cyclotron frequency and its harmonics, i.e. 2.8 B Hz. This gives maximum magnetic field strength B 1.75 kG for 2MASS 0746+20 as compared to B 3 kG derived for TVLM 513. Reiners & Basri (2007) recently suggested the presence of magnetic fields of such strength on late M dwarfs via direct measurements, although these were filling factor dependent. Of the fourteen dwarfs of spectral type M5.0 or later, all but four show the presence of magnetic fields stronger than 1 kG.
Further high sensitivity radio observations of 2MASS0746+20 are needed, in particular a longer time series. Resolving the system to its components will identify the component responsible for the radio emission. It is also possible that both components are pulsing in which case, using Fourier analysis techniques, one may be able to extract the period of rotation of both dwarfs and determine the inclination angle of the equatorial plane to the orbital plane, using previously determined .
6 Conclusions
The fraction of UCDs with detected radio emission so far is 10% (Berger 2006, Phan-Bao et al. 2006). Yet, recent observations give us reason to think that this value may be underestimated. The above figure is based on VLA surveys at 8.5 GHz and with the assumption that the emission from these objects is stable over long periods of time. However, in the context of the electron cyclotron maser, emission at 8.5 GHz would require the presence of magnetic fields strengths up to 3 kG. Thus any objects with weaker fields would be undetected at that frequency, as is the case of 2MASS0746+20. On the other hand, recent VLA observations of the L2.5 brown dwarf 2MASS J05233822-1403022 reveal the possibility that levels of ECM emission generated in UCDs can vary significantly over months (Antonova et al. 2007).
Taking into account the above considerations, it is clear that
despite the progress made in understanding the production mechanism
of radio emission from ultracool dwarfs, the actual fraction of
dwarfs, capable of producing radio emission, as well as the fraction
of those, that show periodic pulsations is still unclear. The
detection of emission at 4.9 GHz from 2MASS0746+20 points strongly
towards the electron cyclotron maser instability as a more likely
emission mechanism, at least for the short duration pulse. However,
further followup observations are required.
Acknowledgements Armagh Observatory is grant-aided by the N. Ireland Dept. of Culture, Arts & Leisure. We gratefully acknowledge the support of Science Foundation Ireland (Grant Number 07/RFP/PHYF553). This research has made use of the Simbad database, operated at CDS, Strasbourg, France.
References
- (1) Audard, M., Osten, R. A., Brown, A., Briggs, K. R., Güdel, M., Hodges-Kluck, E. & Gizis, J. E., 2007 A&A 471, 63
- (2) Bailer-Jones, C.A.L. & Mundt, R., 2001, A&A 374, 1071
- (3) Bailer-Jones, C. A. L., 2004 A&A, 419, 703
- (4) Berger, E., et al. 2001, Nat 410, 338
- (5) Berger, E., 2002, ApJ 572, 503
- (6) Berger, E., et al. 2005, ApJ 627, 960
- (7) Berger, E., 2006, ApJ 648, 629
- (8) Bouy, H., et al. 2004, A&A 423, 341
- (9) Burgasser, A.J. & Putman, M.E., 2005, ApJ 626, 486
- (10) Clarke, F. J., Oppenheimer, B. R. & Tinney, C. G., 2002, MNRAS 335, 1158
- (11) Dahn, C. C., et al. 2002, AJ 124, 1170
- (12) Donati, J. F., et al. 2007, astro.ph..2159
- (13) Ergun, R. E., Carlson, C. W., McFadden, J. P., Delory, G. T., Strangeway, R. J. & Pritchett, P. L., 2000, ApJ 538, 456
- (14) Gizis, J. E., Monet, D. G., Reid, I. N., Kirkpatrick, J. D., Liebert, J. & Williams, R. J., 2000, AJ 120, 1085
- (15) Gizis, J. E., Reid, I. N., Knapp, G. R., Liebert, J., Kirkpatrick, J. D., Koerner, D. W. & Burgasser, A. J., 2003, AJ 125, 3302
- (16) Gizis, J. E. & Reid, I. N., 2006, AJ 131, 638
- (17) Golimowski, D. A., Leggett, S. K., Marley, M. S., Fan, X., Geballe, T. R., Knapp, G. R., Vrba, F. J., Henden, A. A., Luginbuhl, C. B., Guetter, H. H., Munn, J. A., Canzian, B., Zheng, W., Tsvetanov, Z. I., Chiu, K., Glazebrook, K., Hoversten, E. A., Schneider, D. P. & Brinkmann, J., 2004, AJ 127, 3516
- (18) Hallinan, G., Antonova, A., Doyle, J.G., Bourke, S., Brisken, W.F. & Golden, A., 2006, ApJ 653, 690
- (19) Hallinan, G., Lane, C., Bourke, S., Antonova, A., Doyle, J.G., Zavala, R.T., Brisken, W.F., Boyle, R.P., Vrba, F.J. & Golden, A., 2007a, ApJ 663, L25
- (20) Kirkpatrick, J. D., Beichman, C. A. & Skrutskie, M. F. 1997, ApJ 476, 311
- (21) Kirkpatrick, J. D., Reid, I. N., Liebert, J., Cutri, R. M., Nelson, B., Beichman, C. A., Dahn, C. C., Monet, D. G., Gizis, J. E. & Skrutskie, M. F., 1999, ApJ, 519, 802
- (22) Kirkpatrick, J. D., Reid, I. N., Liebert, J., Gizis, J. E., Burgasser, A. J., Monet, D. G., Dahn, C. C., Nelson, B. & Williams, R. J., 2000, AJ 120, 447
- (23) Knapp, G. R., et al. 2004, AJ 127, 3553
- (24) Lane, C., Hallinan, G., Zavala, R.T., Butler, R.F., Boyle, R.P., Bourke, S., Antonova, A., Doyle, J.G., Vrba, F.J. & Golden, A., 2007, ApJ 668, L163
- (25) Leggett, S.K., et al. 2002, ApJ 564, 452
- (26) Liu, M. C. & Leggett, S. K., 2005 ApJ, 634, 616
- (27) Mohanty, S. & and Basri, G., 2003 ApJ, 583, 451
- (28) Neuhäuser, R., Briceño, C., Comerón, F., Hearty, T., Martín, E. L., Schmitt, J. H. M. M., Stelzer, B., Supper, R., Voges, W. & Zinnecker, H., 1999 A&A 343, 883
- (29) Osten, R.A., Hawley, S.L., Bastian, T.S. & Reid, I.N., 2006, ApJ 637, 518
- (30) Phan-Bao, N., Osten, R.A., Lim, J., Martin, E.L. & Ho, P.T.P., 2007 ApJ 658, 553
- (31) Reid, I. N., Kirkpatrick, J. D., Gizis, J. E., Dahn, C. C., Monet, D. G., Williams, R. J., Liebert, J. & Burgasser, A. J., 2000, AJ 119, 369
- (32) Reid, I. N., Gizis, J. E., Kirkpatrick, J. D. & Koerner, D. W., 2001 AJ, 121, 489
- (33) Reid, I. N., Kirkpatrick, J. D., Liebert, J., Gizis, J. E., Dahn, C. C. & Monet, D. G., 2002 AJ, 124, 519
- (34) Reiners, A. & Basri, G., 2007, ApJ 656, 1121
- (35) Ruiz, M. T., Leggett, S. K. & Allard, F., 1997 ApJ 491, L107
- (36) Strauss, M. A., et al. 1999, ApJ 522L, 61
- (37) Treumann, R.A., 2006, A&A Rv 13, 229
- (38) Vrba, F. J., et al. 2004, AJ 127, 2948
- (39) Zarka, P., 1998 JGR 103, 20159