Electric and magnetic field optimization procedure for Penning trap mass spectrometers
Abstract
Significant systematic errors in high-precision Penning trap mass spectrometry can result from electric and magnetic field imperfections. An experimental procedure to minimize these uncertainties is presented for the on-line Penning trap mass spectrometer ISOLTRAP, located at ISOLDE/CERN. The deviations from the ideal magnetic and electric fields are probed by measuring the cyclotron frequency and the reduced cyclotron frequency, respectively, of stored ions as a function of the time between the ejection of ions from the preparation trap and their capture in the precision trap, which influences the energy of their axial motion. The correction parameters are adjusted to minimize the frequency shifts.
keywords:
Penning trap, ion motion, optimization, high-precision mass measurements.PACS:
07.75.h Mass spectrometers , 29.30.Aj Charged-particle spectrometers: electric and magnetic , 32.10.Bi Atomic masses, mass spectra, abundances, and isotopes , 96.60.Hv Electric and magnetic fields, , , , , , ††thanks: Present address: Millennium, Courtaboeuf, France , , ††thanks: Present address: CERN, Physics Department, 1211 Geneva 23, Switzerland , , .
1 Introduction
The mass of a nuclide is a fundamental property since it gives access to the binding energy which reflects the net effect of all forces at work in the nucleus [1]. It is of importance for various fields such as atomic physics, chemistry, nuclear structure, astrophysics, and the study of the weak interaction. Because the binding energy is small compared to the overall atomic mass, the required measurement accuracy is necessarily high.
Of the many techniques used for mass measurements, the Penning trap has emerged as the instrument of choice for high precision [2], achieving a relative uncertainty of down to the order of on stable nuclides [3], which allows the probing of even the atomic binding energy. For radioactive species, ISOLTRAP [4, 5], located at the ISOLDE/CERN facility [6], has been the pioneering Penning trap experiment for on-line mass measurements of short-lived nuclei, meanwhile routinely reaching a relative mass uncertainty of [7]. ISOLTRAP has continuously improved its accuracy and applicability. Examples are the installation of a linear radiofrequency quadrupole ion guide and beam buncher [8], the introduction of mass spectrometry of ions produced by in-trap decay [9], the systematic study of the measurement uncertainties using carbon-cluster ions [7, 10, 11], the implementation of a magnetron phase locking mechanism [12], and the use of Ramsey’s technique for the excitation of the ion motion [13, 14].
ISOLTRAP has been followed by other Penning trap mass spectrometers, which are in operation or in preparation [2, 15]: SMILETRAP using stable, highly charged ions [16], the Canadian Penning Trap [17], JYFLTRAP [18], SHIPTRAP [19], LEBIT [20], and TITAN [21]. New on-line traps are now being commissioned: MLLTRAP at Munich [22] and TRIGA-TRAP at the research reactor TRIGA Mainz [23]. For mass measurements in Penning traps, most of the systematic errors arise from misalignment and magnetic- and electric-field imperfections (see [4]). Therefore, all of the systems mentioned above have to deal with similar problems concerning the optimization of the electric and magnetic trapping fields. In the case of ISOLTRAP, the mechanical misalignment was minimized during the installation. The present work addresses the optimization of the magnetic and electric fields.
2 Ion motion in a Penning trap
In the following, the principles and properties of a Penning trap will be briefly reviewed as far as they apply to high-precision mass measurements. For a more detailed description of the theoretical aspects of Penning traps, see [24, 25, 26].
An ideal Penning trap is defined as the superposition of a homogeneous magnetic field and an electrostatic quadrupole field coaxial to the magnetic field. The combination of these particular fields allows to store charged particles in a well-defined volume. Also, there is an exact solution of the equations of motion in the case of a single stored ion.
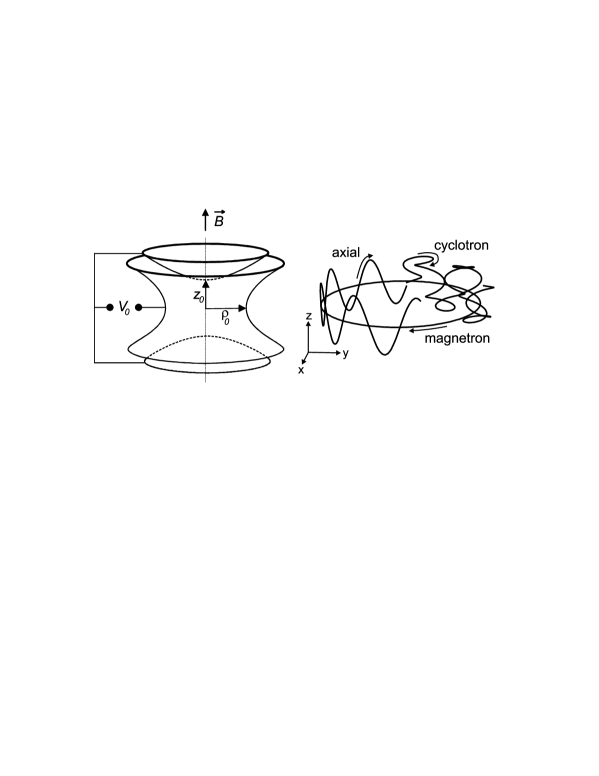
The electrostatic quadrupole field can be obtained by an electrode configuration as shown in Fig. 1 (left): two endcaps and a ring electrode, all being hyperboloids of revolution.
A potential difference (the trapping potential) between the endcaps and the ring electrode creates the quadrupolar potential
| (1) |
The characteristic trap dimension is determined by
| (2) |
where is the inner radius of the ring electrode and the distance between the endcaps, as shown in Fig. 1 (left).
In a pure magnetic field the stored particle with mass and charge performs a circular motion at the cyclotron frequency
| (3) |
In the presence of the quadrupolar electrostatic field the ion motion becomes a superposition of three independent harmonic motions as illustrated in Fig. 1 (right). The ions have an axial oscillation mode with frequency
| (4) |
and two circular radial modes, the cyclotron and the magnetron motion with eigenfrequencies (reduced cyclotron frequency) and (magnetron frequency), respectively, given by
| (5) |
The sum of the two radial eigenfrequencies obeys the relation:
| (6) |
A direct excitation of the ion motion at this sum frequency with an azimuthally quadrupolar rf field [25] allows a mass determination of the stored ion which relies only on the magnetic field . At the same time is a sensitive probe of the magnetic field strength experienced by the ions and will be used for the magnetic field optimization. In contrast, for the optimization of the electric field the reduced cyclotron frequency will be investigated.
Another important relation between the eigenfrequencies with respect to mass spectrometry is the so called Invariance Theorem [27]:
| (7) |
which is independent of field imperfections to first order. However, since only Eq. (6) is applied in high-precision Penning trap mass measurements on short-lived nuclides, the largest source of uncertainties are electric and magnetic field imperfections that cause a broadening and a shift of the cyclotron frequency resonance. These imperfections are due to the fact that a real Penning trap deviates from the ideal case in many aspects [4, 24]. In the following, the electric and magnetic field imperfections and their minimization are discussed using the ISOLTRAP mass spectrometer as an example.
3 Experimental setup
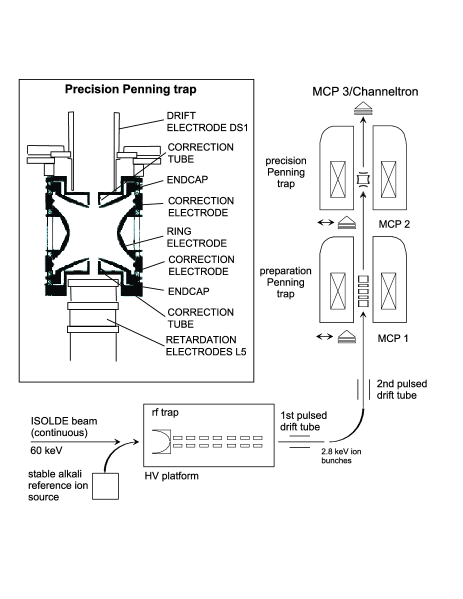
ISOLTRAP is a high-precision Penning trap mass spectrometer consisting of three main parts (see Fig. 2) [5]: First, a gas-filled radio-frequency quadrupole (RFQ) trap serves as a cooler and buncher to adapt the 60-keV ISOLDE ion beam to the ISOLTRAP requirements with respect to kinetic energy, time structure, and beam emittance [8]. Second, a high-capacity cylindrical Penning trap is used for isobaric cleaning of the beam by exploiting a mass-selective helium-buffer gas cooling technique [29] with a resolving power of up to [30]. Finally, the cooled ion bunch is transferred to the precision Penning trap where the mass measurement is carried out by the determination of the cyclotron frequency of the stored ions, using a time-of-flight (ToF) detection method [31]: After a dipolar radiofrequency (rf) excitation of the ions to a magnetron orbit of about 0.7-1.0 mm radius [12], the initially pure magnetron motion is converted into cyclotron motion by a quadrupolar rf field [32]. At a full conversion from initially pure magnetron to pure cyclotron motion is obtained. In this case, the orbital magnetic moment and the radial kinetic energy are increased. The ions are ejected from the trap and their ToF to an ion detector is measured. Since there is an axial acceleration of the ions in the fringe field of the superconducting magnet, which is proportional to , the shortest ToF is observed for . Figure 3 shows a typical resonance where the ToF is measured as a function of the frequency of the excitation field applied. The mass of the ion of interest is obtained from the comparison of its cyclotron frequency with that of a well-known ”reference mass”, provided from either ISOLDE or an off-line reference ion source. The measurement procedure as well as the study of the accuracy limit and systematic uncertainties are described in detail in [7].
3.1 Magnetic field imperfections
In order to perform a high-precision cyclotron-frequency measurement, excellent homogeneity and temporal stability of the magnetic field are required. Here, the possibility to minimize magnetic field inhomogeneities by a dedicated optimization procedure is addressed. The temporal stability is discussed in [7, 33].
Magnetic field imperfections arise from the homogeneity limits of commercial superconducting magnets: nowadays an inhomogeneity of typically can be provided over a volume of about a cubic centimeter. The volume typically probed by the ions during precision mass measurements results from the amplitudes mm and mm of the radial and axial motional modes, respectively. During the optimization the axial amplitudes are varied and increased on purpose by up to an order of magnitide (see below). For comparison, the precision trap has dimensions mm and mm. In addition to the intrinsic inhomogeneity of the superconducting magnet, the homogeneity can be disturbed if materials (including trap components) with a magnetic susceptibility are introduced into the magnetic field. To minimize this problem, the ISOLTRAP electrodes are made from oxygen-free copper and the amount of material closest to the trap center was minimized.
There are higher order magnetic field components that must be minimized. Due to the mirror symmetry (with respect to the -plane through the trap center) only even components occur. In addition, odd terms do not matter since they do not result in frequency shifts, assuming that the average center of the ion motion does not change. The frequency shift caused by magnetic field inhomogeneities can be approximated by [24]
| (8) |
where denotes the relative strength of the lowest-order component of magnetic inhomogeneities.
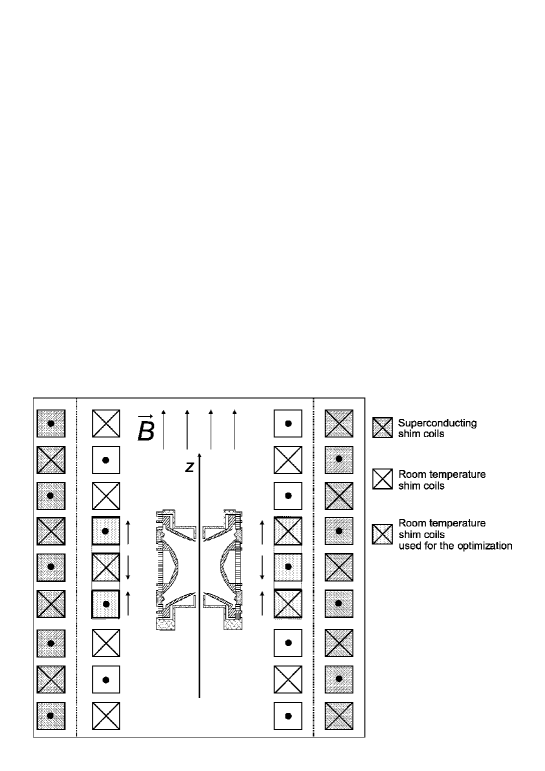
The precision Penning trap (see inset of Fig. 2) is placed in a 5.9-T magnetic field generated by a superconducting solenoid. To provide a homogeneous magnetic field the magnet is equipped with a set of superconducting shim coils and a set of room-temperature shim coils (see Fig. 4). The current on all superconducting shim coils was optimized during the installation of the magnet. For practical use, only the room-temperature shim coils are optimized routinely. The three coils closest to the trap (dashed boxes in Fig. 4) have the strongest influence on the field distribution and thus on the field homogeneity along the -axis inside the trap. Consequently, the optimization parameter is the current applied simultaneously to these three room-temperature shim coils. This current induces a magnetic field oriented in one direction for the two outer coils and in the opposite direction for the inner one (see Fig. 4), thus allowing to shim the -component of the magnetic field, which can be approximated along the axial direction by
| (9) |
Only the -component is addressed since the axial amplitudes are in general much larger than the radial ones and odd-terms cancel out.
3.2 Electric field imperfections
Electric field imperfections arise from deviations of the mechanical trap construction from the ideal hyperbolical shape, such as holes in the endcaps for injection or ejection of ions and the unavoidable truncation of the electrodes. Thus, the electric field inside the trap does not follow the pure quadrupolar form. However, it needs to be as ideal as possible in order to assure the exact condition given in Eq. (6).
For a real Penning trap the potential inside the trap can be expanded in the form [25]:
| (10) | |||||
with as the quadrupole component. In an ideal trap and for . The frequency shift [4], which is due to the octupole (represented by ) and dodecapole () contributions, depends on the ion-motion amplitudes , , of the cyclotron, magnetron, and axial motion, respectively, and is given by
| (11) | |||||
To minimize the imperfections, additional electrodes are implemented in the precision Penning trap: two correction rings and two correction tubes, as shown in Fig. 2, to eliminate and . Without these additional electrodes the multipole contributions to the potential are , , and as deduced from simulations. The correction ring electrodes lead to contributions of and and have only an influence on the -value of the order of . Similarly, the correction tube electrodes lower the multipole contributions to and and have an effect on of the order of . The remaining deviations from a pure quadrupolar field are far away from the ion trajectory, since for typical precision mass measurements the amplitude of the axial motion does not exceed 1 mm.
4 Field-optimization results
4.1 Probing the field imperfections
The electric field optimization consists of varying the voltages of the correction rings and correction tubes and monitoring the effect on the reduced cyclotron frequency while the trapping conditions are varied. After the buffer-gas cooling in the first Penning trap the axial energy of the ions is thermalized to room temperature. From there the ions are ejected and accelerated towards the precision Penning trap. They are captured by, first, retarding them in the trap center while the potential of the lower endcap has been lowered and, second, restoring the potential of the lower endcap to its original value. The capture time , a key parameter in the field-optimization procedure, is defined as the time between the ejection from the preparation Penning trap and the rising of the lower endcap potential in the precision trap.
Depending on both the initial axial energy distribution of the ions and the capture time in the precision trap, the stored ions have different axial energies and thus exhibit trajectories which may cover a smaller or larger volume in the trap. Therefore, the magnetic field and the quadrupolar electric field in the precision trap should have as little as possible deviation from the ideal fields in order to give the same conditions irrespective of the initial axial energy after capturing. By the same token, the resonance frequencies can be measured as a function of the capture time in order to probe the field imperfections.
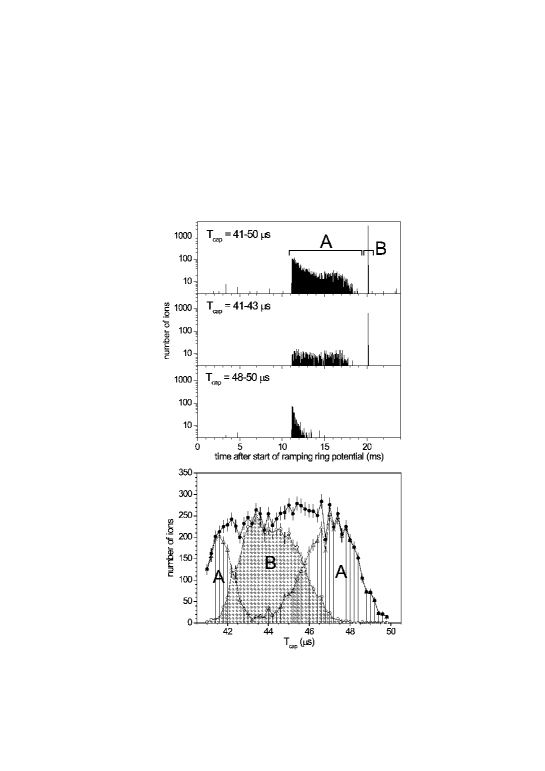
In general, before ejection towards the last ion detector (see Fig. 2), the trapping potential depth is lowered by ramping of the potential of the ring electrode (see [28] for details). In order to demonstrate the influence of the capture time on the axial energy of the ions, the release of ions from the trap during this ramping and at the moment of pulsing the endcap is monitored as a function of the capture time. Fig. 5 (top) shows three ToF spectra accumulated for different ranges of the capture time , where the time marks the start of the ramping of the ring elecrode potential from V to V, which lasts 17.5 ms.
Ions with a higher axial energy than the trapping potential depth are released and may reach the detector producing a signal in the time range ”A”. After 19.5 ms the endcap potential is pulsed and all ions still stored in the trap are ejected. These ions produce the signal in the time range ”B”. While stored in the trap, they have low axial energies and thus low axial amplitude. In the normal operation mode for precision mass measurements, only the corresponding capture time is applied. For the present study, however, the capture time will be varied systematically to observe its effect on the resonance frequencies.
Fig. 5 (bottom) gives the number of ions before and during the ramping of the ring electrode (open triangles) and after the ramping (open circles) as a function of the capture time. The full circles correspond to the sum of all ions stored in the precision trap after capturing. The axial energy of the stored ions after capturing is mainly influenced by the initial energy of the ions as they leave the preparation trap: ions with low axial kinetic energy arrive at a later time than ions with higher axial kinetic energy relative to the capture time in the precision trap. In addition, ions with high axial kinetic energy may be reflected back to the trap center by the upper endcap potential. Altogether, an asymmetric distribution of ions with high and low axial kinetic energy is obtained upon variation of the capture time.
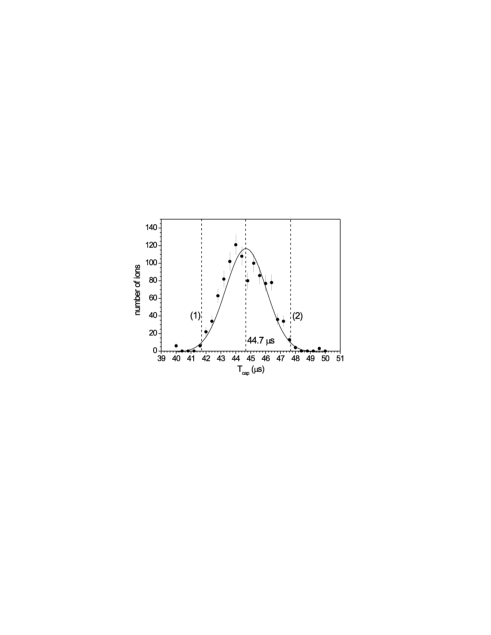
In order to investigate the field corrections, the capture time is varied around the optimum value as shown in Fig. 6 for 85Rb+ ions. For non-optimal capture times, the axial energy of the ions will be larger and deviations from the ideal electromagnetic fields can be probed by measuring the change of the ion-motion frequencies as compared to the case of the optimal capture time. Since is directly related to and not to , we measure to probe the magnetic field and (related to ) for the electric field optimization.
4.2 Magnetic field
The trim parameter for the magnetic-field homogeneity along the -axis is the current applied to the three room-temperature shim coils close to the trap (see Fig. 4). The best value of the shim-coil current will optimize the magnetic field homogeneity over the large axial distance the ions cover, hence minimizing frequency variations for deviating capture times and axial ion energies. To check the magnetic field homogeneity, the cyclotron frequency is taken as a probe, since it directly depends on the magnetic field (see Eq. (6)). The cyclotron frequency is determined via the measurement of time-of-flight resonance curves (see above) and frequency changes are probed for different capture times , i.e. in the present case between 41.7 s (1) and 47.7 s (2) for 85Rb+ (see Fig. 6), and different shim-coil currents.
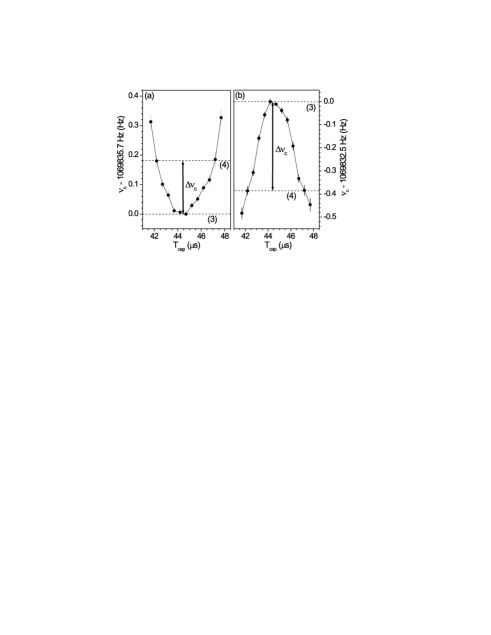
The importance of such an optimization is shown in Fig. 7, which gives the cyclotron frequency as a function of the capture time for two extreme values of the shim-coil current. The corresponding relative frequency deviation for s for each current setting is . Note that there is a shift in absolute frequency as well as an inflection in the frequency variations. This is due to the fact that the correction coil design was made such that a contribution is minimized and the contribution to the next higher order term maximized. The shift is a small left-over because the cancelation of from the outer and the inner coil is not perfect.
To find the optimum value for , i.e. for which , the shim-coil current is varied and the frequency shift between two different capture times (marked as (3) with = 44.7 s and (4) with = 47.2 s in Fig. 7) is measured. A capture time of 47.7 s was not used because of the low capturing efficiency for this value and thus the resulting long measurement time. Moreover, it is expected that during a ”normal” mass measurement ions with the respective amount of axial energy will not be present in the trap. The frequency variation was measured for several shim-coil currents and the results are plotted in Fig. 8. The optimum value was deduced from a linear fit to the data points, yielding mA.
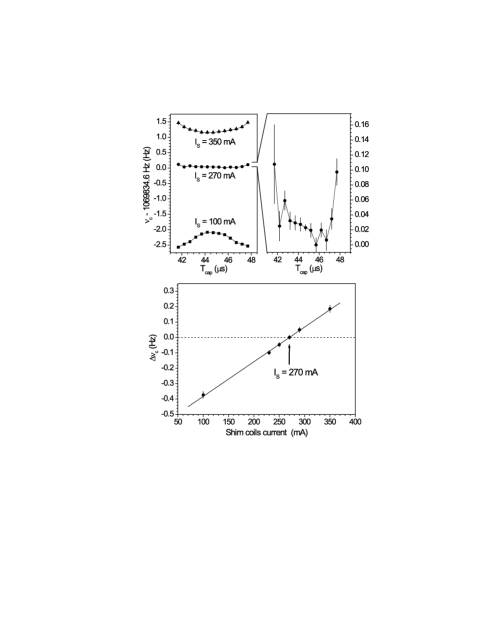
Cyclotron frequencies obtained with this optimum value are presented in Fig. 8 (right). The relative deviation is well below for a capture time variation of 1.5 s. For a typical uncertainty in the capture-time setting of about 0.3 s the relative frequency shift is well below . Figure 8 (left) also illustrates the overall behavior of the cyclotron frequency as a function of the applied shim-coil current, where an offset of the absolute frequency and a relative frequency shift can be observed as a function of . The latter lead to systematic errors thus pointing out the importance of the magnetic field optimization and on making sure that the ions are trapped in the center on average.
4.3 Electric field
To minimize electric-field imperfections, two correction rings and tubes are used as shown in Fig. 2. The correction rings correct for the finite dimension of the electrodes while the correction tubes compensate the discontinuity in the endcap surface due to the ion entrance and exit holes. The influence of the rings is by far much smaller than the influence of the tubes (see section 4.3.2).
4.3.1 Correction tubes
The two correction tubes are called ”Lower Correction Tube” (LCT), and ”Upper Correction Tube” (UCT). In general, the same voltage is applied to both tubes. This voltage is the parameter used for the optimization of the electric field. Again, the capture time is used to probe the effects of the detuned field on the cyclotron frequency.
The optimum value of the correction-tube voltage is found when an ideal electric field is realized in the trap and therefore no frequency shifts occur for all capture times between 41.7 s and 47.7 s (see Fig. 6). For the electric field optimization, the reduced cyclotron frequency is monitored (see Eq. (5)). The magnetic field optimization was performed first to ensure that and thus are constant along the axial direction of the trap. Consequently the variation of is directly related to the electric field via with the approximation .
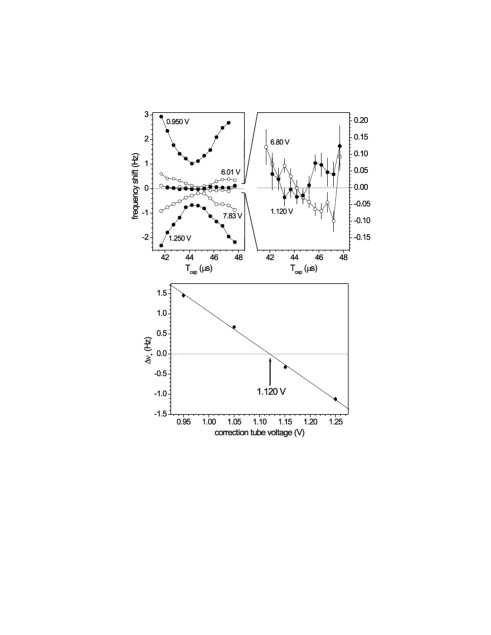
Figure 9 (top) presents a measurement of the reduced cyclotron frequency as a function of the capture time for different values of the correction-tube and -ring voltage. The observed curvatures with large relative frequency deviations show the importance of the electric-field optimization.
To determine the optimum value, the frequency difference between two different capture times (s and s) is measured as a function of the correction-tube voltage. The results are plotted in Fig. 9 (bottom). The optimum value with a minimal frequency shift was found by interpolation to be 1.120 V . Results with this optimum value are presented in Fig. 9 (top). Again, in addition to the frequency variations caused by the variation of the capture time, shifts of the frequency at the optimal time are observed for different voltages. After the optimization the deviation is minimized to well below for the capture-time range s. The remaining deviations may be due to temperature fluctuations in the ISOLDE hall [33].
4.3.2 Correction rings
Figure 9 (top) shows a comparison of the influence of the correction rings and the correction tubes. For this study the optimal value for the voltage applied to the correction rings and to the correction tubes (i.e. to obtain a flat dependence as a function of ) was used and also two extreme values chosen in the same proportion for the rings and the tubes. For the measurements of the influence of the correction rings the correction tubes were set to the optimum value of 1.120 V. Vice versa during the measurement of the influence of the correction tubes, the correction rings were set to the optimum value of 6.80 V.
The influence of the correction rings is about five times smaller than that of the tubes, so the optimization should be focused on the tubes. This was expected from the simulations as mentioned above, which show a stronger influence of the tubes. The difference between the behavior observed in other systems [34] and the ISOLTRAP result is due to the fact that the axial motion of the ions is not cooled in the precision trap. So, in the case of wrong capture times, the ions have larger axial amplitudes, come closer to the holes in the endcaps and thus are more influenced by the correction tubes.
5 Summary and conclusion
In order to achieve accurate mass values employing Penning trap mass spectrometry the electric and magnetic fields in the Penning trap have to be optimized to correct for deviations arising from geometrical trap imperfections and homogeneity limits of the superconducting magnet. The procedure for the optimization of the electric and magnetic field for the precision Penning trap of ISOLTRAP has been described and demonstrated. The optimization was performed by varying the capture time, i.e. the delay period between the ejection of iond from the preparation trap and the capturing in the precision trap, thus giving them different axial energy, i.e. changing the amplitude of their axial oscillation. The magnetic field was optimized first to avoid any influence on the electric field optimization.
Acknowledgments
This work was supported by the German Federal Ministry for Education and Research (BMBF) under contract no. 06GF151 and 06MZ215, by the Helmholtz Association of National Research Centers (HGF) under contract no. VH-NG-037, by the European Commission under contract no. HPRI-CT-2001-50034 (NIPNET), by the Marie Curie fellowship network HPMT-CT-2000-00197, and by the French IN2P3.
References
- [1] D. Lunney, J.M. Pearson, and C. Thibault, Rev. Mod. Phys. 75 (2003) 1021.
- [2] K. Blaum et al., Phys. Rep. 425 (2006) 1.
- [3] S. Rainville, J.K. Thompson, and D.E. Pritchard, Science 303 (2004) 334.
- [4] G. Bollen et al., Nucl. Instrum. and Meth. A 368 (1996) 675.
- [5] M. Mukherjee et al., Eur. Phys. J. A 35 (2008) 1.
- [6] E. Kugler, Hyperfine Interact. 129 (2000) 23.
- [7] A. Kellerbauer et al., Eur. Phys. J. D 22 (2003) 53.
- [8] F. Herfurth et al., Nucl. Instrum. and Meth. A 469 (2001) 254.
- [9] A. Herlert et al., New J. Phys. 7 (2005) 44.
- [10] K. Blaum et al., Eur. Phys. J. A 15 (2002) 245.
- [11] K. Blaum et al., Anal. Bioanal. Chem. 377 (2003) 1133.
- [12] K. Blaum et al., J. Phys. B 36 (2003) 921.
- [13] S. George et al., Phys. Rev. Lett. 98 (2007) 162501.
- [14] S. George et al., Int. J. Mass Spectrom. 264 (2007) 110.
- [15] Special issue on Ultra-Accurate Mass Spectrometry and Related Topics, edited by L. Schweikhard and G. Bollen [Int. J. Mass Spectrom. 251 (2006) 85].
- [16] I. Bergström et al., Nucl. Instrum. and Meth. A 487 (2002) 618.
- [17] G. Savard et al., Int. J. Mass Spectrom. 251 (2006) 252.
- [18] A. Jokinen et al., Int. J. Mass Spectrom. 251 (2006) 204.
- [19] S. Rahaman et al., Int. J. Mass Spectrom. 251 (2006) 146.
- [20] R. Ringle et al., Int. J. Mass Spectrom. 251 (2006) 300.
- [21] J. Dilling et al., Int. J. Mass Spectrom. 251 (2006) 198.
- [22] D. Habs et al., Eur. Phys. J. A 25 S01 (2005) 57.
- [23] J. Ketelaer et al., Nucl. Instrum. and Meth. A, submitted (2008).
- [24] L.S. Brown and G. Gabrielse, Rev. Mod. Phys. 58 (1986) 233.
- [25] G. Bollen et al., J. Appl. Phys. 68 (1990) 4355.
- [26] M. Kretzschmar, Phys. Scripta 46 (1992) 545 and 555.
- [27] L.S. Brown and G. Gabrielse, Phys. Rev. A 25 (1982) 2423.
- [28] C. Yazidjian et al., Hyperfine Interact. 173 (2006) 181.
- [29] G. Savard et al., Phys. Lett. A 158 (1991) 247.
- [30] H. Raimbault-Hartmann et al., Nucl. Instrum. Meth. B 126 (1997) 378.
- [31] G. Gräff, H. Kalinowsky and J. Traut, Z. Phys. A 297 (1980) 35.
- [32] M. König et al., Int. J. Mass Spectrom. Ion Process. 142 (1995) 95.
- [33] M. Marie-Jeanne et al., Nucl. Instrum. and Meth. A 587 (2008) 464.
- [34] Ch. Gerz, D. Wildsorf, and G. Werth, Nucl. Instrum. and Meth. B 47 (1990) 453.