Investigation of the shear-mechanical and dielectric relaxation processes in two mono-alcohols close to the glass transition
Abstract
Shear-mechanical and dielectric measurements on the two monohydroxy (mono-alcohol) molecular glass formers 2-ethyl-1-hexanol and 2-butanol close to the glass transition temperature are presented. The shear-mechanical data are obtained using the piezoelectric shear-modulus gauge method covering frequencies from to . The shear-mechanical relaxation spectra show two processes, which follow the typical scenario of a structural (alpha) relaxation and an additional (Johari-Goldstein) beta relaxation. The dielectric relaxation spectra are dominated by a Debye-type peak with an additional non-Debye peak visible. This Debye-type relaxation is a common feature peculiar to mono-alcohols. The time scale of the non-Debye dielectric relaxation process is shown to correspond to the mechanical structural (alpha) relaxation. Glass-transition temperatures and fragilities are reported based on the mechanical alpha relaxation and the dielectric Debye-type process, showing that the two glass-transition temperatures differ by approximately and that the fragility based on the Debye-type process is a factor of two smaller than the structural fragility. If a mechanical signature of the Debye-type relaxation exists in these liquids, its relaxation strength is at most and of the full relaxation strength of 2-butanol and 2-ethyl-1-hexanol respectively. These findings support the notion that it is the non-Debye dielectric relaxation process that corresponds to the structural alpha relaxation in the liquid.
I Introduction
A class of often investigated glass-forming liquids is the hydrogen-bonding liquids, among which the alcohols are a much studied subclass (for a compilation of references to classical results prior to 1980 see Ref. Böttcher and Bordewijk, 1980, section IX-c.1). Alcohols are normally classified into those containing one hydroxyl group (the mono-alcohols) and those with two or more hydroxyl groups.
During the 1950’s it was observed that the main relaxation in most mono-alcohols, contrary to the main relaxation in other liquids, can be represented by a single relaxation time — they follow the Debye prediction Davidson and Cole (1951). It was further realized that additional relaxation processes exist at frequencies above the main Debye-type relaxation. One additional process is normally observed, but in some cases two processes can be resolved (see, e.g., Ref. Cole and Davidson, 1952). Comparisons between mechanical and dielectric measurementsKono et al. (1966); Litovitz and McDuffie (1963) further showed that when the main dielectric relaxation is of Debye-type its time scale is separated from the mechanical time scale, but no explanation was given for this. It was further discussed to what extent the Debye-type process corresponds to the mechanical relaxation, as e.g. stated by Johari and GoldsteinJohari and Goldstein (1971) discussing the importance of mechanical measurements near the glass transition temperature: “such a study can answer an important question: whether or not the same molecular motions are involved in the volume, shear, and dielectric relaxation of H-bonded liquids”.
During the last decade a number of studiesMurthy (1996a, b); Hansen et al. (1997); Kudlik et al. (1997); Wendt and Richert (1998); Murthy and Tyagi (2002); Wang and Richert (2004, 2005a, 2005b); Wang et al. (2005); Huth et al. (2007); Wang et al. (2008); El Goresy and Böhmer (2008) (see below for details) have indicated that the low-frequency Debye-type peak is decoupled form the mechanical relaxation and that the non-Debye dielectric peak at higher frequencies reflects the structural alpha relaxation. In this paper we shall term the two lowest frequency dielectric relaxations the Debye-type relaxation and the alpha relaxation, respectively.
This scenario offers an explanation for the earlier observations and it gives the possibility that the behavior of mono-alcohols follows that of other glass formers, except for the existence of the Debye-type dielectric peak.
Two classes of arguments are generally given for this idea: Comparisons of time scales/glass-transition temperatures and the lack of a Debye-type peak in other measurement types. A large number of experiments and comparisons exists including the following: Comparison with calorimetric measurementsMurthy (1996a, b); Comparison with photon correlation spectroscopy probing the density-density correlationsHansen et al. (1997); Comparison with the time scale found from viscosity data Hansen et al. (1997); Wang and Richert (2004); Analysis of the alpha–beta relaxationKudlik et al. (1997); Solvation dynamics probing mechanical relaxation of the liquid Wendt and Richert (1998); Dielectric and calorimetric investigation of mixtures of mono-alcohols with other substances Murthy and Tyagi (2002); Wang and Richert (2005a, b); Wang et al. (2005); frequency-dependent specific heat measurements Huth et al. (2007); systematic comparison to DSC calorimetric measurementsWang et al. (2008); dielectric studies of mixturesEl Goresy and Böhmer (2008).
Except for the early ultrasonic-based measurementsLyon and Litovitz (1956); Kono et al. (1966) no direct comparison exists, to the best of our knowledge, of the macroscopic mechanical relaxation spectra and dielectric relaxation spectra of mono-alcohols.
Such measurements directly reveal if the non-Debye relaxation mode seen in dielectrics is in accordance with the shear-mechanical structural alpha relaxation. Shear-mechanical relaxation data are furthermore generally a good complement to dielectric dataJakobsen et al. (2005), and such investigations can also explore to what extent a shear-mechanical Debye-type relaxation exists.
In this study we present shear-mechanical investigations in the temperature range down to the glass transition temperature together with complementary dielectric spectroscopy investigation to allow for direct comparison.
The two liquids studied are 2-butanol, and 2-ethyl-1-hexanol. The reason for not studying simple normal-alcohols like ethanol, is that such systems easily crystallize. The chosen systems represent two ways of introducing steric hindrances in the system, hence improving the glass-forming ability.
Both liquids have been investigated earlier. For early results on 2-butanol see, e.g., Refs. Dannhauser and Cole, 1955; Murthy and Nayak, 1993 and for 2-ethyl-1-hexanol see, e.g., Refs. Wemelle, 1957; Bondeau et al., 1978; Murthy, 1996b; Murthy and Tyagi, 2002; Huth et al., 2007; Wang et al., 2008.
II Experimental
The measurements were performed using a custom-built setupChristensen and Olsen (1995); Igarashi et al. (2008a, b). The temperature is controlled by a custom-built cryostat with temperature fluctuations smaller than (see Ref. Igarashi et al., 2008a for details on the cryostat). The same cryostat was used for all measurements, thus ensuring equal temperatures and directly comparable results. The electrical signals were measured using a HP 3458A multimeter in connection with a custom-built frequency generator in the frequency range of – , and a Agilent 4284A LCR-meter in the frequency range of – (see Ref. Igarashi et al., 2008b for details on the electrical setup).
The shear-mechanical relaxation data were obtained using the piezoelectric shear modulus gauge (PSG) methodChristensen and Olsen (1995). This method has a wide frequency range (up to –Hz) and is optimized for measuring moduli in the range of –, corresponding to typical moduli of liquids close to the glass transition temperature. The dielectric data were obtained using a multilayered gold-plated capacitor with a empty capacitance of .
2-ethyl-1-hexanol (, CAS number 104-76-7) and 2-butanol (, CAS number 78-92-2, racemic mixture) was acquired from Aldrich and used as received. To ensure that the samples did not change characteristics (e.g., due to absorption of water) dielectric measurements were performed on the newly opened bottles and repeated at the end of the studies. For both liquids the only observable changes were in the unimportant low-frequency contributions from conduction.
The raw datafoo (a) obtained consist of frequency, , scans of the complex dielectric constant , and the complex shear modulus . Each scan was taken at constant temperature in thermal equilibrium, stepping down in temperature.
Equilibrium was ensured by repeating some of the frequency scans on reheating the sample from the lowest temperature. Repetition of parts of the shear mechanical measurements showed that the uncertainty on the overall absolute level of the shear modulus is rather large in the case of 2-ethyl-1-hexanol (), it is much better for 2-butanol. The influence from this experimental uncertainty on the position of the loss peaks are however minor (at most decade).
| 2-butanol | 111In accordance with calorimetric of from Ref. Murthy and Nayak, 1993. | |||
| 2-ethyl-1-hexanol | 222In accordance with calorimetric of from Ref. Wang et al., 2008 and of from Ref. Murthy, 1996b, and dielectric alpha-relaxation of from Ref. Wang et al., 2008. | 333In accordance with the value of reported in Ref. Wang et al., 2008, and reported in Ref. Murthy, 1996b (using as definition of ). | 444Comparable to the value of reported in Ref. Wang et al., 2008 on the basis of dielectric data. | 555In accordance with the value of reported in Ref. Murthy, 1996b. |
III Results and discussions
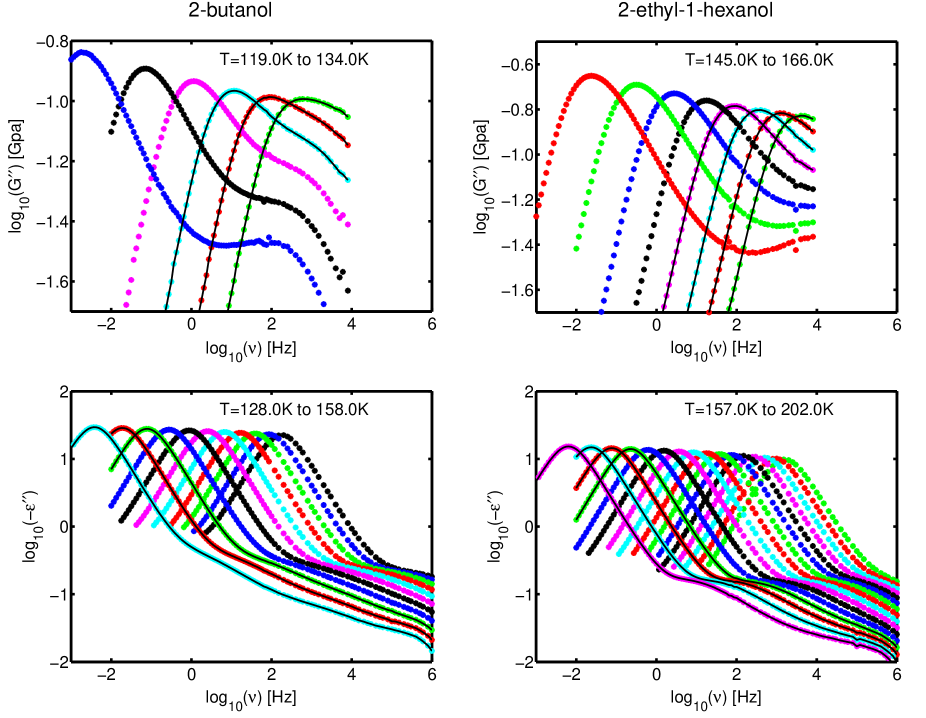
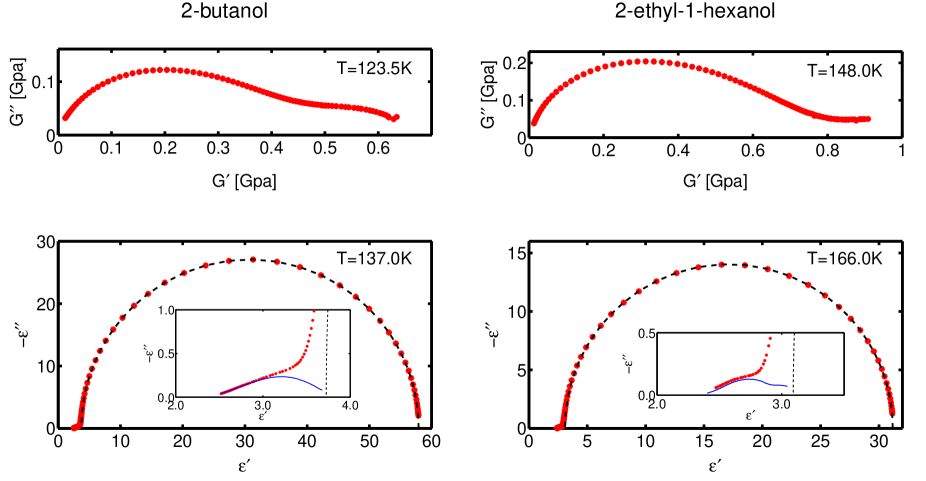
A selection of the obtained dielectric spectra is shown in Fig. 1 represented as the dielectric loss as a function of frequency (minus the imaginary part of the complex dielectric constant, ). The dielectric data are furthermore illustrated in Fig. 2 as a Nyquist plot at a representative temperature. The dielectric spectrum follows the general pattern for mono-alcohols with a dominant Debye-type relaxation, and a minor second relaxation — the alpha relaxation.
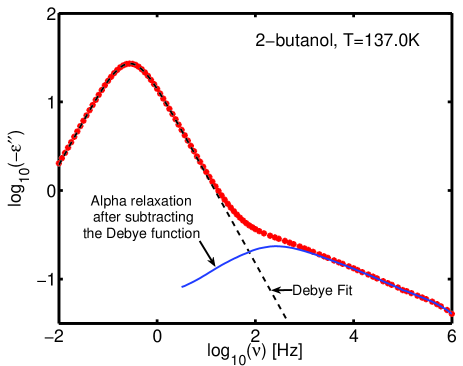
A common way (e.g. Refs. Cole and Davidson, 1952; Dannhauser and Cole, 1955; Murthy and Nayak, 1993; Hansen et al., 1997; Wang and Richert, 2004; El Goresy and Böhmer, 2008) to separate the minor alpha process and possible Johari-Goldstein beta processes from the Debye-type relaxation process is to assume additivity of the processes in the dielectric susceptibility (corresponding to statistical independent dipole-moment fluctuations of the two processes). This is either done by fitting a sum of a Debye function and a Havriliak-Negami function (and possible a Cole-Cole function for the beta process), or by subtracting the fit of a Debye function from the raw data (most common in elder studies, e.g., Ref. Cole and Davidson, 1952).
In this paper we assume additivity of the processesfoo (b) and subtract the Debye function in order to analyze the residual, this procedure is illustrated in Fig. 3. The fit to the Debye function is also shown in the Nyquist plot in Fig. 2, illustrating the quality of the fit with respect to both real and imaginary part of the dominant dielectric relaxation process.
A selection of the shear-mechanical data is shown in Fig. 1 as mechanical loss, , as function of frequency. Figure 2 furthermore shows the shear-mechanical relaxation spectra illustrated as a Nyquist plot at a typical temperature. The general pattern for liquids close to the glass transition temperature is observed, with a pronounced non-Debye alpha relaxation and a smaller Johari-Goldstein beta relaxation. The beta relaxation is much stronger in the shear-mechanical relaxation spectrum than in the dielectric spectrum for these liquids (the existence of a dielectric beta relaxation for these systems has been reported in the literatureMurthy and Nayak (1993); Murthy (1996b)), consistent with previous observation on molecular liquidsJakobsen et al. (2005) and the Gemant-DiMarzio-Bishop modelNiss et al. (2005).
III.1 Temperature dependence of the dynamics
To analyze the time scales associated with the observed processes and their temperature dependencies, the loss-peak frequencies () were determined. These are shown in Fig. 4. For the alpha process in the shear-mechanical data and the Debye-type process in the dielectric data, it was determined directly from the raw data. For the alpha relaxation in the dielectric data the loss peak was found after subtracting the Debye function. To ensure consistency in the analysis the dielectric alpha loss peak was only calculated at temperatures where the loss-peak of the Debye-type relaxation was observed.
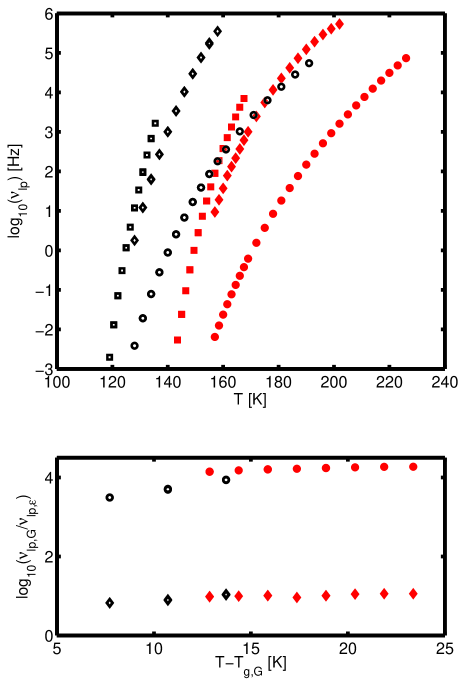
: shear-mechanical alpha relaxation, : dielectric Debye-type relaxation, : dielectric alpha relaxation. Open symbols: 2-butanol, Closed symbols: 2-ethyl-1-hexanol.
The dielectric alpha-peak frequency closely follows the peak frequency of the shear-mechanical alpha process. This is further illustrated in the lower part of Fig. 4 where the “decoupling” index (defined as ) is shown for the dielectric processes (Debye-type and alpha process) relative to the mechanical alpha process. The mechanical and dielectric alpha-time scale are separated by approximately one decade in frequency, whereas the mechanical alpha and the dielectric Debye-type process are separated by four orders of magnitude in frequency. The separation between the loss-peak positions can also directly be seen on Fig. 1 for the temperatures where both shear-mechanical and dielectric data exists (indicated by full lines). The separation between the shear-mechanical and dielectric alpha processes is in agreement with previous comparisons of the shear-mechanical and dielectric alpha time scaleLitovitz and McDuffie (1963); Kono et al. (1966); Menon et al. (1994); Christensen and Olsen (1994); Zorn et al. (1997); Deegan et al. (1999); Schröter and Donth (2000); Jakobsen et al. (2005). From Fig. 1 it can be seen that the mechanical beta relaxation may influence the loss peak position of the shear-mechanical alpha relaxation at high temperatures. From e.g. Ref. Jakobsen et al., 2005 we know that such influences only change the decoupling index between the shear mechanic and dielectric alpha relaxations slightly, such an effect can therefor not disturb the general observations. It is further noticeable that no changes can be observed in the temperature dependence of the shear-mechanical relaxation time around the temperature where the Debye-type process falls out of equilibrium on the time scale of the experiment.
The glass transition temperature(s) was determined from the loss peak frequenciesfoo (c) as the temperature where . The numbers for the dielectric Debye-type relaxation and the shear-mechanical alpha relaxation are given in table 1. The huge separation in time scale between the two processes results in a separation of of for 2-butanol and for 2-ethyl-1-hexanol.
for the mechanical alpha relaxation and dielectric Debye-type relaxation are as given in table 1. For the dielectric alpha relaxation from the mechanical alpha relaxation was used. The reason for this is that the data do not allow for direct determination of the for the dielectric alpha relaxation without extensively extrapolation, and that the two temperature normally not are to different due to the small decoupling between the processes.
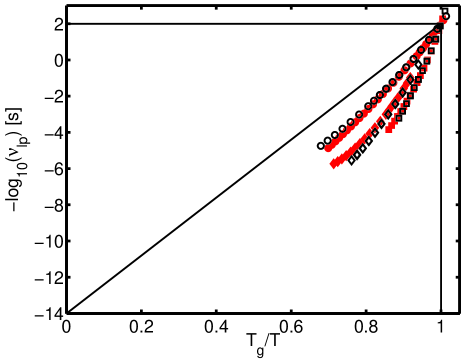
Based on the loss-peak frequencies an Angell plot was constructed as shown in Fig. 5. The two substances show a remarkable similarity in the temperature dependence of the characteristic time when plotted this way. The dielectric alpha process furthermore closely follows the tendencies of the mechanical alpha process.
The fragility indexPlazek and Ngai (1991); Böhmer and Angell (1992); Böhmer et al. (1993) is reported in table 1. A clear difference is seen between the fragility index if defined from the dielectric Debye-type process or from the mechanical alpha process. The Debye-type process leads to a classification of the liquid as much stronger than the mechanical alpha relaxation.
The difference in temperature dependence of the Debye-type process and the structural relaxation will lead to a merging of the two processes at low temperatures, if the trends continuous. This is of course close to impossible to test experimentally as the relaxation times at such low temperatures become very long. The possibility of a low temperature merge of the Debye-type process and the structural alpha process has been discussed earlier in Ref. El Goresy and Böhmer, 2008 and Kalinovskaya and Vij, 2000. The idea is furthermore supported by the compilation of data presented in Ref. Wang and Richert, 2004, the data generally show a decrease in the difference between the loss peak frequency of the dielectric Debye-type relaxation and dielectric alpha relaxation with decreasing temperature.
III.2 Spectral shape
The spectral shape of the shear-mechanical alpha peak, was characterized by calculation of the minimum slope in a log-log plot as shown on Fig. 6. Similar data have been reported for shear-mechanical relaxation studies on other systems by our groupJakobsen et al. (2005); Maggi et al. (2008) based on the ideas presented in Ref. Olsen et al., 2001. Comparing to these previous results it is observed that the two liquids follow the general trend of liquids with a mechanical beta relaxation. The minimum slope is in the range to close to , still decreasing upon cooling (most prominent for 2-butanol), possible towards as conjectured in Refs. Dyre, 2005, 2006, 2007.
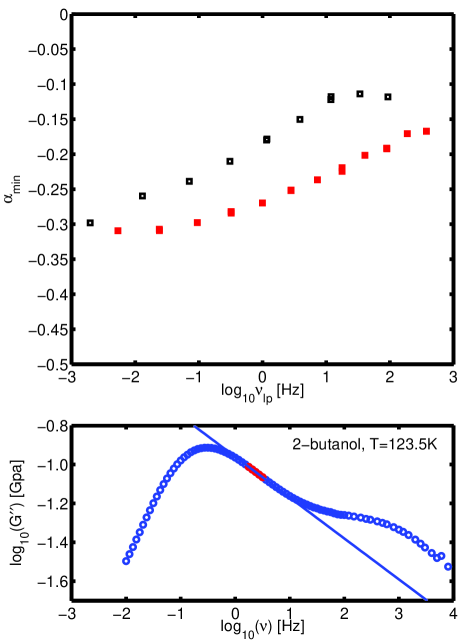
This shows that the mechanical alpha-relaxation spectra, hence the mechanical relaxation processes, are similar to what is generally observed for glass-forming liquids.
III.3 Limits on a mechanical Debye-type process
A small low-frequency peak was observed in the raw data obtained by the shear-mechanical transducer. Closer investigations, however, showed that this was not a mechanical signal of the Debye-type process, but a “spillover effect” of the large dielectric signal. This effect is caused by wetting of the edges of the piezoceramic discs in the transducer and the large dielectric strength of the investigated systems, it is equivalent to sometimes observed conduction contributions in the raw data.
We can, of course, not entirely exclude that a mechanical signal is hiding below this dielectric spillover signal, but we are able to put limits on the maximal relaxation strength. In the case of 2-butanol the signal was partly eliminated by a correction procedure using data from a mechanical empty, but still wetted transducer. From the resulting shear-mechanical spectra one concludes that a shear-mechanical relaxation process corresponding to the Debye-type process in the dielectrics must have a relaxation strength below (corresponding to at most of the full relaxation strength) if it exists. In the case of 2-ethyl-1-hexanol the raw data shows that a mechanical Debye-type relaxation process must have a strength below (corresponding to at most of the full relaxation strength).
IV Summary and conclusions
Two mono-alcohols (2-butanol and 2-ethyl-1-hexanol) were investigated by conventional dielectric spectroscopy and broadband shear-mechanical spectroscopy in the temperature range down to the glass transition temperature.
In the dielectric spectrum a low-frequency Debye-type process is dominant, as is generally observed for mono-alcohols. The second relaxation process observed was mathematically separated from the Debye-type relaxation by assuming additivity of the processes in the dielectric susceptibility. Loss-peak positions were found for the two processes.
Viewed from the shear-mechanical perspective the liquids behave as generic glass formers. Besides a clear non-Debye alpha relaxation, a minor Johari-Goldstein beta relaxation is observed. The loss-peak positions of the alpha process were determined.
The time scale of the mechanical alpha relaxation is clearly non-Ahreinius with a fragility index of for both liquids. The Debye-type dielectric relaxation has a much different temperature dependence, with a fragility index of for both liquids.
The time scale of the dielectric alpha relaxation follows closely that of the mechanical alpha relaxation. The two processes are separated by roughly one decade in frequency, consistent with what is usually observed for the separation of mechanical and dielectric alpha relaxations. The Debye-type process is separated from the mechanical alpha relaxation by roughly four decades (depending on temperature). The temperature dependence of the mechanical relaxation time seems to be unaffected by the falling out of equilibrium of the dielectric Debye-type process.
The possibility that the Debye-type relaxation process has a mechanical signature can still not be ruled out, but the present results show that if it exists one has to use measurement methods specialized for rather soft systems to look for it. If the Debye-type process has a mechanical signature, it must have a relaxation strength below and of the full relaxation strength for 2-butanol and 2-ethyl-1-hexanol respectively.
These observations supports the existing ideaMurthy (1996a, b); Hansen et al. (1997); Kudlik et al. (1997); Wendt and Richert (1998); Murthy and Tyagi (2002); Wang and Richert (2004, 2005a, 2005b); Wang et al. (2005); Huth et al. (2007); Wang et al. (2008); El Goresy and Böhmer (2008) that the “minor” non-Debye peak observed by dielectric spectroscopy is the structural alpha relaxation, and that the major Debye-type relaxation is something else.
Any explanation on the dielectric Debye-type relaxation should be able to explain why no significant signature is observed in either mechanical or calorimetric studiesHuth et al. (2007).
V Acknowledgments
We are grateful to Niels Boye Olsen for inspiring to this work, and Kristine Niss for contributing with interesting comments and questions. This work was supported by the Danish National Research Foundation’s (DNRF) centre for viscous liquid dynamics “Glass and Time”.
References
- Böttcher and Bordewijk (1980) C. J. F. Böttcher and P. Bordewijk, Theory of electric polarization 2: Dielectrics in time-dependent fields. (Elsevier, 1980), 2nd ed.
- Davidson and Cole (1951) D. W. Davidson and R. H. Cole, J. Chem. Phys. 19, 1484 (1951).
- Cole and Davidson (1952) R. H. Cole and D. W. Davidson, J. Chem. Phys. 20, 1389 (1952).
- Kono et al. (1966) R. Kono, T. A. Litovitz, and G. E. McDuffie, J. Chem. Phys. 45, 1790 (1966).
- Litovitz and McDuffie (1963) T. A. Litovitz and G. E. McDuffie, J. Chem. Phys. 39, 729 (1963).
- Johari and Goldstein (1971) G. P. Johari and M. Goldstein, J. Chem. Phys. 55, 4245 (1971).
- Murthy (1996a) S. S. N. Murthy, Mol. Phys. 87, 691 (1996a).
- Murthy (1996b) S. S. N. Murthy, J. Phys. Chem. 100, 8508 (1996b).
- Hansen et al. (1997) C. Hansen, F. Stickel, T. Berger, R. Richert, and E. W. Fischer, J. Chem. Phys. 107, 1086 (1997).
- Kudlik et al. (1997) A. Kudlik, C. Tschirwitz, S. Benkhof, T. Blochowicz, and E. Rössler, Europhys. Lett. 40, 649 (1997).
- Wendt and Richert (1998) H. Wendt and R. Richert, J. Phys. Chem. A 102, 5775 (1998).
- Murthy and Tyagi (2002) S. S. N. Murthy and M. Tyagi, J. Chem. Phys. 117, 3837 (2002).
- Wang and Richert (2004) L. M. Wang and R. Richert, J. Chem. Phys. 121, 11170 (2004).
- Wang and Richert (2005a) L. M. Wang and R. Richert, J. Phys. Chem. B 109, 11091 (2005a).
- Wang and Richert (2005b) L. M. Wang and R. Richert, J. Phys. Chem. B 109, 8767 (2005b).
- Wang et al. (2005) L. M. Wang, S. Shahriari, and R. Richert, J. Phys. Chem. B 109, 23255 (2005).
- Huth et al. (2007) H. Huth, L. M. Wang, C. Schick, and R. Richert, J. Chem. Phys. 126, 104503 (2007).
- Wang et al. (2008) L. M. Wang, Y. Tian, R. Liu, and R. Richert, J. Chem. Phys. 128, 084503 (2008).
- El Goresy and Böhmer (2008) T. El Goresy and R. Böhmer, J. Chem. Phys. 128, 154520 (2008).
- Lyon and Litovitz (1956) T. Lyon and T. A. Litovitz, J. Appl. Phys. 27, 179 (1956).
- Jakobsen et al. (2005) B. Jakobsen, K. Niss, and N. B. Olsen, J. Chem. Phys. 123, 234511 (2005).
- Dannhauser and Cole (1955) W. Dannhauser and R. H. Cole, J. Chem. Phys. 23, 1762 (1955).
- Murthy and Nayak (1993) S. S. N. Murthy and S. K. Nayak, J. Chem. Phys. 99, 5362 (1993).
- Wemelle (1957) R. Wemelle, C.R. Acad. Sci. 244, 775 (1957).
- Bondeau et al. (1978) A. Bondeau, G. Noyel, and J. Huck, C.R. Acad. Sci. C 286, 273 (1978).
- foo (a) The full raw data sets ( and at the investigated temperatures) will be available (upon final publication of this manuscript) from the “Glass and Time: Data repository” found online at http://glass.ruc.dk/data.
- Christensen and Olsen (1995) T. Christensen and N. B. Olsen, Rev. Sci. Instrum. 66, 5019 (1995).
- Igarashi et al. (2008a) B. Igarashi, T. Christensen, E. H. Larsen, N. B. Olsen, I. H. Pedersen, T. Rasmussen, and J. C. Dyre, Rev. Sci. Instrum. 79, 045105 (2008a).
- Igarashi et al. (2008b) B. Igarashi, T. Christensen, E. H. Larsen, N. B. Olsen, I. H. Pedersen, T. Rasmussen, and J. C. Dyre, Rev. Sci. Instrum. 79, 045106 (2008b).
- foo (b) The problem with such an approach is discussed in the context of the merging of the alpha and beta process in Ref. Sağlanmak et al., 2008.
- Niss et al. (2005) K. Niss, B. Jakobsen, and N. B. Olsen, J. Chem. Phys. 123, 234510 (2005).
- Menon et al. (1994) N. Menon, S. R. Nagel, and D. C. Venerus, Phys. Rev. Lett. 73, 963 (1994).
- Christensen and Olsen (1994) T. Christensen and N. B. Olsen, J. Non-Cryst. Solids 172, 357 (1994).
- Zorn et al. (1997) R. Zorn, F. I. Mopsik, G. B. McKenna, L. Willner, and D. Richter, J. Chem. Phys. 107, 3645 (1997).
- Deegan et al. (1999) R. D. Deegan, R. L. Leheny, N. Menon, S. R. Nagel, and D. C. Venerus, J. Phys. Chem. B 103, 4066 (1999).
- Schröter and Donth (2000) K. Schröter and E. Donth, J. Chem. Phys. 113, 9101 (2000).
- foo (c) A loss-peak position of corresponds to a relaxation time of , a factor of smaller than the often used . The choice of relaxation time at the glass transition temperature is always somewhat arbitrary, and will of course influence the reported glass transition temperatures. has the advantage that equilibrium points close to and even below are easily accessible, leading to a more price determination of .
- Plazek and Ngai (1991) D. J. Plazek and K. L. Ngai, Macromolecules 24, 1222 (1991).
- Böhmer and Angell (1992) R. Böhmer and C. A. Angell, Phy. Rev. B 45, 10091 (1992).
- Böhmer et al. (1993) R. Böhmer, K. L. Ngai, C. A. Angell, and D. J. Plazek, J. Chem. Phys. 99, 4201 (1993).
- Kalinovskaya and Vij (2000) O. E. Kalinovskaya and J. K. Vij, J. Chem. Phys. 112, 3262 (2000).
- Maggi et al. (2008) C. Maggi, B. Jakobsen, T. Christensen, N. B. Olsen, and J. C. Dyre (2008), arXiv:0806.1400 [cond-mat.soft].
- Olsen et al. (2001) N. B. Olsen, T. Christensen, and J. C. Dyre, Phys. Rev. Lett. 86, 1271 (2001).
- Dyre (2005) J. C. Dyre, Europhys. Lett. 71, 646 (2005).
- Dyre (2006) J. C. Dyre, Phys. Rev. E 74, 021502 (2006).
- Dyre (2007) J. C. Dyre, Phys. Rev. E 76, 041508 (2007).
- Sağlanmak et al. (2008) N. Sağlanmak, K. Niss, A. I. Nielsen, J. C. Dyre, and N. B. Olsen (2008), in preparation.