Driven transverse shear waves in a strongly coupled dusty plasma
Abstract
The linear dispersion properties of transverse shear waves in a strongly coupled dusty plasma are experimentally studied in a DC discharge device by exciting them in a controlled manner with a variable frequency external source. The dusty plasma is maintained in the strongly coupled fluid regime with () where is the Coulomb coupling parameter and is the crystallization limit. A dispersion relation for the transverse waves is experimentally obtained over a frequency range of 0.1 Hz to 2 Hz and found to show good agreement with viscoelastic theoretical results.
pacs:
52.25.Zb, 52.35.Fp, 52.25.UbI Introduction
A dusty plasma is a suspension of micron sized particles in a conventional electron-ion plasma. The dust particles get highly charged and hence get strongly coupled to each other through their mutual Coulomb interaction. The strength of interaction is characterized by the Coulomb coupling parameter (, where , , and are the dust charge, interparticle distance, dust temperature and plasma Debye length respectively. When exceeds a critical value the dust component can crystallize and behave like an ordered solid. However, even when but , so that the dust component is in a fluid state, the strong correlations can lead to the development of short range order among the dust particles and endow it with some solid-like properties. A consequence of such viscoelastic behaviour is the possibility of exciting and sustaining transverse shear waves in the medium - a novel collective phenomenon that cannot take place in a normal fluid. Wave propagation in strongly coupled media have been investigated in a number of past theoretical studies rosen ; wang1 ; sen ; sen1 ; kalman1 ; wang2 ; kalman2 . Rosenberg and Kalman rosen looked at its collective modes using the Quasi-localized charge approximation (QLCA). Wang and Bhattacharjee wang1 used the “generalized thermodynamic” approach of Kadanoff and Martin kada . Kaw & Sen sen adopted a more phenomenological approach and employed the Generalized Hydrodynamic (GH) Model to derive the linear dispersion relation for longitudinal dust acoustic modes as well as for transverse shear modes. The existence of transverse modes has also been predicted from numerical simulation studies carried out by Ohta and Hamaguchi ohta and subsequently also derived within the framework of the QLCA by Kalman and co-workers kalman1 ; kalman2 . Although transverse shear waves are relatively easy to excite and study in ordered crystalline media nuno1 ; misawa ; nuno2 their experimental detection in the fluid regime is more challenging. For dusty plasmas the first experimental observation of transverse shear waves in the fluid regime was made by Pramanik et al pramanik who looked at self excitations of such waves in conjunction with longitudinal dust acoustic waves in a laboratory device. By varying the neutral gas pressure they were able to vary in a limited fashion the natural frequencies of the waves and thereby experimentally determine the dispersion relation. However in their experiment there was no direct control over the frequency of the excitations nor a direct measurement of it. Further, by changing the neutral pressure one also changes some of the equilibrium parameters which leads to an additional complexity in the accurate determination of the dispersion relation. To obviate these difficulties and to further critically test and confirm the experimental findings of pramanik we have carried out a set of controlled experiments in which the shear waves are excited by an external source whose frequency can be varied over a range. Although many such controlled driven experiments have been carried out in the past for longitudinal dust acoustic waves barkan ; thompson ; pieper ; pintu , there have been very few attempts to study controlled excitations of transverse shear waves in a strongly coupled plasma. A notable exception is the work of Piel, Nosenko and Goree piel who excited shear waves in a single layer of suspended particles in the solid and liquid phases by external perturbations with a laser. In our experiment we have looked at shear waves in a three-dimensional dusty plasma cloud configuration under conditions similar to that reported in pramanik . Our dispersion curve obtained by changing the applied frequency over a finite range is found to agree quite well with the GH model predictions and thus provide an added confirmation of the previous results of Pramanik et al pramanik .
II Experimental Set-up
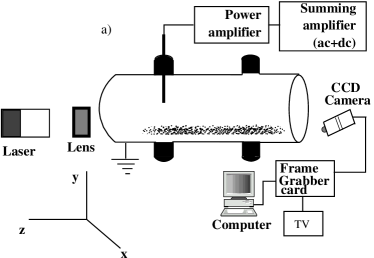
The experiment was carried out in the set-up shown in Fig. 1. The SS cylindrical chamber has eight radial ports and two axial ports. The radial ports are used for pumping, introducing gas, feeding power to the electrodes, diagnostics, etc. The axial ports are used only for optical diagnostics for the dust particles. All the unused ports were covered by nylon bushes to avoid any hollow cathode glow discharge. The vacuum chamber was pumped down to a base
pressure of mbar by a rotary pump. It was then purged with argon gas and subsequently pumped down again to the base pressure. This process was repeated several times by using a precision needle valve. Then micron sized kaolin dust particles were sprinkled at the bottom of the vacuum chamber. The pressure was kept constant at 1 mbar. The entire chamber was covered by a thin SS sheet to avoid stray arcing. A discharge was produced between a rod shaped anode and the grounded vessel (used as a cathode) at an applied voltage of volt. The applied voltage was then reduced to volts and the neutral gas pressure was gradually reduced to mbar to achieve a dense dust cloud.
The levitated dust particles were illuminated by a green Nd-Yag diode laser () light. The laser light was spread into a sheet by a cylindrical lens and the forward scattered light from the dust cloud was used to visualize the dust particles. In these set of experiments the cylindrical lens was kept vertical to illuminate the plane of the dust column. The scattered light from the dust particles was captured using a CCD camera (25 fps) which was kept at an angle of to this plane. Further, the wavelength measurements in the vertical plane () were duly corrected to account for the geometrical effects arising from the small but finite angle of inclination of the CCD camera with respect to the axis. Video frames were digitised by a frame grabber card with eight bits of intensity resolution and recorded in a high speed computer.
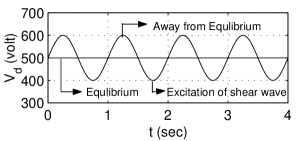
An AC signal ( volts using a signal generator and a power amplifier) was superimposed on to the discharge voltage to excite oscillations in the dust cloud (see Fig. 2). The mean discharge current was mA at volts. The frequency of the applied AC signal was varied from 0.1 to 2 Hz during the experiment to excite acoustic and transverse waves.
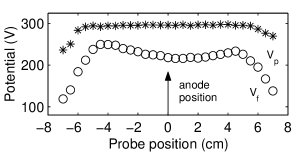
The plasma parameters like the ion density () and the electron temperature () were measured initially by using a single Langmuir probe in the absence of dust particles inside a plasma. The electron density was estimated from the modified quasi-neutrality conditions of the dusty plasma. A hot emissive probe was used to measure the plasma potential and the floating potential. The radial profiles of the floating and the plasma potentials are shown in Fig. 3. The dust temperature () was calculated from the velocity of the particles by tracing single particle trajectories in different frames. The wave length of the driven dust acoustic wave was obtained by measurements made on the still images.
III Results and Discussion
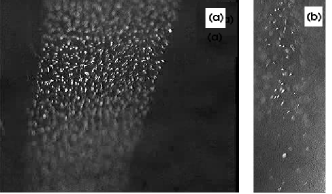
In the initial stage of the experiment, an equilibrium dust cloud consisting of layers of micron sized kaolin particles was observed to form in the sheath region of the discharge. The layer heights are governed by the force balance conditions acting on the particles and are determined by the discharge parameters. Fig. 4(a) shows a horizontal view () of the equilibrium dust cloud and Fig. 4(b) shows the same in the () plane. For the vertical levitation of the dust cloud, the upward electrostatic force based on the inhomogeneous sheath electric field suspends negatively charged dust particles against the downward gravitational force . For the micron sized dust particles, the other forces (like neutral drag force and thermophoretic force) do not contribute significantly as they are smaller than these two major forces ( and ) by an order of magnitude. The radial electric field provides the radial confinement of the particles. It is clear from Fig. 4(b) that the smaller particles levitate to the top surface of the cloud while the big particles reside at the bottom indicating the existence of a mass and a charge gradient in the direction. Such a gradient is a consequence of the potential gradient existing in the sheath region and the dispersion in the particle sizes.
Soon after the formation of the equilibrium dust cloud, at mbar, volts and mA, spontaneous excitation of longitudinal oscillations were observed to occur, and are shown in Fig. 5(a). These oscillations, which are basically dust acoustic oscillations, were seen to propagate in the direction (in the direction of the sheath electric field) with a phase velocity cm/sec (which was measured by tracking a single crest in consecutive frames). In the present set of experiments, the typical plasma parameters are m-3, eV, and eV. The dusty plasma parameters are m, m, eV, m-3, and kg. The high dust particle temperature noticed in the present set of experiments was also reported by Melzer et al. melzer . Using the above parameters we get an average value of m and Hz. In the limit , the theoretically calculated phase velocity for dust acoustic waves, cm/sec which is in close agreement with the experimental measurements.
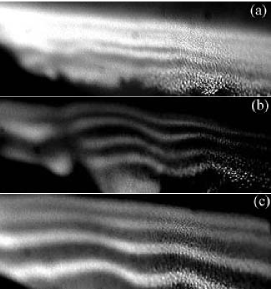
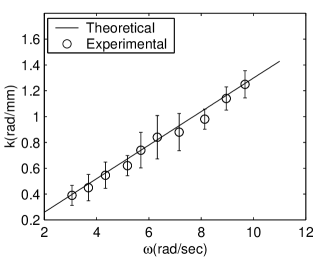
Now when a modulation voltage of a very low frequency ( few Hz) was superimposed over the DC discharge voltage an additional wave motion was seen to appear in the dust cloud over the spontaneously excited dust acoustic wave (see Fig. 5(b) and Fig. 5(c)). It was also noticed that the phase velocity of the acoustic oscillation remained unaffected with the application of the modulation voltage. The additional wave motion was observed to propagate perpendicularly to the direction of propagation of the acoustic waves. The direction of propagation of these new additional waves was also seen to be perpendicular to the direction of the particle oscillation and hence these waves are truly transverse waves. Fig. 5(b) and Fig. 5(c) show the typical acoustic and shear waves of different wave lengths ( Hz and Hz). The frequency of the applied modulating voltage was varied over a finite range to get the dispersion relation which is shown in Fig. 6. The average phase velocity was measured as mm/sec. In the present set of experiments the excitation of pure transverse waves was not possible and we were able to excite them only over the dust acoustic oscillations, as was observed earlier in the self excitation case pramanik . This is an interesting issue that is not fully understood yet and needs to be explored in greater depth and addressed in future studies.
To compare our experimental results to past theoretical predictions we have used the viscoelastic theory proposed by Kaw and Sen sen . According to this theory in the limit ( is the relaxation time), the dispersion relation for the transverse shear mode is given by:
| (1) |
where and are the adiabatic index and compressibility of the medium and is the excess potential energy. The values of and can be estimated from according to the following relations,
Eqn. 1 shows the theoretical linear dispersion relation which is plotted by a solid line in Fig. 6. The value of can be estimated from the given experimental parameters. As mentioned earlier, the measured inter-grain distance m which makes the screening factor to have a value of . The unscreened contribution due to the factor is about , making the Coulomb coupling parameter to have a value 23. From the calculated value of and , the phase velocity of the shear wave according to the GH model (viscoelastic theory) (Eqn. 1) comes out to be mm/sec. This is in good agreement with the above experimental results.
It is appropriate to mention here that there also exists an excitation threshold for sustaining transverse shear waves in a dusty plasma. Basically, as discussed in nuno1 , dust particles constituting the shear wave gain energy from the inhomogeneous sheath electric field while oscillating in the upward direction and lose their energy due to the collisions with the neutral gas molecules during the time of return. Excitation of transverse shear waves therefore requires that the energy gain exceeds the energy loss. This condition results in a threshold limit on the plasma density and the neutral gas
pressure. Kalman et al. kalman1 in their theoretical calculations have also predicted that the transverse mode cannot be excited in a regime where . They have also suggested that the excitation of transverse mode can be facilitated by using a lighter gas and a dust material with a larger specific gravity to reduce the collisional frequency at low pressure. In our case the ratio of to is very low 0.002 and so we have had no difficulty in exciting and sustaining the transverse waves. However for verifying the threshold mechanism we have increased the neutral pressure to P=0.3 mbar where the ratio of to is higher ( 0.09). In such a case we have observed that the transverse oscillations get severely damped and are very difficult to sustain. These measurements lend further support to the phenomenological physical model for the excitation and sustenance of transverse shear modes in a strongly coupled dusty plasma fluid.
IV Conclusion
In this letter, we have reported on experimental observations of externally excited low frequency transverse shear waves in a strongly coupled dusty plasma fluid which in a sense confirms and complements the earlier observations on self-excited waves reported in pramanik . The waves were excited by the application of a modulated AC voltage superposed on a DC discharge voltage. The transverse shear waves were found to be excited over a background of low frequency dust acoustic waves. The experimental dispersion relation compares quite favorably with existing visco-elastic model calculations. We also observe a strong damping of the modes at higher neutral gas pressures that is in accord with theoretical predictions regarding the role of dust-neutral collisions in draining energy away from these modes.
References
- (1) M. Rosenberg, G. Kalman, Phys. Rev. E 56 (1997) 7166.
- (2) X. Wang and A. Bhattacharjee, Phys. Plasmas 4 (1997) 3759.
- (3) P. K. Kaw, A. Sen, Phys. Plasmas 5 (1998) 3552.
- (4) A. Mishra, P. K. Kaw, A. Sen, Phys. Plasmas 7 (2000) 3188.
- (5) G. Kalman, M. Rosenberg, H. E. DeWitt, Phys. Rev. Lett. 84 (2000) 6030.
- (6) X. Wang, A. Bhattacharjee, S. Hu, Phys. Rev. Lett. 86 (2001) 2569.
- (7) G. J. Kalman, P. Hartmann, Z. Donko, M. Rosenberg, Phys. Rev. Lett. 92 (2004) 065001.
- (8) L. P. Kadanoff, P. C. Martin, Ann. Phys. 24 (1963) 419.
- (9) H. Ohta and S. Hamaguchi, Phys Rev. Lett. 84 (2000) 6026.
- (10) S. Nunomura, D. Samsonov, J. Goree, Phys Rev. Lett. 84 (2000) 5141.
- (11) T. Misawa, N. Ohno, K. Asano, M. Sawai, S. Takamura, P. K. Kaw, Phys. Rev. Lett. 86 (2001) 1219.
- (12) S. Nunomura, J. Goree, S. Hu, X. Wang, A. Bhattacharjee, Phys. Rev. E 65 (2002) 066402.
- (13) J. Pramanik, G. Prasad, A. Sen, P. K. Kaw, Phys. Rev. Lett. 88 (2002) 175001.
- (14) A. Barkan, R.L. Merlino, N. D’Angelo, Phys. Plasmas 2 (1995) 3563.
- (15) C. Thompson, A. Barkan, N. D’Angelo, R. L. Merlino, Phys. Plasmas 4 (1997) 2331.
- (16) J.B Pieper, J. Goree, Phys Rev. Lett. 77 (1996) 3137.
- (17) P. Bandyopadhyay, G. Prasad, A. Sen, P. K. Kaw, Phys. Lett. A 368 (2007) 491.
- (18) A. Piel, V. Nosenko and J. Goree, Phys. Plasmas 13 (2006) 042104.
- (19) A. Melzer, A. Homann, A. Piel, Phys. Rev. E 53 (1996) 2757.