Homogeneous and inhomogeneous contributions to the luminescence linewidth of point defects in amorphous solids: Quantitative assessment based on time-resolved emission spectroscopy
Abstract
The article describes an experimental method that allows to estimate the inhomogeneous and homogeneous linewidths of the photoluminescence band of a point defect in an amorphous solid. We performed low temperature time-resolved luminescence measurements on two defects chosen as model systems for our analysis: extrinsic Oxygen Deficient Centers (ODC(II)) in amorphous silica and F centers in crystalline Lithium Fluoride. Measurements evidence that only defects embedded in the amorphous matrix feature a dependence of the radiative decay lifetime on the emission energy and a time dependence of the first moment of the emission band. A theoretical model is developed to link these properties to the structural disorder typical of amorphous solids. Specifically, the observations on ODC(II) are interpreted by introducing a gaussian statistical distribution of the zero phonon line energy position. Comparison with the results obtained on F crystalline defects strongly confirms the validity of the model. By analyzing experimental data within this frame, we obtain separate estimations of the homogenous and inhomogeneous contributions to the measured total linewidth of ODC(II), which results to be mostly inhomogeneous.
pacs:
71.55.Jv, 61.72.jn 78.55.Qr, 78.47.CdI Introduction
The physics of color centers embedded in a solid matrix is a fundamental and interesting scientific field both from the point of view of basic physics and for their wide technological applications as modifiers of the macroscopic physical properties of solids, (e.g. optical transparency, refractive index, electrical resistance, and so on).stoneham ; nalwa Several experimental evidences have led to a general agreement on the fact that the properties of point defects may be significantly different depending on the crystalline or amorphous structure of the solid they are embedded in.Erice Indeed, in a crystal each member of an ensemble of identical defects experiences the same local environment. As a consequence, every spectroscopical property of the ensemble of defects, such as the lineshape of the related absorption or photoluminescence (PL) bands, can be interpreted as a property of the single center, and is referred to as homogeneous. The homogeneous absorption linewidth is mainly determined by the electron-phonon interaction and it is related to other important physical properties of the defect, such as the Huangh-Rhys factor and the phonon vibrational frequencies.nalwa ; Erice On the other hand, defects in an amorphous solid are believed to feature site-to-site statistical distributions of the spectroscopic properties due to the disorder of the surrounding matrix. Hence, the lineshapes of their optical bands are characterized by an inhomogeneous broadening,nalwa ; Erice ; holeburning which reflects the degree of disorder of the amorphous solid and concurs, together with the homogeneous effects, to determine the overall spectroscopic signature of the color center.
Many experimental approaches have been proposed to estimate the homogeneous and inhomogeneous contributions to the experimental linewidth of an optically active center: exciton resonant luminescence, resonant second harmonic scattering, femtosecond photon echo, spectral hole burning and site-selective spectroscopy.holeburning ; furumiya ; woggon ; mittlemann ; Skujaprb1995 ; kuroda However, the issue is still open since none of these techniques is applicable to the whole variety of inhomogeneous physical systems of interest. For instance, in amorphous solids site-selective spectroscopy can been successfully applied only to defects which allow the the direct observation of the zero phonon line (ZPL) by virtue of a weak coupling with the vibrational modes of the matrix.Erice ; Skujaprb1995
In this paper we propose a new experimental approach to this problem, which allows to estimate the inhomogeneous and homogeneous linewidths based on mapping the variations of the radiative decay lifetime within an inhomogeneously broadened luminescence emission band by time-resolved laser-excited luminescence. To this purpose, in the next section we first describe an adapted version of the theoretical treatment of the optical properties of a point defect in a solid, which takes into account the effects of heterogeneity in amorphous systems. Next, in the experimental section we demonstrate that the predictions of our model are consistent with the results of measurements performed on two model point defects, one in a crystal solid and the other one in a glass. Finally, we use the theoretical model to estimate the inhomogeneous and homogeneous widths of the two model defects and to obtain other physical parameters of interest.
II Theoretical description of optical defect properties
We briefly review the standard theoretical description of the optical properties of a point defect in a crystal,stoneham ; nalwa ; Erice in order to adapt it later to the case of amorphous systems. In addition to the crude Born-Oppenheimer and Franck-Condon approximations, we suppose the defect to be coupled with only one vibrational mode of the solid matrix of frequency , assumed to be the same for ground and excited electronic states. The frequency can be regarded also as the mean frequency of the vibrational modes of the solid or can be thought as the effective phonon frequency coupled with the electronic transition.nalwa2
In this frame, the absorption cross section of a defect as a function of the excitation energy at the absolute zero temperature is given by:Erice ; nalwa2
| (1) |
where indicates a Dirac delta function, and the summation is carried out over the vibronic transitions linking the ground electronic state with zero phonons towards different vibrational sub-levels of the electronic excited state, spaced by . The energy value (zero phonon line) is the absorption transition without emission or absorption of phonons. is the overlap integral between nuclear wave functions associated to the ground and excited states, while is given by: , where is the matrix element of the electric dipole operator between the ground and excited electronic states, and is the degeneracy of the lower electronic state. The effective field correction accounts for the polarization effect induced by the external field on the solid.stoneham ; Erice We assume here that the refraction index is constant in the electromagnetic range investigated. In the harmonic approximation for the vibrational sublevels relative to the ground and excited states, the coefficients are given by a Poisson distribution:Erice
| (2) |
where is the Huangh-Rhys factor, expressing the number of phonons emitted by the system after absorption of a photon while relaxing to the ground vibrational substate of the excited electronic level.stoneham Given a population of identical defects, the envelop of the functions in Eq. (1) describes their characteristic homogeneous absorption lineshape, with (aside from the effect of the factor E) a first moment and a width.
After relaxation towards the bottom of excited electronic state, the system can relax back to the ground state by spontaneous photon emission (photo-luminescence). The following relationship of mirror symmetry links the absorption and luminescence band shapes: Erice
| (3) |
The energy difference between absorption and emission peaks (Stokes shift) is linked to the Huangh-Rhys factor and results to be . Using the mirror symmetry Eq. (3) and Eq. (1) we obtain:
| (4) |
which represents the homogeneous emission lineshape, with (aside from the effect of the factor ) a first moment and a width. Expression (4) does not take into account the dependence from the excitation energy within the absorption band. This is based on experimental results and it will be discussed later.
The PL radiative lifetime is linked to the absorption profile by the Forster’s equation: Erice ; forster
| (5) |
where is the degeneracy of the upper electronic state. Combining Eq. (5) and Eq. (1) we obtain the decay rate :
| (6) |
where . The cubic dependence appearing in the above expression is a direct consequence of the relation between Einstein coefficients for absorption and spontaneous emission, which forms the basis of Forster’s equation. Eq. (6) can be approximated by neglecting the contributions far from , thus obtaining:
| (7) |
This expression shows that the decay rate is proportional to and approximately to the third power of the first moment of the emission band.
Summing up, the global expression for the luminescence of a population of identical point defects in a solid matrix as a function of the spectral position and time after an exciting light pulse (homogeneous shape) is:
| (8) |
This expression assumes that non radiative channels from the excited state are absent. As we see from Eq. (8), the shape and kinetics of the homogeneous luminescence band are completely characterized by four parameters: (the ZPL position), (the phonon energy), (proportional to ) and (the Huangh-Rhys factor). and can be expressed in terms of the half Stokes shift and of the homogeneous width : = and . In this way, expression (8) can be alternatively regarded as depending on the four parameters , , , , thus being indicated by the expression: .
For defects in an amorphous matrix, we can argue the hypothesis of a population of identical defects to fail. Indeed, each point defect interacts with different environments and it is possible that this conformational heterogeneity causes a site-to-site statistical distribution of one or more of the homogeneous properties of single defects. The simplest model we can put forward to take into account the disorder effects is to introduce a gaussian distribution of the ZPL position , peaked at and with an inhomogeneous width ; in this scheme, , , and are still considered as undistributed parameters. Within these hypotheses, the global PL signal emitted by the ensemble of non-identical point defects can be now expressed as the convolution of the homogeneous shape with the inhomogeneous distribution of :
| (9) |
Eqs. (8) and (9) lead us to predict a difference between the PL signals of defects in crystalline and amorphous solids. Indeed, when the inhomogeneous broadening is almost zero, as expected for point defects in a crystalline matrix, Eq. (8) has to be used, and the radiative lifetime should be independent from the spectral position at which it is measured within the emission band. In fact, is expressed by Eq. (6), so being a function of the homogeneous parameters , , , and , which are expected to be the same for all defects in the solid. In contrast, in an amorphous solid a PL band due to an ensemble of point defects can be thought as arising from the overlap of several bands with different as described by Eq. (9), and thus featuring different lifetimes. Hence, when is comparable with it should be possible to experimentally observe a dispersion in by measuring the decay of the PL signal at different emission energies. Also, the shape of a band arising from the overlap of sub-bands with different lifetimes should vary in time, so that the position of its first moment , calculated by the usual expression:
| (10) |
should depend on time. Therefore, both the dispersion of within the emission band and the time dependence of the first moment can be used in principle as experimental probes of inhomogeneous effects.
It is worth noting that according to Eq. (7), strongly depends on the first moment of the emission band, , and more weakly on . This leads to as the parameter of choice to be distributed in our model. Moreover, a gaussian distribution of was experimentally demonstrated for the non-bridging oxygen hole center point defect in silica, for which the zero-phonon line can be directly observed by site-selective spectroscopy at low temperatures.Skujaprb1995 ; vaccaro On the other side, we acknowledge that similar predictions can be obtained by introducing a distribution of the half Stokes shift with an undistributed . Data reported later on in this paper do not allow to discriminate between these two possibilities.
Finally, to get further insight into the meaning of Eq. (9) it is useful to consider the extreme case in which the homogeneous width is so narrow to be negligible with respect to the inhomogeneous one. In this case, the homogeneous lineshape can be approximated as , with given by Eq. (7). By substituting in Eq. (9) we get that:
| (11) |
This expression predicts an exponential decay whose depends cubically from the experimental observation energy within the inhomogeneous band.
In the intermediate situation of non-negligible homogeneous width, Eq. (9) deviates in principle from a single exponential decay, as it contains contributions with different values of . However, we verified that the typical values of the parameters which will be used in the following to fit experimental data (, , , , ), correspond to predicted decay curves that always remain very close to a single exponential for all practical purposes. From a theoretical point of view, we can define in general as the time in which (at a fixed ) decreases by a 1/e factor from . With this definition, we can summarize the above considerations as follows: the curve (with varying within the observed emission band) is expected to vary progressively from a constant value (for a completely homogeneous system) to a cubic dependence (for a completely inhomogeneous system) with increasing inhomogeneous/homogenous ratio. To check the validity of our model we have performed experimental measurements (described in the following) on crystalline and amorphous defects.
III Materials and Experimental Methods
We chose F-type-centers in lithium fluoride (LiF) and Oxygen Deficient Centers of the second type, ODC(II), in amorphous silicon dioxide (SiO2, or silica) as model point defects on which testing our approach. Both centers feature broad near-gaussian luminescence bands in the ultraviolet (UV) range with close decay lifetime values (8 ns), and they have both been widely studied in literature because of their important technological applications. Specifically, LiF is a material traditionally employed in the production of high-quality optical elements to be used in the infrared, visible, and particularly in the ultraviolet spectral regions. F-type-centers in LiF (electron trapped in anion vacancies) are the subject of active investigation in the areas of color center lasers, radiation dosimetry and integrated optics (see Ref. baldacchini, and references therein). The study of point defects in silica is a fundamental technologic problem as well, because their presence compromises the optical and electrical properties of glasses in their wide uses as optical components, as insulators in MOS transistors, and for guiding or processing light signals (optical fibers and Bragg gratings).nalwa ; Erice ODC(II) is a peculiar defect of the amorphous phase of SiO2,Erice ; skujajncs98 thus being an interesting model system to investigate the characteristic properties of defects in disordered materials with respect to crystalline ones. Its microscopic structure consists in an atom bonded to two oxygen atoms of the matrix (=X∙∙), where is an atom belonging to the isoelectronic series Si, Ge, Sn.Erice ; skujajncs98 ; skuja1984 Previous studies have suggested that the spectroscopic properties of ODC(II) are significantly conditioned by inhomogeneous effects.trukhin ; leone1 ; leone2 ; cannizzophilos
We report measurements performed on two samples: the first one is a crystalline Lithium Fluoride sample, hereafter denoted as LiF. Prior to any measurement this specimen, mm3 sized, was irradiated at room temperature with electrons of 3 MeV energy, for a total dose of rad. The purpose of irradiation was to induce in the sample the formation of luminescent F-type centers. The second sample is a fused silica (commercial name: Infrasil301, provided by Heraeus Quartzglas,heraeus and mm3 sized), hereafter named I301, manufactured by fusion and quenching of natural quartz, with typical concentration of impurities of 20 ppm in weight.heraeus In particular, as-grown I301 contains a 1 ppm concentration of Ge impurities, due to contamination of the quartz from which the material was produced. Previous studies demonstrated that in the as-grown material most of the Ge impurities are arranged as Ge-ODC(II) defects (=Ge∙∙); moreover comparison with sol-gel silica samples doped with Ge atoms ensures us that the contribution to PL of intrinsic ODC(II) defects in I301 sample is negligible.skujajncs98 ; sgjncs03 The optical activity of Ge-ODC(II) at low temperature (100 K) consists in an absorption band centered at eV which excites a fast (lifetime in the ns range) emission band centered at eV, due to the inverse transition.skujajncs98 ; nalwa2 ; agnelloprb03
PL measurements were done in a standard back-scattering geometry, under excitation by a pulsed laser (Vibrant OPOTEK: pulsewidth of 5 ns, repetition rate of 10 Hz, energy density per pulse of 0.300.02 mJ/cm2) tunable in the UV-Visible range. The luminescence emitted by the sample was dispersed by a spectrograph (SpectraPro 2300i, PI Acton, 300 mm focal length) equipped with three different gratings, and detected by an air-cooled intensified CCD (Charge-Coupled Device PIMAX, PI Acton). The detection system can be triggered in order to acquire the emitted light only in a given temporal window defined by its width (tW) and by its delay tD from the end of the laser pulse. All measurements reported here were performed on samples kept at 25 K in high vacuum ( mbar) within a He flow cryostat (Optistat CF-V, OXFORD Inst.). All luminescence signals in I301 were acquired with a 300 grooves/mm grating with a 2 nm bandwidth, while the signals in LiF were measured with a a 150 grooves/mm grating with a 2.5 nm bandwidth. All the spectra were corrected for the spectral response and for the dispersion of the detection system.
IV Experimental Results
In Fig. 1-(a) we show a typical time-resolved measurement of the PL activity of Ge-ODC(II) in the I301 sample, performed at 25 K under laser excitation at 240 nm (5.17 eV). The PL decay was analyzed by performing 60 acquisitions with the same integration time tW=1 ns but at different delays tD, going from 0 to 60 ns from the laser pulse. Fig. 1-(b) shows the normalized spectra of panel (a) in a contour plot and evidences that the first moment of the band (continuous line) varies in time.
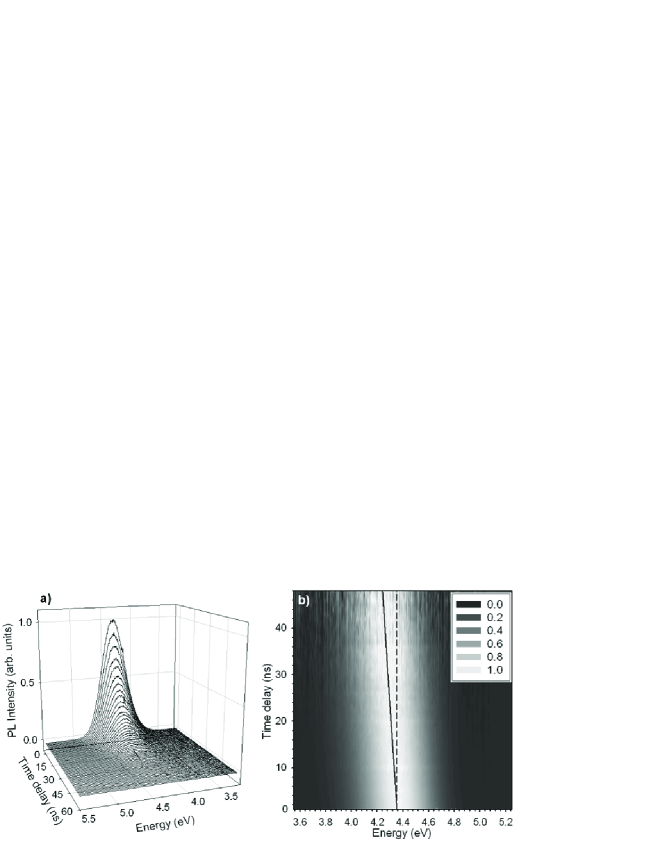
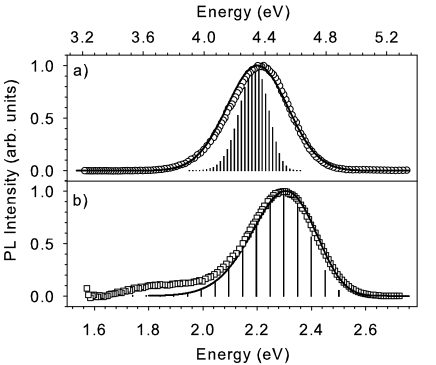
In Fig. 2-(a) we report the signal acquired for tD=0, corresponding to the first spectrum in Fig. 1-(a). The PL band of Ge-ODC(II), as acquired immediately after the end of the laser pulse, is peaked at 4.4 eV and has a 0.45 eV width (Full width at Half Maximum, FWHM) consistent with literature data.skujajncs98 Completely analogous time-resolved measurements were carried out on the PL activity of F-type centers in the LiF sample.
This specimen was excited at 450 nm (2.76 eV) and its luminescence was collected by varying tD from 0 to 100 ns with tW=1 ns. We report in Fig. 2-(b) the luminescence signal detected in LiF at tD=0. It is apparent that the PL signal of LiF comprises two contributions peaked at 2.3 eV and 1.8 eV. These signals are known to be associated to two different defects, the and centers respectively, both consisting in aggregates of F-type centers. baldacchini ; LiF1 In particular, the main 2.3 eV band with a 0.27 eV FWHM is due to , consisting in two electrons localized on three adjacent anion vacancies.baldacchini For each activity (Ge-ODC(II) and ), one can extract the time dependence of the first moment of the luminescent bands from the time-resolved measurements (e.g. those in Fig. 1 in the case of Ge-ODC(II)). Data so-obtained are reported in Fig. 3-(a). The origin of the time scale corresponds to tD=0.
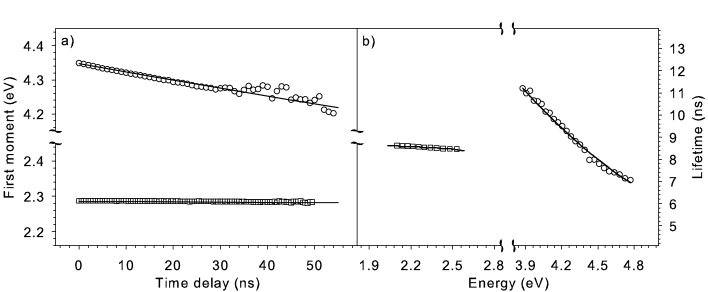
We observe that the PL activity in silica shows an approximately linear decrease of the first moment as a function of time, while this decrease is not observed in LiF, where the first moment of the centers band has a constant value within experimental sensitivity. As already discussed in the theoretical section, the progressive shift of the PL peak position observed for ODC defects can be alternatively understood as a dependence of the luminescence lifetime from the spectral position within the emission band. Hence, in Fig. 3-(b) we report the values of the PL lifetime as a function of the emission energy. The lifetimes were estimated for both PL activities by least-square fitting data from time-resolved spectra (1-(a)) at different emission energies with an exponential function ().111In regard to LiF, the fits were carried out in the range 2.10-2.60 eV so as to avoid the region of the emission band possibly affected by the overlap with the signal due to . At this temperature (25 K), the decays are purely exponential for both activities.agnelloprb03 ; baldacchini2 Fig. 3-(b) shows that the lifetime of Ge-ODC(II) centers in silica strongly varies within the emission band: goes from 7.0 ns to 10.7 ns. A similar behavior for Ge-ODC(II) was observed also under excitation by synchrotron radiation.agnellopss07 On the contrary, the lifetime of centers is almost constant in the observed range of emission energies. The above results were obtained exciting at the absorption peak for both PL activities. Although we performed the same measurements for different excitation energies within the absorption band, only a very weak dependence from this parameter was evidenced, consistently with previous results.agnelloprb03
V Discussion
The results in Fig. 3 qualitatively confirm the predictions of our theoretical analysis, i.e. that the dependence of the lifetime on the emission energy or, equivalently, the progressive red-shift of the emission peak with time, are characteristic features of luminescent defects embedded in a glassy matrix, as opposed to ”crystalline” defects. We stress that the non-radiative decay channels are almost completely quenched for both PL signals at the temperature at which the experiments were performed (25 K).baldacchini ; agnelloprb03 As a consequence, it is a very good approximation to consider the luminescence decay to be purely radiative. The main point of the following discussion is to fit all experimental data by our model and extract the values of the homogeneous and inhomogeneous widths of the PL emission bands and other interesting physical parameters.
For both investigated PL activities we have performed numerical integration of Eq. (9) to obtain a set of three theoretical curves which simultaneously fit i) the shape of the PL band at tD=0, ii) the time dependence of the first moment (calculated by Eq. (10)) and iii) the dependence of on emission energy.222The lifetimes predicted by the model were estimated by least-square fitting the decay curves (not reported) predicted by Eq. (9) at different emission energies with a single exponential. It is worth noting that the simulated data (as real data) feature no appreciable non-exponential behavior in the timescale of experimental data, at least when the parameters of the model are close to the best-fit ones.. To increase the reliability of the fit procedure, the half Stokes shift was fixed to the value obtained experimentally by measuring the difference between the spectral positions of the absorption and emission peaks: =0.38 eV and =0.24 eV in silica and LiF respectively. In this way, the fitting procedure was performed by varying only four free parameters, , , , . From the experimental point of view, the vibrational sub-structure of homogeneous luminescence bands cannot usually be resolved due to the bandwidth of the measuring system and to further broadening effects due for instance to the coupling with several low energy modes. To take into account this effect, the homogeneous lineshape, Eq. (8), was convoluted with a gaussian distribution of a narrow width before being inserted into Eq. (9).
The continuous lines in Fig. 2 and 3 represent the results of our fitting procedure. It is worth underlining the goodness of the fit, obtained using only four parameters, and considering especially that data in Fig. 3 take into account simultaneously all data acquired in a time-resolved PL measurement (typically 600 spectral positions for each of the 100 temporal acquisitions of Fig. 1). Table 1 summarizes the best parameters obtained via our fitting procedure for the two investigated PL activities.
| I301 | 4.700.05 | 17710 | 9312 | 0.380.02 | 1.410.09 |
| LiF | 2.500.02 | 2010 | 1096 | 0.240.02 | 10.00.6 |
| I301 | 785 | 20010 | 236 | 175 | 0.0730.010 |
| LiF | 32 | 1116 | 517 | 51 | 0.320.04 |
From data in Table 1 we can also calculate the Huang-Rhys factor , the vibrational frequency , the total width (from ),333Alternatively, one can estimate directly from experimental data, so obtaining a consistent value. and finally the parameter which estimates the degree of inhomogeneity. All these quantities are reported in Table 1 as well. As expected, is very small for the LiF defects in comparison with the amorphous ones: against . These values correspond to being about 0.2 times and 2 times , in LiF and SiO2 respectively. We note that the inhomogeneous broadening in the crystalline sample is not exactly zero; beside the approximations in our model, we note that a real crystal is always distorted by some dislocations, strains or other imperfections distributed at random into the matrix. The obtained value of for Ge-ODC(II) shows that for a defect embedded in a glassy matrix the inhomogeneous width can be prominent with respect to the homogeneous one. This conclusion may be at variance with previous suggestions that and are typically comparable.skujajncs98
In Fig. 2 we also show the discrete Poissonian homogeneous lineshape of width and ZPL position , as obtained by our fit procedure for both investigated activities. As already pointed out, the crystalline PL band is completely described by the homogeneous shape,444As explained above, the homogeneous shape is obtained by a convolution of the discrete Poissonian with a narrow gaussian curve of width to take into account further homogeneous broadening effects and experimental bandwidth. whereas the silica PL band is not reproduced without taking into account inhomogeneous effects. It is also worth noting that the value =236 meV obtained via our fitting procedure is very close to the value of meV found for the same defect by the analysis of the temperature dependence of the experimental absorption linewidth.cannizzo2003 Moreover, is in good agreement with experimental and computational works on silica glasses which predict the presence of vibrational modes of low frequency.galeener ; umari These agreements further confirm the correctness of the present value of and consequently of our analysis.
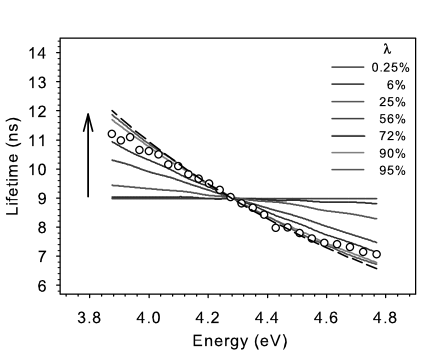
To show the accuracy of our fitting procedure in determining , in Fig. 4 we compare the experimental lifetimes of Ge-ODC(II) in the I301 sample with the predictions of our model obtained for different values. The theoretical curves are obtained by keeping fixed to the value which best fits the overall experimental shape of the PL band. This analysis clearly evidences a continuous transition from constant lifetimes for =0 (that is a completely homogeneous PL band), to an inverse cubic dependence of from emission energy for =1 (that is a completely inhomogeneous PL band), as anticipated in the theoretical section.
Finally, the oscillator strength f reported in Table 1 is calculated using:Erice
| (12) |
where and are respectively the mass and the charge of electron. We have substituted in Eq. (12) the value of , calculated from the fitting parameter , and we have used for the value . In regard to the effective field correction, the term calculated within the Onsager model,stoneham ; Erice results to be close to unity both in SiO2 (n1.5) and in LiF (n1.4) in the investigated spectral range. The oscillator strength found here for Ge-ODC(II) in silica is consistent with the range of values reported in literature:skujajncs98 0.03-0.07. For centers in LiF our result is close to 0.2 reported in ref. lif2, .
The main assumption of our model that all amorphous effects can be completely accounted for by a simply gaussian distribution of a single homogenous parameter (i.e zero phonon line) is strongly corroborated by the excellent agreement between theoretical curves and data. On the other side, a distribution of the emission peak is strongly suggested a priori by the almost Einstein-like proportionality of 1/ on E3 shown by experimental data in Fig. 4. Finally, it is important to note that in this scheme and thus are assumed as undistributed parameters. This means that the oscillator strength given by Eq. (12) can be distributed only as a consequence of the variations of associated to different homogeneous absorption sub-bands.
VI Conclusions
We have investigated the inhomogeneous properties of point defects in a glassy matrix via mapping by time-resolved PL the dependence of the radiative decay lifetime on emission energy. We propose a theoretical model, based on an extension of the standard theory of the optical properties of point defects, incorporating a statistical distribution of the zero phonon line to account for the effects of the non-equivalent environments probed by each point defects in an amorphous matrix as opposed to a crystalline one. This model enlightens a direct connection between the dispersion of the radiative decay lifetime within a luminescence band as a function of emission energy and the inhomogeneous properties of defects in a glassy environment. To confirm our prediction we have experimentally studied the luminescence of Oxygen Deficient Centers in silica and of aggregates of F-centers in a crystalline sample of LiF. The model is able to fit all experimental data and to provide an estimate of the ratio between the inhomogeneous and the total width, namely 78% for ODCs and 3% for F. Finally, our model allowed us to determine the homogeneous parameters of ODC and F centers: homogeneous width, oscillator strength, Huangh-Rhys factor and the frequency of the vibrational local mode.
Acknowledgements.
We acknowledge financial support received from project ”P.O.R. Regione Sicilia - Misura 3.15 - Sottoazione C”. The authors would like to thank R. M. Montereali for having kindly provided the irradiated LiF sample. We also thank G. Lapis and G. Napoli for assistance in cryogenic work. Finally we are grateful to LAMP research group (http://www.fisica.unipa.it/amorphous/) for support and enlightening discussions.References
- (1) A. M. Stoneham, Theory of Defects in Solids, vol.1, Clarendon, Oxford, (1975).
- (2) H. S. Nalwa (Ed.) Silicon-based Materials and Devices, ISBN 0-12-513909-8, Academic Press, USA (2001). San Diego, CA.
- (3) G. Pacchioni, L. Skuja, and D. L. Griscom (Eds.), Defects in SiO2 and Related Dielectrics: Science and Technology, ISBN 0-7923-6685-9, Kluwer Academic Publishers, USA (2000).
- (4) Persistent Spectral Hole-Burning: Science and Applications Editor: W.E. Moerner, Springer-Verlag (1988)
- (5) T. Itoh and M. Furumiya, J. Lumin., 48-49, 704 (1991).
- (6) U. Woggon, S. Gaponenko, W. Langbein, A. Uhrig, and C. Klingshirn, Phys. Rev. B 47, 3684 (1993).
- (7) D. M. Mittleman, R. W. Schoenlein, J. J. Shiang, V. L. Colvin, A. P. Alivisatos, and C. V. Shank, Phys. Rev. B 49, 14435 (1994).
- (8) L. Skuja, T. Suzuki, and K. Tanimura, Phys. Rev. B 52, 15208 (1995).
- (9) T. Kuroda, S. Matsushita, F. Minami, K. Inoue, and A. V. Baranov, Phys. Rev. B 55, R16041 (1997).
- (10) M. Leone, S. Agnello, R. Boscaino, M. Cannas, and F. M. Gelardi, in: H. S. Nalwa (Ed.), Silicon-based Materials and Devices, vol. 2, Academic Press, San Diego, 2001, pp. 1 50 (Chapter 1).
- (11) Th. Frster, Fluoreszenz Organischer Verbindungen; Vandenhoeck und Ruprecht, Gttinen, 158 (1951).
- (12) L. Vaccaro, M. Cannas, and R. Boscaino, Solid State Commun. 146, 148 (2008).
- (13) G. Baldacchini, E. De Nicola, R. M. Montereali, A. Scacco, and V. Kalinovc, J. Phys. Chem. Solids 61, 21 (2000).
- (14) L. Skuja, J. Non-Cryst. Solids 239, 16 (1998).
- (15) L. N. Skuja, A. N. Streletsky, and A. B. Pakovich, Solid State Commun. 50, 1069 (1984).
- (16) A. Trukhin, B. Poumellec, and J. Garapon, Radiat. Eff. Defects Solids 149, 89 (1999).
- (17) M. Leone, S. Agnello, R. Boscaino, M. Cannas, and F. M. Gelardi, Phys. Rev. B 60, 11475 (1999).
- (18) A. Cannizzo, S. Agnello, R. Boscaino, M. Cannas, F. M. Gelardi, S. Grandi, and M. Leone, J. Phys. Chem. Solids 64, 2437 (2003).
- (19) A. Cannizzo and M. Leone, Phil. Mag. 84, 1651 (2004).
- (20) Heraeus Quartzglas, Hanau, Germany, catalog POL-0/102/E.
- (21) S. Grandi, P. Mustarelli, S. Agnello, M. Cannas, and A. Cannizzo, J. Sol-Gel Sci. Technol. 26, 915 (2003).
- (22) S. Agnello, R. Boscaino, M. Cannas, A. Cannizzo, F. M. Gelardi, S. Grandi, and M. Leone, Phys. Rev. B 68, 165201 (2003).
- (23) E. Sonder and W. A. Sibley in Point defects in Solids, J. H. Crawford and L. M. Slifkin Eds., New York (1972).
- (24) G. Baldacchini, F. De Matteis, R. Francini, U. M. Grassano, F. Menchini, and R. M. Montereali, J. Lumin. 87-89, 580 (2000).
- (25) S. Agnello, G. Buscarino, M. Cannas, F. Messina, S. Grandi, and A. Magistris, Phys. Stat. Sol. (c) 4, 934 (2007).
- (26) A. Cannizzo, S. Agnello, R. Boscaino, M. Cannas, F. M. Gelardi, S. Grandi, and M. Leone, J. Phys. Chem. Solids 64, 2437, (2003).
- (27) F. L. Galeener, A. J. Leadbetter, and M. W. Stringfellow, Phys. Rev. B 27, 1052 (1983).
- (28) P. Umari, X. Gonze, and A. Pasquarello, Phys. Rev. Lett. 90, 027401 (2003).
- (29) T. Kurobori, T. Kanasaki, Y. Imai, and N. Takeuchi, J. Phys. C: Solid State Phys. 21, L397 (1988).