Robustness of planar random graphs to targeted attacks
Abstract
In this paper, robustness of planar trivalent random graphs to targeted attacks of highest connected nodes is investigated using numerical simulations. It is shown that these graphs are relatively robust. The nonrandom node removal process of targeted attacks is also investigated as a special case of non-uniform site percolation. Critical exponents are calculated by measuring various properties of the distribution of percolation clusters. They are found to be roughly compatible with critical exponents of uniform percolation on these graphs.
I Introduction
Robustness or fragility of a graph characterize its behavior when systematic or random deletion of a fraction of nodes is performed. These questions are of practical importance for real complex networks (World Wide Web, social networks, cells,etc) and, recently, there has been much interest in investigating targeted and random attacks for two families of random complex networks key-1 ; key-2 ; key-3 , namely exponential and scale-free networks key-3BIS . Resilience to random deletion of nodes can, for example, be seen as tolerance against error, i.e. random failure of a fraction of nodes. Targeted deletion of high degree nodes can simulate attacks of hackers on computer networks. However, besides these practical issues, investigating random and targeted attacks on abstract graphs is of great theoretical interest in its own right. It has to be noted that the random attack problem is equivalent to uniform site percolation key-3TER .
In this paper, we study a family of purely abstract random graphs extensively used in the past decades as discrete models for euclidean quantum gravity key-4 , namely random planar graphs. These planar graphs are made of trivalent vertices and look locally like the regular honeycomb lattice. But the faces are not necessarily hexagonal, so that long distance properties are very different from those of honeycomb lattices. Note that site percolation on these graphs has already been investigated key-5 ; key-6 . By means of Monte-Carlo simulations, we study resilience of these graphs against targeted attacks defined as a systematic face removal process, i.e. removal of all links and vertices that belong to the edges of the targeted face. More precisely, we investigate connected clusters distributions when all faces whose number of edges is larger than a cut-off are removed.
A key feature in the behavior of graphs against targeted attacks is the degree distribution. However, vertex coordination numbers on complex networks are uncorrelated random variables so that the degree distribution is sufficient to characterize these random graphs. On the contrary, planarity constraints induce long range correlations for random planar graphs so that the degree distribution is not enough to characterize these graphs key-6BIS . This characteristic is also shared by Voronoï/Delaunay graphs. However, correlations in the latter case decrease much faster than for random planar graphs. This fundamental difference between complex networks and random planar graphs induces radically different behaviors under uniform percolations problems. The main purpose of this work is then to determine whether it also induces different behaviors against non-uniform percolation like targeted attacks, and, if so, to quantify these differences.
It has to be noted that, even if random planar graphs have been used in Euclidean quantum gravity, the problem studied here is not relevant to these issues. Indeed, there is no back-reaction of any degree of freedom on the connectivity of the graphs. In other words, the disorder due to random degree distribution is quenched and we study the average behavior against targeted attacks of a graph picked at random in the ensemble of random planar graphs. However, this work could be the starting point of the study of a modified model of quantum gravity characterized by matter fields (Ising spin, for instance) coupled to the ensemble of graphs obtained from the random planar graphs after a systematic node delation procedure.
Besides the size of the largest connected component , we study several properties of connected cluster of graphs for various values of , in particular, the density of the second largest cluster and the average size of finite clusters . Considering as a continuous parameter, it is possible to extract a critical parameter similar to a percolation threshold, and to compute critical exponents , and associated to the second largest cluster, average cluster size and correlation length. These exponents are compared with those of uniform percolation problem on random planar graphs.
This paper is organized as follows: in section II, we introduce the model of planar random graphs; in section III, targeted attacks are defined and results of numerical simulations are reported; the problem is described as non-uniform percolation and critical exponents are extracted from numerical results in section IV; section V contains conclusions and perspectives.
II Random planar graphs
We consider the class of trivalent planar graphs, i.e all graphs without boundaries that can be drawn on a sphere and where each vertex is connected to exactly three neighbors. Moreover, two distinct vertices are connected by at most one link and no vertex is connected to itself. An example of graph is shown in figure 1.

For a given number of vertices , all graphs can be obtained by gluing together trivalent vertices in all possible ways satisfying the strong constraint of planarity. The Euler characteristic , where , , and are, respectively, the number of vertices, links and faces, is fixed by the topology so that all planar graphs with the topology of a sphere share the same value . One more constraint, arising from the fact that each link is bounded by two vertices and that three links intersect at each vertex, reads . These constraints imply that and are fixed if is fixed.
By giving each graph a Boltzmann weight , this class is turned into a statistical model of random graphs. In this paper, we choose for each graph. The partition function is given by
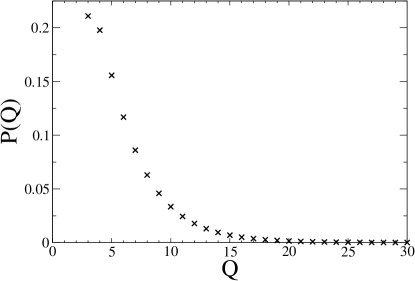
where the sum is over all graphs with vertices as defined above. is a symmetry factor which avoids the overcounting of some symmetric graphs and is almost always equal to one for large graphs. There is an apparent regularity in these graphs. Namely connectivity, number of vertices, links and faces are fixed so that these graphs locally look like the honeycomb lattice. Moreover, the average size of a face, i.e the number of links surrounding a face, is equal to six for large . However, the size of a face is, in fact, a random variable following a distribution exactly known key-7 ; key-7BIS (see figure 2), and the correlations associated to the variable are long range, decreasing as where is the geodesic distance key-6BIS . Note that for a face with size , the deviation of from the average value defines the curvature .
This implies that these graphs are very different from the honeycomb lattice at large distance. For instance, there are objects called baby universes that induce a self-similar structure for these graphs. A baby universe is a connected part of a graph linked to it by a boundary called a neck. If we call the size of a baby-universe and the linear dimension of its neck, we must have , i.e. each baby universe is connected to the rest of the graph by a small boundary. On trivalent graphs, the minimum size of a neck is , and baby universes with such necks are called minimum neck baby universes (minbus). There are more of minbus than of the other baby universes and their distribution has been exactly calculated key-8 . Moreover, baby universes can grow on other baby universes, so that each graph is like a tree made of a central part (the root) on which several branches of baby universes are growing. The global spherical topology ensures that branches do not intersect. This tree has a self-similar structure that can be seen as follows: consider the family of baby universes with a given ratio between the linear size of their neck and the square root of their size . In a way, defines a family of baby universes with the same shape. Then, let be the (average) fraction of the total area of a graph included in baby universes with a shape characterized by and with size ranging from to . It can be shown that is independent of . So, if we probe a graph, it looks similar at any scale, at least in the limit of large graphs.
The fractal structure of these graphs described above is characterized by a Hausdorff (fractal) dimension key-9 . This dimension is defined by the scaling law
where is the average number of vertices at (geodesic) distance lower than from any arbitrary vertex.
III Targeted attack and robustness of planar random graphs
III.1 Definitions
A targeted attack is a process that systematically removes highly connected nodes of a graph. In fact, as each vertex of a graph is always trivalent, we define targeted attack as nonrandom removal of faces - instead of vertices - with large number of edges. Note that, as planar graphs are dual to planar triangulations, this is equivalent to nonrandom removal of highly connected vertices of a triangulation.
We introduce a cutoff number and define the removal process as follows: for a given graph , we list all faces whose size - defined as the number of their edges - is greater than . Then, each face in this list is removed, i.e. all vertices and links which belong to its edges are removed. The resulting amputed graph is generally not connected. Instead, consists in a collection of connected smaller planar graphs called connected clusters. As we consider the statistical ensemble of planar random graphs with vertices, we are interested in average properties under targeted attacks, namely the properties of a graph associated to a graph picked at random in .
Robustness of a graph to targeted attacks means its ability to preserve its large scale connectivity after a nonrandom deletion of its highly connected nodes. This can be measured by its diameter, defined as the average geodesic distance between two arbitrary nodes, i.e. the average length of the shortest path between two arbitrary nodes key-2 . Alternatively, as the effect of targeted attacks is to fragment graphs into smaller connected clusters, robustness can be measured by the average density of the largest connected cluster key-1 , denoted in this paper. Graphs in are connected, so that is equal to one before any targeted attack. To get more insight on the consequences of targeted attacks, we also measure the density of the second largest cluster, denoted , and the mean size of finite clusters, denoted . The exact definition of is the following key-10
where is the average number of clusters made of vertices and means that the largest cluster is excluded from the sum.
III.2 Numerical experiment
We generated graphs in following the method described in appendix A. For each graph in a Monte-Carlo series, we performed nonrandom removal of faces - for a given value of - and measured the size of the largest connected cluster by a method described in appendix B. We simulated graphs in with ranging from 1000 to 32000, and the parameter ranging from 8 to 30 for each value of , except for where was ranging from 12 to 18. For each couple , we made 512 measurements separated by 1000 local updating moves (flips) called moves (see appendix B). Errors were estimated using the standard jackknife method and error bars are systematically plotted in the figures.
III.3 Results
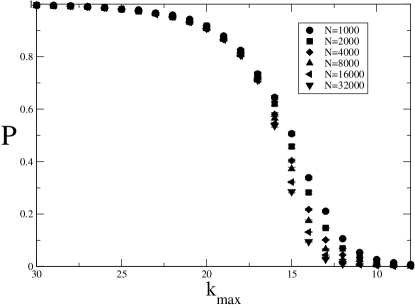
The density of the largest cluster is plotted as a function of the cut-off in figure 3. As expected, for very large , as graphs in are connected. We can see that for values of , slowly decreases with , independently of the sizes of the graphs. Then, there is a fast fall of down to zero. The falling rate is more and more pronounced when the size is increased. This means that a targeted attack with greater than about 17 does not significantly affect the connectivity of the graphs - i.e., for these values of , more than of the vertices belong to the giant cluster. Conversely, has to be smaller than about 13 to completely fragment the graphs into small clusters.
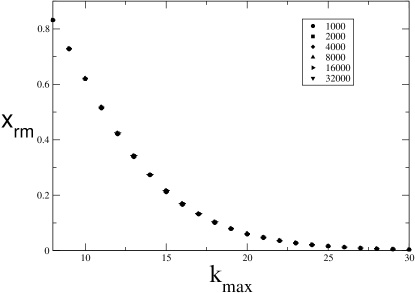
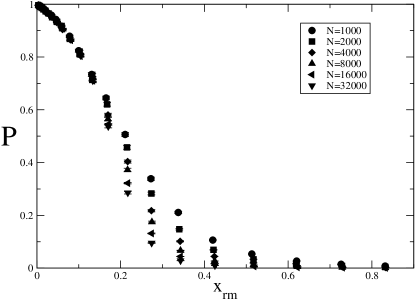
The average fraction of removed vertices is called . It is a smooth decreasing function of as can be seen in figure 4. It is interesting to plot against . This is shown in figure 5.
We can see that a targeted attack significantly affects the connectivity only when a large fraction of the vertices are removed. For example, for and for . In this sense, we can say that planar random graphs are rather robust to targeted attacks.
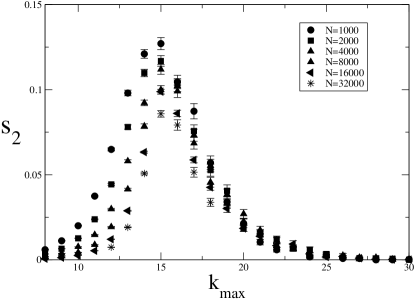
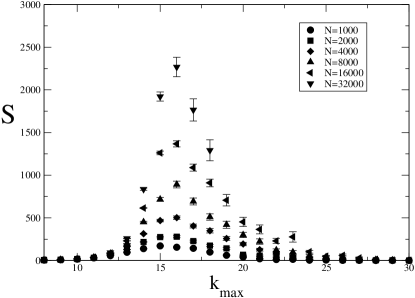
The analysis of the density of the second largest cluster and of the average size of finite clusters , plotted in figures 6 and 7 respectively, gives more information on the mechanism of fragmentation of graphs under targeted attacks. For large , , meaning that most of vertices belong to the largest cluster. Then, sharply increases when decreases and eventually reaches a peak for . This is due to a small gradual decrease of the connectivity, i.e. a small fraction of vertices get disconnected from the largest cluster. However, this phenomenon is marginal as does not exceed 0.15 and is not greater than about 8% of the size. So, in this region , the largest cluster completely dominates with only a few number of much smaller clusters. This is corroborated by the behavior of in this region. As the largest cluster is excluded from this quantity, for very large . As decreases, is essentially influenced by the second, third, etc, largest clusters and so it increases and reaches also a peak. Then, when continues to increase, i.e. when and go through their peak, there is a dramatic change in the fragmentation process. undergoes a fast drop, meaning that there is an acceleration in the fragmentation and more and more vertices get disconnected from the initial largest cluster. The behaviors of and are similar. This is due to the fact that more and more small clusters appear, so that their average size is small, even for the largest, second largest,third largest, etc, clusters.
IV Non-uniform percolation
IV.1 Percolation threshold
The fragmentation process described above is very similar to the percolation mechanism key-10 . This is, in fact, expected as nonrandom removal of nodes under targeted attack is equivalent to percolation with non-uniform occupation probability key-1 . In the case studied here, a vertex is occupied if and only if it does not belong to an edge of a face whose size is greater than . The behavior of , and can then be interpreted by saying that there exists a critical value so that percolation takes place for . In the following, we consider as a continuous parameter; more precisely, it is as if the observables , and were defined for all real (positive) values of but that numerical data were available only for integer values of . Note that can be seen as a cutoff on the local scalar curvature. By taking an appropriate continuum limit when , the curvature is, of course, a continuous observable so that a cutoff on curvature has to be continuous in this limit. In other words, in any process of coarse graining, would effectively become a continuous parameter.
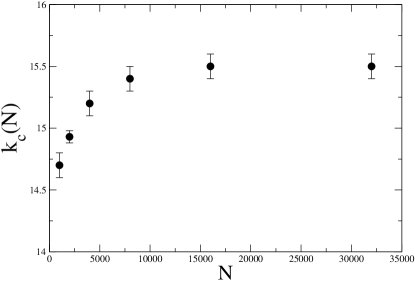
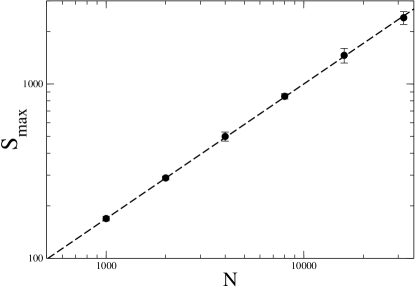
In order to get a more precise value of , we define a finite size critical parameter as the value of for which is maximum for fixed. By fitting the data of with a Gaussian curve, we obtained . The result is shown in figure 8. The behavior of can be estimated by standard finite size scaling analysis (see appendix C). This allows us to predict the behavior of approaching as with a constant explained in section IV.2. So, we fitted the values of with the law , with a constant. We obtained .
IV.2 Critical exponents , and
The point of view of non-uniform percolation with a percolation threshold strongly suggests that the observables and should obey the following scaling laws for near key-10 ; key-11 (recall that we consider here as a continuous parameter)
Their finite size counterparts are
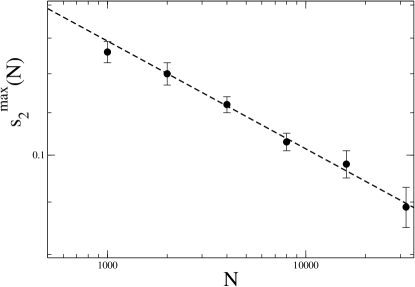
with and two scaling functions. The exponent characterizes the correlation length associated with a percolation transition. In particular, this exponent controls the way tends to its infinite size value . So, the fit performed in the previous section also allows us to extract the value of . The result is . In order to extract the values of exponents and , we have measured the maximum of and , which should scale as
IV.3 Systematic errors
Because of the discrete nature of the parameter , there are no available data for non-integer values of this parameter. This inevitably induces systematic errors - in particular, values of for which observables are maximum - certainly underestimated in the standard analysis used here.
IV.4 Comparing with uniform percolation exponents
Critical exponent are known exactly for uniform percolation on planar random graphs key-5 , , and . It is tempting to compare them with the values found in this work for non-uniform percolation , and . In view of systematic errors underestimated, it appears that values of exponents and are roughly compatible for uniform and non-uniform percolation. The exponent seems very different from the exact value of uniform percolation. However, if we compare it with the value found in numerical simulations key-6 , it is once again roughly compatible. In fact, as in uniform percolation, the fractal dimension is very sensitive to finite size effects. However, measures done in this work are not precise enough to conclude that critical exponents are the same for uniform and non-uniform percolation for this problem. It is not excluded either and this would imply a kind of universality between uniform and non-uniform percolation on these graphs.
V Conclusions
In the first part of this work, the behavior of planar random graphs under targeted attacks is investigated. The method consists in removing all vertices that belong to an edge of a face whose size is greater than a parameter . It appears that this family of graphs is rather robust to this nonrandom removal as has to be rather small ( ) to significantly affect the global connectivity of these graphs, measured by the density of the largest cluster. This threshold corresponds to the removing of about % of the vertices. Note that the case of random failure is equivalent to uniform site percolation. This problem has already been investigated and the high value of the percolation threshold means that these graphs are rather fragile against random failure of nodes.
In a second part, we consider the targeted attacks problem as non-uniform percolation. By measuring two observables characterizing percolation clusters, namely the density of the second largest cluster and the mean size of connected clusters , and by extrapolating values of to non-integer values, we extract a critical value that can be interpreted as a percolation threshold for targeted attacks. It is also possible to look for scaling laws of observables in the vicinity of , by analogy to the uniform percolation problem. This allows us to measure (effective) standard critical exponent , and . Taking into account underestimated systematic errors due to the fact that is, in fact, a discrete parameter, critical exponents found here appear roughly compatible with their counterparts of uniform percolation. This is a very interesting fact as it would show that non-uniform and uniform percolations are in the same class of universality. If true, this property could be a result of the hierarchical nature of these graphs that makes them look like trees of baby universes (BUs).
Indeed, consider a vertex in a BU. For uniform percolation, a necessary condition for this vertex to belong to a giant cluster is that at least one vertex in the neck of the BU belongs to this giant cluster. The probability for this condition is rather small as necks are very small regions of the graph, so that the probability for a vertex to belong to a giant cluster is smaller if the vertex is in a BU. Consider now the case of targeted attacks. The probability for a vertex to be removed is, in fact, greater if it is in a BU as, on average, there is more curvature in BUs. Then, the probability that a vertex is in the boundary of a large face is greater if the vertex is in a BU. So, in both cases (uniform percolation and targeted attacks), the structure of BUs induces the same effect: the probability to be occupied is smaller for a vertex in a BU. However, this conjecture of universality between uniform and non-uniform percolation has to be more extensively and precisely investigated.
Appendix A Generating and sampling graphs
The Monte-Carlo sequence starts with a graph in randomly generated as follows: we start from a tetrahedron and, then, add vertices one by one in randomly chosen faces (triangles). Each new vertex is linked to the vertices of the corresponding triangle. The process is repeated until we obtain a graph (polyhedron) with triangles. This graph becomes a graph - denoted - by duality, i.e. by replacing each triangle of the polyhedron by a vertex linked to the vertices replacing the adjacent faces of the initial triangle. The resulting graph is topologically equivalent to a sphere with trivalent vertices. Then, a series of graphs is obtained by using standard flips of links ( moves shown in figure 11) performed on randomly chosen links. It has been shown key-7 that moves define an ergodic transformation in the ensemble , so that whatever the starting graph , we obtain a nonbiased sampling with this method.

Appendix B Cluster structure
In order to measure the connected cluster structure of graphs after a targeted attack, we use a breadth-first search algorithm similar to the Wolff algorithm key-12 . It recursively constructs all clusters for a given graph as follows: at “time” , clusters have already been detected. All sites in these clusters are labeled "visited". At time , a not yet visited site (called ) is chosen. By definition, it does not belong to any cluster already detected. is the root of the new cluster ; it is then labeled "visited" and put in a (empty) list . The following procedure is now recursively applied to : for each site in , all not yet visited neighbors of (on the graph) are added to , labeled "visited" and put in whereas is removed from . The procedure stops when is empty. Then, cluster is completely constructed. The algorithm stops when all sites have been visited.
Appendix C Finite size scaling
Finite size scaling analysis supposes that finite size corrections to scaling laws near a critical parameter are encoded by scaling functions depending on the ratio between the linear size of the system and the correlation length . When , finite size effects should not affect the system and scaling laws undergo no correction. On the contrary, when and become comparable, finite size corrections of scaling laws are expected. For an observable depending on a parameter , an infinite size scaling law can be rewritten as the correlation length scales as . In particular, implies . This can be summarized by the following law: with a (scaling) function of the dimensionless ratio . In order to interpolate between the cases and , must verify for and for . Finite size scaling is a powerfull tool for extracting critical exponents by studying the variations of observables with the size of the system. This also provides a natural finite size critical parameter : suppose that reaches a maximum for . Then, for fixed , the value of giving a maximum for obeys the following relation or, equivalently, approaches when the size becomes infinite as key-10 . However, graphs in have no explicit linear size, but the quantity , where is the Hausdorff dimension, plays this role so that finite size scaling laws are and approaches as .
References
- (1) D. S. Callaway, M.E.J. Newman, S. H. Strogatz and D. J. Watts, 2000 Phys. Rev. Lett. 85 5468
- (2) R. Albert, H. Jeong and A.-L. Barabasi, 2000 Nature (London) 406 378
- (3) A. Broder, R. Kumar, F. Maghoul, P. Raghavan, S. Rajagopalan, R. Sata, A. Tomkins and J. Wiener, 2000 Comput. Netw. 33 309
- (4) R. Albert and A.-L. Barabasi, 2002 Rev. Mod. Phys. 74 47 ; S.N. Dorogovtsev, A.V. Goltsev and J.F.F. Mendes, arXiv:0705.0010.
- (5) D.S. Callaway, M.E.J. Newman, S. H. Strogatz and D. J. Watts, Phys. Rev. Lett. , 2000 85 5468 ; R. Cohen, D. ben-Avraham and S. Havlin, 2002 Phys. Rev. E 66 036113 ; Z. Wu, C. Lagorio, L.A. Braunstein, R. Cohen, S. Havlin and H.E. Stanley, 2007 Phys. Rev. E 75 066110; J.D. Noh, 2007 Phys. Rev. E 76 026116;H.D. Rozenfeld and D. ben-Avraham, 2007 Phys. Rev. E 75, 061102
- (6) F. David, Gravitation and Quantizations, 1992 Les Houches Session LVII (Elsevier, Amsterdam); J. Ambjørn, Fluctuating Geometries and Field Theory, 1994 Les Houches Session LXII (Elsevier, Amsterdam);P. Di Francesco, P. Ginsparg and J. Zinn-Justin, 1995 Phys. Rep. 254 1; J. Ambjørn, B. Durhuus, and T. Jonsson, Quantum Geometry, 1997 (Cambridge University Press, Cambridge).
- (7) V.A. Kazakov, 1988 Nucl. Phys. B (Proc. Supp.) 4 93; V.A. Kazakov, 1989 Mod. Phys. Lett. A 4 1691 (1989)
- (8) J.-P. Kownacki, 2008 Phys. Rev. Phys. Rev. E 77 021121
- (9) W. Janke, D.A. Johnston and M. Weigel, 2006 Condens. Matter Phys. 9 263; W. Janke and M. Weigel, 2004 Phys. Rev. B 69 144208
- (10) D.V. Boulatov, V.A. Kazakov, I.K. Kostov and A.A. Migdal, 1986 Nucl. Phys. B 275 641
- (11) C. Godrèche, I. Kostov and I. Yekutieli, 1992 Phys. Rev. Lett. 69 2674
- (12) S. Jain and S.D. Mathur, 1992 Phys. Lett. B 286 239
- (13) H. Kawai, N. Kawamoto, T. Mogami and Y. Watabiki, 1993 Phys. Lett. B 306 19; J. Ambjørn and Y. Watabiki, 1995 Nucl. Phys. B 445 129
- (14) D. Stauffer and A. Aharony, 1994 Introduction to Percolation Theory (Taylor & Francis, New York)
- (15) A. Margolina, H.J. Herrmann and D. Stauffer, 1982 Phys. Lett. A 93 73
- (16) U. Wolff, 1989 Phys. Rev. Lett. 62 361