XMM-Newton observations of the low–mass X–ray binary XB 1832–330 in the galactic globular cluster NGC 6652
Abstract
Context. We report on two XMM-Newton observations performed in 2006 of the luminous low–mass X–ray binary XB 1832–330 which is located in the galactic globular cluster NGC 6652 and is probably an ultracompact binary (orbital period, Porb, of 1 hour).
Aims. The aim of these observations is to investigate the low-energy absorption towards XB 1832–330 and in particular to search for Ne-rich material local to the binary, which has been suggested as a possible spectral signature of Neon rich degenerate companions.
Methods. XMM-Newton observed the source twice, in 2006 September and October. High resolution spectroscopy with the XMM-Newton RGS was used to estimate the ratio of the neutral neon to oxygen column densities to search for an anomalous Ne abundance in this X–ray binary.
Results. We find no evidence for anomalous Ne/O ratios, finding Ne/O=0.18 and Ne/O=0.17 (1 uncertainties), in the two observations, respectively. These values are consistent with that in the interstellar medium. Timing analysis of EPIC data suggests possible periodicities at 9170 s and 18616 s, which need confirmation. A by-product of these observations consists of the spatial analysis of the source field, which resulted in the detection of 46 faint sources within the EPIC field of view, which are not present in the Second XMM-Newton Serendipitous Source Catalogue. All these faint sources are likely foreground objects.
Conclusions. We performed the first high spectral resolution observations of XB 1832–330, a probable ultracompact binary, without finding any evidence for an anomalous Ne abundance.
Key Words.:
X-rays: binaries - stars: neutron - accretion - X-rays: stars: individual: XB 1832–3301 Introduction
XB 1832–330 was discovered using HEAO-1 (Hertz & Wood 1985) and is one of the bright low–mass X–ray binaries (LMXBs) located in galactic globular clusters. The source was observed with ROSAT (Predehl et al. 1991; Johnston et al. 1996) and associated with the galactic globular cluster NGC 6652. The ROSAT uncertainty region was observed in 2000 May with the High Resolution Camera-Imager (HRC-I) camera on the X-Ray Observatory (Heinke et al. 2001). Four X–ray sources were detected within 30′′ of the cluster center, including the bright LMXB XB 1832–330 (named “source A” or CXOGLB J183543.6-325926 in Heinke et al. 2001). The detection of a type I X–ray burst confirmed the neutron star nature of the compact object (in ’t Zand et al. 1998), although one of the other fainter X–ray sources detected with could also be responsible for the burst (Heinke et al. 2001).
The significantly smaller uncertainty region allowed a secure identification of the optical counterpart (Heinke et al. 2001) with a MV = +3.7 object (HST observations). A clear 0.08 mag variability in the V and I lightcurves was observed (Heinke et al. 2001), with possible periods of 3300 s, 8000 s (or 16000 s for ellipsoidal variations), as well as non-periodic flickering. The short temporal coverature did not allow the three periodicities to be clearly separated. Heinke et al. also noted that the optical magnitude is compatible with the donor star being in an ultracompact binary (orbital period, Porb, less than about 1 hour). If one of the three periodicity is associated with the orbital period, the secondary could be a white dwarf or a low-mass M dwarf (Heinke et al. 2001).
X–ray spectroscopy of XB 1832–330 has been performed with ASCA (Mukai & Smale 2000) and BeppoSAX (Parmar et al. 2001) and indicates that no simple model provides acceptable fits to the spectrum, suggesting that partial covering absorption, or other spectral complexity plays an important role in modifying the X–ray emission at low-energies. Another more recent observation at high energies (above 20 keV) has been performed with IBIS on-board INTEGRAL (Tarana et al. 2006).
The galactic globular cluster NGC 6652 is located at a distance of 9.3 kpc, it has a metallicity of [Fe/H]=0.9 and a low reddening () (Ortolani et al. 1994), which translates into an absorption, , of cm-2 (Predehl & Schmitt 1995).
We report here on the results of two XMM-Newton observations performed in order to investigate the low-energy absorption towards XB 1832–330, in particular to search for Ne-rich material local to the binary, which has been suggested as a possible spectral signature of Neon rich degenerate companions in binaries (Juett et al. 2001).
2 Observations and Data Reduction
XB 1832–330 was observed with XMM-Newton on 2006 September 22 (hereafter, obs I) and on 2006 October 20 (obs II), for a net exposure of 28 ks and 34 ks, respectively (obs-IDs 0400790101 and 0400790301). Data were reprocessed using version 7.1.0 of the Science Analysis Software (SAS). Known hot, or flickering, pixels and electronic noise were rejected. Response and ancillary matrix files were generated using the SAS tasks rmfgen and arfgen. The EPIC pn was operated in its Small Window mode, the MOS1 camera was in its Prime Partial Window mode, with the central CCD operated in Timing Mode and with the other CCDs in Imaging Mode. The MOS2 camera was operated in its Prime Partial Window with all the CCDs in Imaging Mode. The EPIC MOS and pn observations used the medium thickness filter. Spectra were extracted using PATTERN 0 for the MOS cameras (only single events), and PATTERNS from 0 to 4 (single and double events) in the pn. The RGS source and background events were extracted by making spatial and energy selections on the event files.
Source counts were extracted from circular regions of 40′′ radius for the pn and from a circular corona with an internal radius of 8′′ and an external radius of 1′ for MOS2. Source counts in MOS1 timing mode were extracted from RAWX=309 to RAWX=330, excluding the central core with an internal radius of 5 RAW pixels. The MOS1 and MOS2 data clearly suffered from the effects of pile-up. We checked iteratively with the SAS task epatplot that the events selected from annular regions in the MOS cameras were not significantly affected by pile-up after this spatial selection. Background counts were obtained from similar sized regions offset from the source positions. For the MOS1 timing mode, the background region has been taken from an outer CCD which collected data in imaging mode. The background did not show evidence for significant flaring activity.
To ensure applicability of the statistics, the net spectra were rebinned such that at least 20 counts per bin were present and such that the energy resolution was not over-sampled by more than a factor 3.
3 Analysis and Results
3.1 Spectroscopy
The XB 1832–330 lightcurves and hardness ratios do not show evidence for any large spectral variability (Fig.1). We therefore extracted averaged spectra from each of the two observations, which were then analysed separately, withouth any further filtering or selection.


Since the three EPIC instruments show significant discrepancies below 0.8 keV when they are compared, with opposite structured residuals if fitted with the same spectral model (Fig. 2), we conservatively decided to limit the spectral analysis to the range 0.8–12 keV, for both the MOS and the pn. Similar problems and discrepancies at low-energies have often been observed in other X–ray binaries (e.g. Sidoli et al. 2005; Boirin et al. 2005). The softest energy range was covered with RGS1 and RGS2, which extend down to 0.4 keV. For each observation separately, the two RGS (0.4–2 keV) spectra were fitted together with the EPIC pn and the two MOS (0.8–12 keV) spectra. Free relative normalizations between the instruments were included. The net source count rates are reported in Table 1.

| Obs I | Obs II | |
|---|---|---|
| RGS1 | 1.113 | 0.874 |
| RGS2 | 1.303 | 1.064 |
| pn | 32.38 | 30.33 |
| MOS1 | 4.42 | 3.74 |
| MOS2 | 4.23 | 4.11 |
Since the main aim of these XMM-Newton observations was to investigate the low- energy absorption towards XB 1832–330, and in particular the estimate of the Ne/O ratio, we adopted a variable abundance absorption model (vphabs in xspec), with the elemental abundances set to the ISM values of Wilms et al. (2000), except for those of O, Ne and Fe which were set to zero. Their effect on the spectral shape has been replaced with three edges (O-K, Fe-L, Ne-K) with energies fixed at 0.543, 0.706 and 0.869 keV (e.g. Paerels et al. 2001) and edge depths that were allowed to vary. In this way we could also account for a local Fe abundance which could be different from the cosmic value.
We tried different models for the continua of the two observations. A single component model was never able to well fit the data adequately (as already demonstrated by previous observations with ASCA (Mukai & Smale 2000) and BeppoSAX (Parmar et al. 2001)). Different combinations of simple models were tried: for the soft component we adopted a blackbody and a disk blackbody model (diskbb in xspec), while for the high-energy component we used a power law, a cutoff power-law and a Comptonization emission model (compTT in xspec). We tried all possible combinations of these models, obtaining equally good fits and similar spectral parameters. Since in the XMM-Newton energy band there is no evidence for a cut-off (resulting in an unconstrained electron temperature in the compTT model or in a high energy cut-off well above 10 keV), we adopted the power law plus a blackbody model for the continuum.
From the depth of the edges and the elemental cross sections, the three element column densities were measured and so the Ne/O ratio, which has been compared to that of the interstellar medium (ISM) value of 0.18, assuming the ISM abundances of Wilms et al. (2000). The spectral results are reported in Table 2 (for the continuum) and in Table 3 (for the edge depths, columns and equivalent hydrogen columns, together with the final Ne/O ratio, for the two observations).
| Parameters | Obs I | Obs II |
|---|---|---|
| NH | 0.058 | 0.094 |
| kTbb | 0.62 | 0.61 |
| Rbb | 3.1 | 3.5 |
| 1.58 | 1.52 | |
| Flux | 1.6 | 1.5 |
| LX | 1.6 | 1.5 |
| red. (dof) | 1.154 (2363) | 1.044 (2712) |
| Obs | Edge | Ne/O | |||
|---|---|---|---|---|---|
| I | Ne K | ||||
| O K | |||||
| Fe L | |||||
| II | Ne K | ||||
| O K | |||||
| Fe L |
We then analysed the RGS spectra alone, to better investigate the fine structure around the absorption edges. We adopted the same shape for the continua as found in the broader band spectroscopy, with temperature of the blackbody component and the power law photon index fixed to the best-fits reported in Table 2, but with all the normalizations free. The same method to measure the edge depths of Ne, O and Fe was applied to the RGS1 and RGS2 spectra (variable absorption model together with three edges). The best fit in both the observations (reduced 2 = 1.105 (1735 dof) and 2 = 0.937 (2070 dof), respectively) is obtained adding a further absorption feature, a Gaussian line at energy of 0.53 keV, which is compatible with being due to absorption from interstellar O I and O II (see e.g. Juett et al. (2004)). In Fig. 3 and Fig. 4 we show both the net RGS spectra and the structure around the O edge. The absorption line at 0.53 keV has a normalization of 10-4 photons cm-2 s-1 (Obs I, EW=3 eV) and 10-4 photons cm-2 s-1 (Obs II, EW=5 eV). The resulting depths for the absorption edges are the following: =0.40, =0.10 , =0.16 in Obs I, and =0.55, =0.094, =0.185 in Obs II (all errors on the depth of the edges are at 1 ). The resulting ratios Ne/O are 0.39 (Obs. I, 1 uncertainty) and 0.27 (Obs. II), which are within 2.6 and 1.8, respectively, consistent with the ISM value of 0.18. Thus we confirm with high resolution RGS data alone, what found during the broader band analysis, with no evidence for an unusual ratio Ne/O.


3.2 Timing analysis
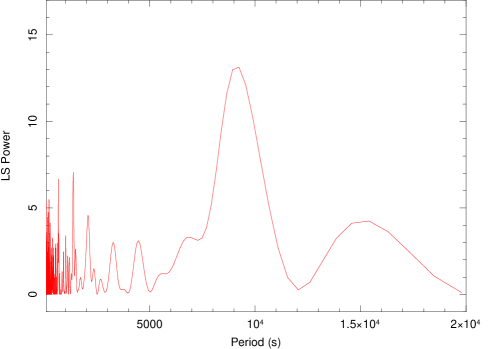
From the Lomb-Scargle diagram of the obs I there is evidence for a periodicity near P = 9170 s, with a significance of about 0.6 % (see Fig. 5, left panel). Folding on this period reveals a smooth sinusodial modulation with an amplitude of 0.78 % (Fig. 6). This periodicity is not the same as previously claimed values (Heinke et al. 2001), but periods in the 2–4 hour range have been claimed before. The period is rather long compared to the observation duration, thus we cannot say much about the long-term stability. However, it is quite likely (99.3 %) that during this observation an approximately sinusodial modulation with this period was present.
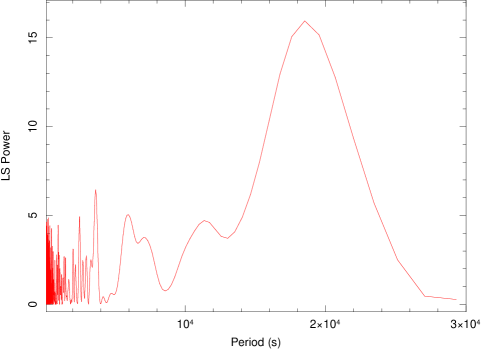
In obs II there is no evidence for the P=9170 s periodicity. However, there is evidence for modulation with a period of 18616 s. From the Lomb-Scargle periodogram this period is significant at the 0.05 % level (see Fig. 5, right panel). It is striking that this period is twice the period found in the first observation performed in 2006 September, within the uncertainties.

3.3 Spatial analysis: a source catalog of the XB 1832–330 field
The EPIC images of the XB 1832–330 field show the presence of several faint X–ray sources. We therefore performed a detection analysis in order to obtain a source catalog of this region. We considered only the two MOS cameras, since the pn was operated in Small Window mode and could image a region close to the central target.
The cleaned events files were used to produce MOS1 and MOS2 images in 5 energy ranges: 0.5–1 keV, 1–2 keV, 2–5 keV, 5–10 keV and 0.5–10 keV (total band). For each energy band, a corresponding set of exposure maps (i.e. one for each detector) was generated with the SAS task expmap, to account for spatial quantum efficiency (QE), mirror vignetting and field of view variations. In order to maximize the signal–to–noise ratio (S/N) of our serendipitous sources and to reach lower flux limits, we merged the data (images and maps) from the two MOS cameras, for the two pointings separately. After the production of a detector mask (with the task emask), both images and exposure maps were used as a reference for the source detection, which was performed in four steps:
-
1.
For each of the selected energy bands, the SAS task eboxdetect was run in local mode to create a preliminary source list. Sources were identified by applying the standard minimum detection likelihood criterium, i.e., only candidate sources with detection likelihood -ln P 8, where P is the probability of a spurious detection due to a Poissonian random fluctuation of the background, were validated.
-
2.
Then, the task esplinemap was run to remove all the validated sources from the original image and to create a background map by fitting the so called cheesed image with a cubic spline.
-
3.
For each of the selected energy bands the task eboxdetect was run again, but in map mode using as a reference the calculated background maps.
-
4.
Lastly, the final source positions (with the EPIC combined MOS1+MOS2 count rates in each energy range) were calculated using the task emldetect, which performs maximum likelihood fits to the source spatial count distribution in all energy bands. In this case, we checked that low threshold values of the equivalent single band detection likelihood (parameter (mlmin) resulted in a high number of spurious detection. Therefore we fixed mlmin = 30, in order to select only meaningful sources.
With the above procedure we found 25 sources in obs I and 22 in the obs II. In order to further increase the count statistics, we merged the data (images and maps) of the two pointings and applied the above detection procedure also to the merged data. In this case, using the same likelihood limit of mlmin = 30, we detected a total of 41 sources.
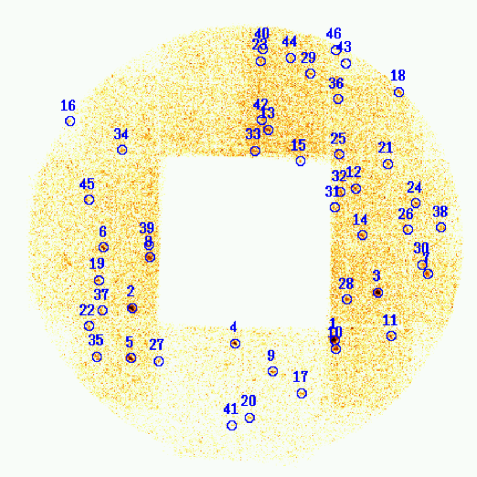
Finally, we used the srcmatch task to cross–match the three sets of detected sources to check for coincident ones. This list contains all the 46 sources, whose distribution over the observed sky area is shown in Fig. 7. There we can check that sources #15, #16, #18, #31, and #46 are close to the edge of the EPIC FOV, therefore we cannot exclude that they are spurious detections.
The main characteristics of these sources are summarized in Table 4. We list the source position (using the recommended XMM-Newton designations for serendipitous sources), the position uncertainty, the count–rate in the four fine energy ranges and the two hardness–ratios between, respectively, the two soft and the two hard ranges. In the reported position error we consider not only the statistical error, associated with the centroiding of the point source, but also the systematic error of 1” (Kirsch 2007) due to the absolute positional accuracy of XMM-Newton. We also report the total source flux between 0.5 and 10 keV, which has been calculated from the total count rate in the full energy band. The applicable count–rate–to–flux conversion factor has been calculated assuming a power–law spectra with photon index, , of 2 and the hydrogen column density in the direction of the globular cluster.
For each source we report if it was detected in the data of the single and/or the combined observations. In this way we find that 11 sources of the first observation are not detected in the second one, while 8 sources of the second observation are not detected in the first one. In order to verify if this result is due to a real source variability, we analysed both the position and count rates of these sources. We found that, in most cases, a source is detected in only one observation because in the other it either falls out of the imaged field–of–view (since the two observations are slightly rotated) or its count rate is just below the detection limit, even if the count rates measured in both the observations are consistent at 1 confidence level. Only in few cases (highlighted with a ’V’ in Table XMM-Newton observations of the low–mass X–ray binary XB 1832–330 in the galactic globular cluster NGC 6652) we checked that the missing detection is due to a real source variability. Regarding the sources detected in the merged observations, we find that only 14 (over a total of 41) are detected also in both the individual observations, while 8 and 6 are detected only in obs I and II, respectively; the remaining 13 sources are detected neither in the first nor in the second observation. Finally, we also note that 3 sources of obs I and 2 sources of the obs II are not detected in the merged observation.
We searched for possible known counterparts in the SIMBAD database, assuming an uncertainty radius equal to three times the source positional uncertainty. In this way we found no positionally coincident sources. The object known as NGC 6652 10, discovered by ROSAT (Johnston et al. 1996), is at a distance of 10.8′′ from our source #4. In Fig. 7 we note that this source is rather bright and, moreover, that there are no other X–ray sources near its position. Therefore, we suggest that it is indeed NGC 6652 10, whose position is now better constrained by the XMM-Newton measurements.
With the same search criteria, we searched for possible counterparts in the GSC2.3 (McLean et al. 2000), USNO–NOMAD (Monet et al. 2003) and 2MASS (Cutri et al. 2003) catalogues. As shown in Table 4, with these constraints we found candidate counterparts for only 10 sources. In order to evaluate whether they are due to possible foreground contamination, we have to estimate the probability of chance coincidence between a X–ray and an optical source. This parameter is given by P = 1-e, where is the X–ray uncertainty–circle radius and is the surface density of the optical sources (Severgnini et al. 2005). In our case, the surface density of the GSC2.3, USNO–NOMAD and 2MASS sources in the EPIC field–of–view is , , and arcsec-2, respectively. Based on the estimated position errors, we derived P 10 % for all the candidate counterparts; therefore, we cannot exclude that they are due to random coincidences.
4 Discussion
We report here on two XMM-Newton observations of XB 1832–330 (located in NGC 6652) performed in 2006, about 1 month apart, which are the first high resolution spectra of this globular cluster source. XB 1832–330 is one of the luminous LMXBs (LX1036 erg s-1) located in a galactic globular cluster, and it is supposed to be an ultracompact binary, because of the faintness of its optical counterpart (Heinke et al. 2001). Ultracompactness is also suggested by one of the possible periodicities found in optical data (Heinke et al. 2001), if associated with the orbital period.
The 0.3–12 keV spectrum is complex and cannot be fit by a single model, requiring a soft component (here described by a blackbody with a temperature of 0.6 keV) together with a hard power law (photon index of 1.5). The spectral parameters of the soft component are similar to those obtained by Parmar et al. (2001) during a BeppoSAX observation. The source displays also a similar 1–10 keV luminosity (with XMM-Newton we get 1.41036 erg s-1 in the same energy range). The XMM-Newton spectroscopy is compatible with what found by Sidoli et al. (2001) in ultracompact binaries located in galactic globular clusters. Indeed, these sources have quite different properties from all the other bright globular cluster LMXBs with longer orbital periods. This spectral analogy led Parmar et al. 2001 to suggest that XB 1832–330 could be an ultracompact binary.
The total low-energy absorption resulting from the fits is compatible with the optically derived value in the direction of the host globular cluster of 1020 cm-2in the first observation, while it is slightly higher in the second, suggesting an extra-absorption in the line of sight of 31020 cm-2. The likely presence of intrinsic neutral extra-absorption seems to be confirmed by a good fit when using the partial covering fractional absorption model, which indicates that XB 1832–330 is absorbed by an additional neutral medium with a covering factor of 30% and an intrinsic hydrogen column density in the range 3–41021 cm-2 for the two observations.
From the analysis of ASCA spectra of a few ultracompact binaries, Juett et al. (2001) suggested the presence of an excess absorption of neutral Ne-rich material local to the sources, leading some authors to propose that the donor stars in some ultracompact binary systems are Ne-rich white dwarfs (e.g., Yungelson et al. 2002). If this is the case, the high Ne/O ratio could be a spectral signature of the presence of some types of degenerate companions (e.g. Neon rich CO white dwarf or O-Ne-Mg WD donors). High resolution spectra taken with XMM-Newton and confirmed a neutral Ne overabundance in a few cases (e.g., 4U 0614+091, Paerels et al. (2001); 4U 1543–624 and 2S 0918–549, Juett & Chakrabarty (2003)). Instead, in other confirmed ultracompact sources, an overabundance of neutral Ne was not found (e.g. 4U 1850–087, Sidoli et al. 2005 and Juett & Chakrabarty 2005) with high resolution spectra, contrary to the earlier ASCA measurement (Juett et al. 2001). This indicates a variability of the Ne/O ratio probably due to luminosity variations (see e.g. Juett & Chakrabarty (2003) or Sidoli et al. (2005)). On the other hand, several known ultracompact binaries have never shown evidence for unusual Ne/O ratios (e.g. 4U 1820–30, where a He white dwarf donor is present, or 4U 0513–40, Juett & Chakrabarty (2005)).
We adopted a variable absorption model together with three edges corresponding to O-K, Ne-K and Fe-L features in order to measure the column density of the neutral Ne, O and Fe in the line of sight. The high resolution XB 1832–330 spectra presented here do not show any prominent emission features. Our study of the strength of the edges of neutral Ne and O reveals an Ne/O abundance ratio (see Table 3) which is consistent with the ISM value of 0.18 (Wilms et al. 2000). This implies that there is no evidence for the donor star in XB 1832–330 to be a Ne-enriched white dwarf.
If we compare the measured elemental column densities (converted to equivalent H column densities using the Wilms et al. (2000) ISM abundances) with the resulting from the overall shape of the XMM-Newton spectra there seems to be a discrepancy, which could indicate an over-abundance of O and a sub-solar abundance of Fe. This latter can be simply explained by the low Fe abundance of the globular cluster. In any case we note that we did not assume any uncertainty in the photoelectric cross-sections, which could be affected by an uncertainty as large as 30% (Paerels et al. 2001). This could account for the observed discrepancy. On the other hand, note that the resulting column density is also dependent on the model adopted for the continuum. A Comptonization model, for example, results into a lower absorption, because of the roll-over at soft energies.
The timing analysis resulted into a possible periodicity of 2.5 hours in the EPIC lightcurve of the first observation, and into a second periodicity (about twice that found in Obs I) during Obs II. The smallest period, if linked to the orbital period of the binary system, would exclude an ultracompact binary (where orbital periods are less than about 1 hr). We note however that, although the period is significant, due to the limited duration of the observations it is not possible to clearly say if this variability is a stable feature in the X–ray lightcurve, or if it is a transient effect not linked to the orbital motion.

.
Our spatial analysis has led to the compilation of a catalogue of 46 faint X–ray sources in the XB 1832–330 field, most of which probably do not belong to the globular cluster, as the NGC 6652 tidal radius is 4.48′ (the 2003 version of the catalog is described in Harris (1996)), well inside the central CCD of the MOS cameras, which was not used for source detection. These source are not listed in the second XMM-Newton (2XMM) Serendipitous Source Catalogue (available online at http://xmmssc-www.star.le.ac.uk/Catalogue/2XMM). In Fig. 8 we report the colour-colour diagram of the detected sources. For comparison, we overplot the simulated colours obtained with an absorbed power-law spectrum, assuming different photon indices and absorption columns. Most of the sources appear to display a low absorption ( cm-2), lower than the absorption towards NGC 6652, thus they are likely foreground objects.
Acknowledgements.
Based on observations obtained with XMM-Newton, an ESA science mission with instruments and contributions directly funded by ESA member states and the USA (NASA). This work was supported by contract ASI/INAF I/023/05/0. We thank the referee (A. Juett) for constructive comments and suggestions which significantly improved our paper.References
- Boirin et al. (2005) Boirin, L., Méndez, M., Díaz Trigo, M., Parmar, A. N., & Kaastra, J. S. 2005, A&A, 436, 195
- Cutri et al. (2003) Cutri, R. M., Skrutskie, M. F., van Dyk, S., et al. 2003, VizieR Online Data Catalog, 2246
- Harris (1996) Harris, W. E. 1996, AJ, 112, 1487
- Heinke et al. (2001) Heinke, C. O., Edmonds, P. D., & Grindlay, J. E. 2001, ApJ, 562, 363
- Henke et al. (1993) Henke, B. L., Gullikson, E. M., & Davis, J. C. 1993, Atomic Data and Nuclear Data Tables, 54, 181
- Hertz & Wood (1985) Hertz, P. & Wood, K. S. 1985, ApJ, 290, 171
- in ’t Zand et al. (1998) in ’t Zand, J. J. M., Verbunt, F., Heise, J., et al. 1998, A&A, 329, L37
- Johnston et al. (1996) Johnston, H. M., Verbunt, F., & Hasinger, G. 1996, A&A, 309, 116
- Juett & Chakrabarty (2003) Juett, A. M. & Chakrabarty, D. 2003, ApJ, 599, 498
- Juett & Chakrabarty (2005) Juett, A. M. & Chakrabarty, D. 2005, ApJ, 627, 926
- Juett et al. (2001) Juett, A. M., Psaltis, D., & Chakrabarty, D. 2001, ApJ, 560, L59
- Juett et al. (2004) Juett, A. M., Schulz, N. S., & Chakrabarty, D. 2004, ApJ, 612, 308
- Kirsch (2007) Kirsch, M. 2007, http://xmm.vilspa.esa.es/docs/documents/CAL-TN-0018.pdf
- McLean et al. (2000) McLean, B. J., Greene, G. R., Lattanzi, M. G., & Pirenne, B. 2000, in Astronomical Society of the Pacific Conference Series, Vol. 216, Astronomical Data Analysis Software and Systems IX, ed. N. Manset, C. Veillet, & D. Crabtree, 145–+
- Monet et al. (2003) Monet, D. G., Levine, S. E., Canzian, B., et al. 2003, AJ, 125, 984
- Mukai & Smale (2000) Mukai, K. & Smale, A. P. 2000, ApJ, 533, 352
- Ortolani et al. (1994) Ortolani, S., Bica, E., & Barbuy, B. 1994, A&A, 286, 444
- Paerels et al. (2001) Paerels, F., Brinkman, A. C., van der Meer, R. L. J., et al. 2001, ApJ, 546, 338
- Parmar et al. (2001) Parmar, A. N., Oosterbroek, T., Sidoli, L., Stella, L., & Frontera, F. 2001, A&A, 380, 490
- Predehl et al. (1991) Predehl, P., Hasinger, G., & Verbunt, F. 1991, A&A, 246, L21
- Predehl & Schmitt (1995) Predehl, P. & Schmitt, J. H. M. M. 1995, A&A, 293, 889
- Severgnini et al. (2005) Severgnini, P., Della Ceca, R., Braito, V., et al. 2005, A&A, 431, 87
- Sidoli et al. (2005) Sidoli, L., La Palombara, N., Oosterbroek, T., & Parmar, A. N. 2005, A&A, 443, 223
- Sidoli et al. (2001) Sidoli, L., Parmar, A. N., Oosterbroek, T., et al. 2001, A&A, 368, 451
- Tarana et al. (2006) Tarana, A., Bazzano, A., Ubertini, P., & Federici, M. 2006, astro-ph/0610325
- Wilms et al. (2000) Wilms, J., Allen, A., & McCray, R. 2000, ApJ, 542, 914
- Yungelson et al. (2002) Yungelson, L. R., Nelemans, G., & van den Heuvel, E. P. J. 2002, A&A, 388, 546
| (1) | (2) | (3) | (4) | (5) | (6) | (7) | (8) | (9) | (10) | (11) | (12) | (13) |
|---|---|---|---|---|---|---|---|---|---|---|---|---|
| SRC | SOURCE NAME | ERR | RATE 1 | RATE 2 | RATE 3 | RATE 4 | HR1 | HR2 | FLUX | OBS | VAR | CTP |
| ID | (′′) | (c s-1) | (c s-1) | (c s-1) | (c s-1) | ( cgs) | ||||||
| 1 | XMMU J183516.1-330602 | 1.02 | 2.85 0.18 | 4.42 0.21 | 1.77 0.14 | 0.22 0.09 | 0.22 0.04 | -0.77 0.08 | 11.98 0.56 | I,II,I+II | / | 0;0;0 |
| 2 | XMMU J183619.4-330357 | 1.03 | 2.46 0.17 | 3.37 0.19 | 1.29 0.13 | 0.15 0.09 | 0.18 0.04 | -0.85 0.09 | 10.45 0.53 | I,II,I+II | / | 1;0;1 |
| 3 | XMMU J183502.4-330257 | 1.03 | 1.47 0.13 | 3.52 0.19 | 2.09 0.15 | 0.31 0.10 | 0.42 0.04 | -0.73 0.07 | 8.99 0.50 | I,II,I+II | / | 0;0;0 |
| 4 | XMMU J183546.9-330617 | 1.06 | 1.22 0.16 | 2.63 0.22 | 1.36 0.17 | 0.38 0.12 | 0.37 0.07 | -0.57 0.11 | 7.23 0.57 | I,II,I+II | / | 1;0;0 |
| 5 | XMMU J183619.7-330714 | 1.05 | 2.37 0.18 | 2.66 0.19 | 0.38 0.09 | 0.00 0.04 | 0.06 0.05 | -1.00 | 7.22 0.53 | I,II,I+II | / | 0;0;0 |
| 6 | XMMU J183628.0-330001 | 1.10 | 0.07 0.06 | 1.26 0.14 | 1.54 0.15 | 1.14 0.17 | 0.90 0.08 | -0.17 0.08 | 3.97 0.40 | I,II,I+II | / | 1;0;0 |
| 7 | XMMU J183446.9-330143 | 1.19 | 0.55 0.12 | 1.00 0.13 | 0.93 0.13 | 0.06 0.08 | 0.31 0.11 | -0.83 0.16 | 3.25 0.41 | I,II,I+II | / | 0;2;0 |
| 8 | XMMU J183613.6-330039 | 1.11 | 0.38 0.08 | 1.27 0.11 | 0.68 0.09 | 0.19 0.07 | 0.54 0.08 | -0.56 0.14 | 2.93 0.30 | I,II,I+II | / | 0;0;0 |
| 9 | XMMU J183535.3-330808 | 1.14 | 0.84 0.15 | 1.24 0.17 | 0.93 0.15 | 0.23 0.12 | 0.19 0.11 | -0.56 0.17 | 4.05 0.49 | I,II,I+II | / | 0;2;0 |
| 10 | XMMU J183515.5-330637 | 1.12 | 0.43 0.09 | 0.87 0.11 | 0.88 0.11 | 0.27 0.10 | 0.32 0.11 | -0.52 0.13 | 2.99 0.34 | I,II,I+II | / | 0;0;0 |
| 11 | XMMU J183458.3-330548 | 1.17 | 0.58 0.12 | 0.83 0.13 | 0.35 0.10 | 0.02 0.07 | 0.17 0.13 | -0.88 | 2.35 0.35 | II,I+II | / | 0;1;0 |
| 12 | XMMU J183509.6-325607 | 1.19 | 0.43 0.10 | 0.43 0.09 | 0.62 0.10 | 0.02 0.05 | -0.04 0.15 | -0.91 | 1.74 0.26 | I,I+II | V | 0;0;0 |
| 13 | XMMU J183536.7-325217 | 1.19 | 0.51 0.09 | 0.75 0.10 | 0.35 0.08 | 0.14 0.08 | 0.19 0.11 | -0.43 0.24 | 2.35 0.30 | I,II,I+II | / | 0;0;0 |
| 14 | XMMU J183507.4-325911 | 1.18 | 0.16 0.06 | 0.54 0.08 | 0.51 0.08 | 0.01 0.03 | 0.55 0.14 | -0.98 | 1.45 0.24 | I,II,I+II | / | 0;0;0 |
| 15 | XMMU J183526.9-325422 | 1.27 | 0.16 0.12 | 0.37 0.17 | 1.31 0.25 | 0.94 0.25 | 0.35 0.37 | -0.17 0.16 | 3.46 0.68 | I,I+II | / | 0;0;0 |
| 16 | XMMU J183638.7-325144 | 1.27 | 1.49 0.30 | 1.57 0.30 | 0.98 0.28 | 0.11 0.26 | 0.08 0.13 | -0.45 0.33 | 5.88 1.05 | I,II,I+II | / | 0;0;0 |
| 17 | XMMU J183526.1-330933 | 1.34 | 0.53 0.16 | 1.01 0.20 | 1.20 0.21 | 0.13 0.13 | 0.31 0.16 | -0.81 0.17 | 3.11 0.49 | I,I+II | V | 0;1;0 |
| 18 | XMMU J183455.9-324948 | 1.31 | 0.79 0.17 | 0.64 0.16 | 0.66 0.15 | 0.20 0.18 | -0.11 0.16 | -0.53 0.33 | 2.79 0.46 | I,I+II | / | 0;0;0 |
| 19 | XMMU J183629.8-330208 | 1.28 | 0.46 0.12 | 0.43 0.11 | 0.66 0.13 | 0.30 0.14 | -0.05 0.17 | -0.34 0.21 | 1.88 0.33 | II,I+II | / | 0;0;0 |
| 20 | XMMU J183542.4-331107 | 1.29 | 1.14 0.22 | 1.07 0.20 | 0.31 0.14 | 0.61 0.24 | 0.00 0.13 | 0.28 0.26 | 3.02 0.51 | I,I+II | / | 1;0;0 |
| 21 | XMMU J183459.5-325430 | 1.46 | 0.30 0.12 | 0.52 0.13 | 0.42 0.13 | 0.23 0.15 | 0.26 0.22 | -0.28 0.34 | 1.73 0.30 | I+II | / | 0;0;0 |
| 22 | XMMU J183632.8-330509 | 1.20 | 0.81 0.16 | 0.84 0.16 | 0.73 0.15 | 0.06 0.11 | 0.06 0.14 | -0.76 | 2.61 0.43 | I,I+II | V | 1;0;1 |
| 23 | XMMU J183539.1-324747 | 1.90 | 0.82 0.20 | 0.66 0.18 | 0.00 0.09 | 0.03 0.11 | -0.11 0.18 | - | 2.15 0.40 | I+II | / | 3;0;1 |
| 24 | XMMU J183450.7-325705 | 1.52 | 0.27 0.12 | 0.57 0.15 | 0.33 0.13 | 0.13 0.15 | 0.35 0.23 | -0.44 0.48 | 1.57 0.31 | I+II | / | 0;2;0 |
| 25 | XMMU J183514.8-325354 | 1.27 | 0.36 0.10 | 0.47 0.11 | 0.62 0.12 | 0.14 0.11 | 0.11 0.18 | -0.64 0.24 | 1.90 0.33 | II,I+II | / | 0;0;0 |
| 26 | XMMU J183453.2-325851 | 1.27 | 0.75 0.12 | 0.40 0.10 | 0.00 0.02 | 0.03 0.07 | -0.29 0.13 | - | 1.29 0.28 | II,I+II | / | 0;0;0 |
| 27 | XMMU J183611.0-330725 | 1.53 | 0.00 0.04 | 0.11 0.11 | 0.67 0.17 | 0.55 0.21 | 1.00 | -0.10 0.23 | 1.34 0.32 | I+II | / | 0;0;0 |
| 28 | XMMU J183512.1-330324 | 1.18 | 0.74 0.10 | 0.43 0.08 | 0.11 0.05 | 0.11 0.06 | -0.26 0.11 | -0.03 0.37 | 1.70 0.26 | I,II,I+II | / | 0;1;1 |
| 29 | XMMU J183523.7-324836 | 1.68 | 0.91 0.20 | 0.35 0.13 | 0.02 0.06 | 0.00 0.11 | -0.44 0.18 | - | 1.82 0.35 | I+II | / | 0;1;0 |
| 30 | XMMU J183448.4-330107 | 1.79 | 0.91 0.19 | 0.48 0.15 | 0.00 0.04 | 0.09 0.14 | -0.30 0.17 | - | 1.68 0.34 | I+II | / | 0;0;0 |
| 31 | XMMU J183516.1-325724 | 1.31 | 0.29 0.09 | 0.44 0.10 | 0.34 0.09 | 0.02 0.05 | 0.21 0.19 | -0.87 | 1.46 0.30 | II,I+II | / | 0;2;0 |
| 32 | XMMU J183514.1-325623 | 1.90 | 0.43 0.11 | 0.32 0.10 | 0.16 0.08 | 0.00 0.05 | -0.15 0.20 | -1.00 | 1.15 0.23 | I+II | / | 1;1;1 |
| 33 | XMMU J183541.1-325339 | 1.39 | 0.18 0.08 | 0.58 0.11 | 0.35 0.09 | 0.08 0.06 | 0.53 0.16 | -0.55 0.23 | 1.22 0.24 | I,I+II | V | 1;0;0 |
| 34 | XMMU J183622.4-325338 | 1.69 | 0.22 0.12 | 0.63 0.17 | 0.38 0.14 | 0.00 0.07 | 0.48 0.23 | -1.00 | 1.60 0.34 | I+II | / | 0;0;0 |
| 35 | XMMU J183630.2-330708 | 1.32 | 0.40 0.13 | 1.09 0.18 | 0.43 0.13 | 0.01 0.06 | 0.46 0.15 | -0.93 | 2.32 0.41 | I,I+II | / | 0;0;0 |
| (1) | (2) | (3) | (4) | (5) | (6) | (7) | (8) | (9) | (10) | (11) | (12) | (13) |
|---|---|---|---|---|---|---|---|---|---|---|---|---|
| SRC | SOURCE NAME | ERR | RATE 1 | RATE 2 | RATE 3 | RATE 4 | HR1 | HR2 | FLUX | OBS | VAR | CTP |
| ID | (′′) | (c s-1) | (c s-1) | (c s-1) | (c s-1) | ( cgs) | ||||||
| 36 | XMMU J183515.1-325016 | 1.83 | 0.97 0.19 | 0.00 0.10 | 0.00 0.04 | 0.02 0.10 | -1.00 | - | 1.39 0.33 | I+II | / | 2;5;1 |
| 37 | XMMU J183628.7-330409 | 1.36 | 0.60 0.13 | 0.65 0.13 | 0.30 0.10 | 0.19 0.15 | 0.04 0.14 | -0.04 0.38 | 1.75 0.34 | II,I+II | V | 0;0;0 |
| 38 | XMMU J183442.8-325840 | 2.01 | 0.26 0.14 | 0.62 0.17 | 0.46 0.16 | 0.06 0.13 | 0.40 0.25 | -0.75 | 1.74 0.37 | I+II | / | 1;2;1 |
| 39 | XMMU J183614.3-325949 | 1.71 | 0.10 0.08 | 0.40 0.11 | 0.21 0.09 | 0.12 0.10 | 0.61 0.28 | -0.26 0.44 | 1.11 0.23 | I+II | / | 1;0;0 |
| 40 | XMMU J183538.4-324701 | 1.99 | 0.35 0.18 | 0.60 0.17 | 0.23 0.14 | 0.28 0.24 | 0.27 0.28 | 0.11 0.52 | 2.17 0.44 | I+II | / | 0;0;0 |
| 41 | XMMU J183548.1-331137 | 1.78 | 0.17 0.20 | 1.06 0.32 | 0.92 0.33 | 0.69 0.40 | 0.73 | -0.15 0.33 | 3.04 0.69 | I+II | / | 0;0;0 |
| 42 | XMMU J183538.5-325139 | 1.74 | 0.82 0.23 | 0.07 0.11 | 0.29 0.15 | 0.13 0.15 | -0.83 | -0.39 0.56 | 1.89 0.42 | I | V | 0;0;1 |
| 43 | XMMU J183512.8-324755 | 1.66 | 1.83 0.50 | 0.15 0.23 | 0.19 0.26 | 0.00 0.19 | -0.85 | - | 3.81 0.93 | I | V | 0;0;0 |
| 44 | XMMU J183529.7-324734 | 2.34 | 1.19 0.36 | 0.18 0.19 | 0.08 0.15 | 0.04 0.19 | -0.74 0.24 | - | 2.78 0.66 | I | V | 3;3;1 |
| 45 | XMMU J183632.9-325653 | 1.61 | 0.71 0.22 | 0.76 0.24 | 0.15 0.16 | 0.00 0.07 | 0.04 0.22 | - | 2.13 0.49 | II | V | 0;0;0 |
| 46 | XMMU J183515.9-324703 | 2.11 | 1.31 0.49 | 0.61 0.37 | 0.06 0.18 | 1.24 0.66 | -0.36 0.31 | 0.91 | 4.74 1.10 | II | / | 0;1;0 |
Key to Table: Col.(1) = Source ID number; Col.(2) = source XMM name; Col.(3) = position error; Col.(4),(5),(6),(7) = MOS1+MOS2 count rates in the energy ranges 0.5–1, 1–2, 2–5, and 4 = 5–10 keV, respectively (rates consistent with false detections are reported in italic); Col.(8),(9) = count rate hardness ratios, defined as HR1 = (2-1)/(2+1) and HR2 = (4-3)/(4+3) (values are omitted when in both energy ranges the measured count rates are consistent with a false detection); Col.(10) = flux in the 0.5–10 keV energy range, in units of 10-14 erg cm-2 s-1, calculated as reported in the text; Col.(11) = XMM observation with a positive source detection; Col.(12) = flag indicating a source variability; Col. (13) = number of GSC, USNO–NOMAD and 2MASS counterparts, respectively, found considering a circular uncertainty region with a radius of three times the source position error.