Discovery of a peculiar Cepheid-like star towards the northern edge of the Small Magellanic Cloud ††thanks: Based on observations made by the EROS-2 collaboration with the MARLY, 1.54 m Danish and 3.60 m telescopes at the European Southern Observatory, La Silla, Chile.
Abstract
Context. For seven years, the EROS-2 project obtained a mass of photometric data on variable stars. We present a peculiar Cepheid-like star, in the direction of the Small Magellanic Cloud, which demonstrates unusual photometric behaviour over a short time interval.
Aims. We report on data of the photometry acquired by the MARLY telescope and spectroscopy from the EFOSC instrument for this star, called EROS2 J005135-714459(sm0060n13842), which resembles the unusual Cepheid HR 7308.
Methods. The light curve of our target is analysed using the Analysis of Variance method to determine a pulsational period of 5.5675 days. A fit of time-dependent Fourier coefficients is performed and a search for proper motion is conducted.
Results. The light curve exhibits a previously unobserved and spectacular change in both mean magnitude and amplitude, which has no clear theoretical explanation. Our analysis of the spectrum implies a radial velocity of 104 km s-1 and a metallicity of -0.40.2 dex. In the direction of right ascension, we measure a proper motion of 17.46.0 mas yr-1 using EROS astrometry, which is compatible with data from the NOMAD catalogue.
Conclusions. The nature of EROS2 J005135-714459(sm0060n13842) remains unclear. For this star, we may have detected a non-zero proper motion for this star, which would imply that it is a foreground object. Its radial velocity, pulsational characteristics, and photometric data, however, suggest that it is instead a Cepheid-like object located in the SMC. In such a case, it would present a challenge to conventional Cepheid models.
Key Words.:
Cepheids - Galaxy: disk - Magellanic Clouds - Stars: peculiar1 Introduction
Measuring amplitude and period variations in the light curves of pulsating stars remains an ongoing challenge in studying stellar variability, which requires repeated observations of many objects. Following the pioneering research of Eddington & Plakidis (1929) about period irregularities of long-period variable stars, numerous authors examined particular characteristics of different stellar populations, such as the period fluctuations of both Mira stars by Percy & Colivas (1999) and Cepheids by Turner et al. (1999). Percy et al. (2003) showed that the non-evolutionary period changes in the Cephei star BW Vul are not the result of random cycle-to-cycle fluctuations. An interesting detection of amplitude change in the stellar class of Cepheids is that for V473 Lyr. Koen (2001) summarized the various hypotheses of different authors who attempt to explain these changes in amplitude, and proposed that the Blazhko effect could explain the observations of V473 Lyr.
Cepheids of the Magellanic Clouds were also studied, because of their importance as standard candles. Deasy & Wayman (1985) reported data about the period change of 115 Cepheids, while the relations between the period and period change of LMC Cepheids were compared by Saitou & Takeuti (1990). Based on data from Harvard, OGLE and ASAS, the studies by Pietrukowicz (2001, 2002) reported the period changes for both LMC and SMC Cepheids. Pietrukowicz (2003) compared period changes, inferred from O-C diagrams for Galactic Cepheids, and model calculations applying particular emphasis to the first overtone object Polaris, for which the period change was far more rapid than had been predicted.
Another interesting example was the Cepheid HR 7308, which was recognized in the early eighties (Burki & Mayor 1980). This star exhibited an amplitude variation of a factor of 6 over about 1200 days that was reported by Burki et al. (1982), who concluded that the variation was not due to the beating between two oscillation modes because the shape of the radial velocity curve indicated the pulsation was radial with a unique frequency. However, a model was proposed, which involved a resonance between a linearly unstable radial mode and a linearly stable low-degree, low-order p-mode (Van Hoolst & Waelkens 1995).
The most striking example of a peculiar object was probably the V19 variable star discovered by Hubble (1926) in M33, which was classified at that time as a Cepheid; its nature remains a mystery, as discussed by Macri et al. (2001). This object exhibited a 54.7 day period, an intensity-weighted mean magnitude of 19.6, and a amplitude of 1.1 mag. Macri et al. (2001) concluded that its amplitude was less than 0.05 mag and its mean magnitude had risen to 19.08 mag. They concluded that V19 could be a high-mass Population I star of a behaviour similar to a low-mass Population II RV Tauri variable. They noted that it was desirable to avoid the misclassification of stars such as V19 as classical Cepheids in distant galaxies.
Large microlensing surveys are particularly efficient detectors of such objects. The main goal of the EROS-2 experiment was to search for microlensing events (Paczynski 1986) due to baryonic dark matter in the Halo (Tisserand et al. 2007) or to ordinary stars in the Galactic plane (Derue et al. 2001; Hamadache et al. 2006). These rare events are detected by filtering tens of million light curves, some of which may contain stellar nuggets. We report the discovery, during a search for microlensing events in an outer region of the SMC, of a Cepheid-like star with peculiar characteristics: both its mean magnitude and amplitude are decreasing spectacularly with time (see Fig. 2). After a brief description of the basics of the EROS-2 setup (Sect. 2), we describe the analysis of its peculiar photometric behaviour in Sect. 3 and in Sect. 4, we describe the spectroscopic data analysis. The photometric blending issue is discussed in Sect. 5. Before presenting our conclusions, we present the proper-motion measurements obtained for the star EROS2 J005135-714459(sm0060n13842) and the post-AGB hypothesis in Sect. 6 and 7, respectively.
2 Photometric setup and data acquisition
The photometric data were acquired between July 1996 and February 2003 using the MARLY telescope (1m Ritchey-Chrétien, f/5.14), with a dichroic beam-splitter; this permitted simultaneous imaging to be completed in two non-standard broad passbands, the so-called EROS filters (4200-7200 Å, “blue” channel) and (6200-9200 Å, “red” channel). Each camera consisted of a mosaic of eight 2K 2K LORAL CCDs with a pixel size of 0.6″ , and a field of view of 0.7°(right ascension) 1.4°(declination). The coordinate on a CCD increases with decreasing declination ( towards South), while the coordinate increases with increasing right ascension.
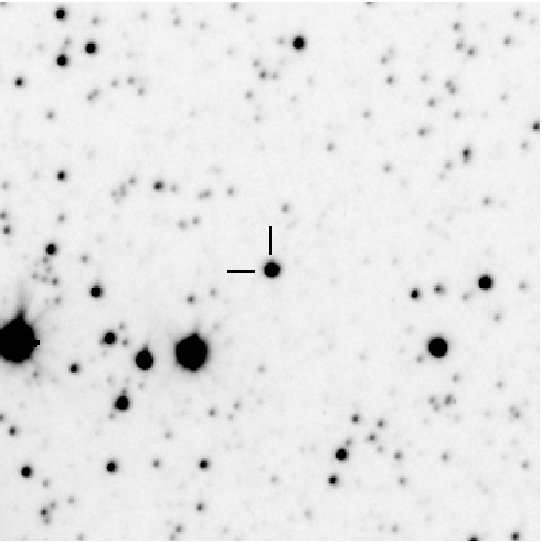
In the case of the SMC, ten fields were observed. The light curves of individual stars were constructed from fixed positions on templates using PEIDA, a software dedicated to the photometry of EROS-2 images (Ansari 1996). The stars were labelled according to the rules defined for the catalogue by Derue et al. (2002). In the present paper, we study the star is EROS2 J005135-714459(sm0060n13842), hereafter sm0060n13842, whose J2000 coordinates are 00:51:35.65; -71:44:59.5 (galactic: 302.915°, -45.378°). Thus, sm0060n13842 is situated at the northern edge of the SMC. Figure 1 provides a finding chart of this object.
3 Photometric analysis
We now examine the photometric properties of sm0060n13842. Figure 2 shows the EROS-2 light curves111The photometric data are available in electronic form at the CDS via anonymous ftp to cdsarch.u-strasbg.fr (130.79.128.5) or via http://cdsweb.u-strasbg.fr/cgi-bin/qcat?J/A+A/ for this star in the colours and with the colour index . We note that there is no data after JD 2 452 360 because of technical problems with the camera.
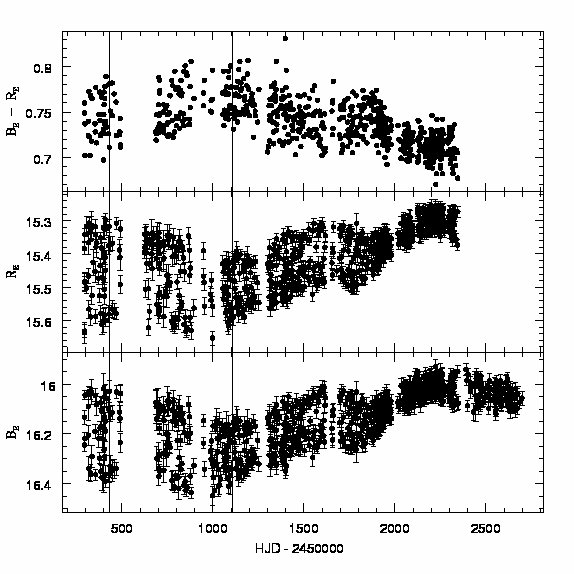
During the EROS-2 observing period it appears that sm0060n13842 exhibited significant variations in both mean magnitude and amplitude. A slight change is visible in the colour index. We note that this object is not present in the public MACHO and OGLE-II databases.
Additional standard photometry was obtained by the PLANET collaboration in August 2004 at the 1.54 m Danish telescope (ESO, La Silla), which is summarized in Table 1. These data agree well with measurements derived by Zaritsky et al. (2002) using their catalogue of the SMC. We note that these authors reported sm0060n13842 to be a star whose photometry cannot be fitted to a stellar atmosphere model. Additional data from the two infrared surveys DENIS (Cioni et al. 2000) and 2MASS (Cutri et al. 2003) are also indicated.
| Band | Magnitude | Julian date |
|---|---|---|
| 17.25 (17.29) | 2 453 229.75770 | |
| 16.26 (16.21) | 2 453 229.74493 | |
| 15.61 | 2 453 229.73094 | |
| 15.11 (15.09) | 2 453 229.73600 | |
| 15.07 | 2 450 429.57333 | |
| 14.18 | 2 450 429.57333 | |
| 14.27 | 2 451 106.75840 | |
| 13.72 | 2 451 106.75840 | |
| 13.66 | 2 450 429.57333 | |
| 13.50 | 2 451 106.75840 |
The local shape of the light curves is similar to that of a classical Cepheid, while its global shape certainly not. We understand that there is presently no theoretical interpretation of this behaviour.
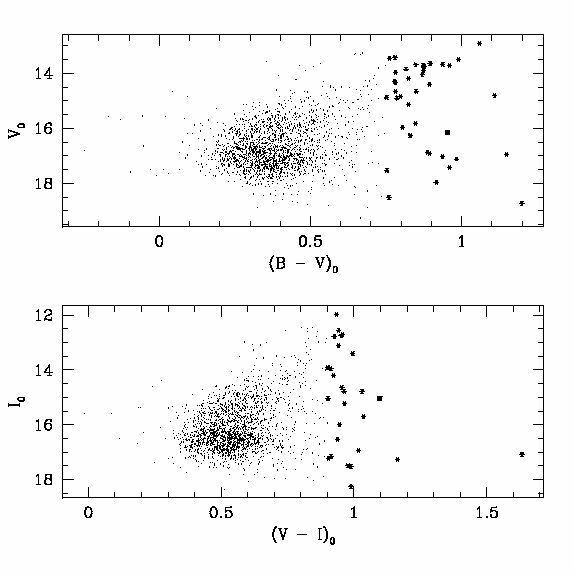
Figure 3 displays the colour-magnitude diagrams vs and vs of the OGLE Cepheids in the SMC (Udalski et al. 1999). The filled squares represent the position of sm0060n13842. These values were calculated using the data in Table 1, and extinction coefficients, in the direction of the SMC, obtainded from the NASA/IPAC Extragalactic Database.
To study the Cepheid nature of the object, we performed a Fourier analysis of its light curve. It was necessary to remove the long-term variation in magnitude and amplitude since we have insufficient measurements to characterise the variations as, for example, periodic, even though the EROS-2 observation period spanned 7 years. We will consider only the data set because it is the most complete. Completeness is important for determining the period because the period accuracy is inversely proportional to both the square root of the number of measurements (924 in and 810 in ) and to the total time of observations (Gilliland & Fisher 1985).
We first calculated the mean flux and the variance for the entire light curve. We then considered the data to be seasonal (7 seasons were accumulated) and divided each season into 2 parts of equal numbers of points. For each part, the average date and flux were calculated. We had 2 points per season from which a linear interpolation was performed to obtain the temporal evolution of the mean flux during a given season, . We were then able to determine the mean flux for every epoch of the season.
We analysed the variable amplitude by dividing each season into 4 parts. This defined 28 temporal windows, denoted below by index . For each window we selected the 2 brightest and the 2 faintest measurements. For these 4 points, we calculated the differences for fluxes at times . These 4 differences were averaged to obtain , an estimator of the maximal flux variation within the -th time window. We then converted each measurement into a modified flux , using the expression . The light curve corresponding is shown in the lower panel of Fig. 4. This correction indicates clearly that the data contain effectively a periodic component.
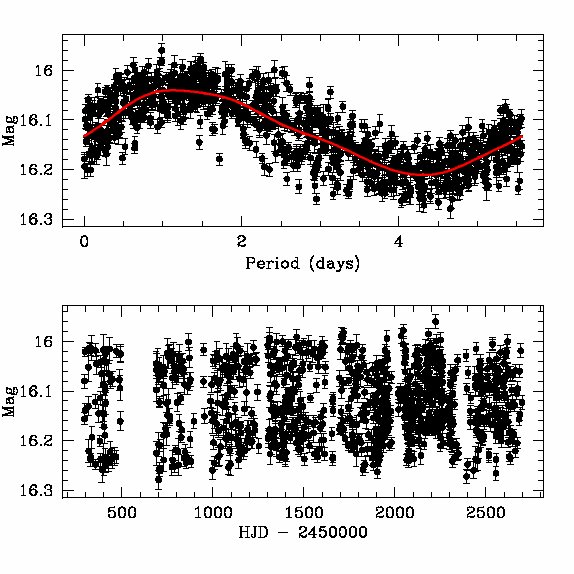
The period analysis was then completed using the Analysis of Variance (AoV) method of Schwarzenberg-Czerny (1989) and the TATRY code based on the multi-harmonic periodogram of Schwarzenberg-Czerny (1996). The value measured was = 5.5675 days. Finally, a Fourier fit was completed according to . Table 2 reports the corresponding quantities and . The first row of the table refers to the red line of the upper panel of Fig. 4. The other rows are discussed below.
| - 2 450 000 | - 2 450 000 | |||||||
|---|---|---|---|---|---|---|---|---|
| 292.8648 | 2698.5268 | 16.125 | 0.082 | 0.274 | 0.101 | 4.573 | 0.022 | 0.220 |
| 292.8648 | 807.6200 | 16.118 | 0.146 | 0.284 | 0.245 | 5.636 | 0.022 | 0.092 |
| 488.5442 | 1037.7914 | 16.118 | 0.130 | 0.106 | 0.220 | 6.083 | 0.027 | 0.134 |
| 810.6014 | 1171.5550 | 16.121 | 0.118 | -0.086 | 0.132 | 0.450 | 0.027 | 0.219 |
| 1039.7866 | 1340.8647 | 16.119 | 0.095 | -0.160 | 0.026 | 1.773 | 0.030 | 1.161 |
| 1173.5735 | 1430.7374 | 16.118 | 0.093 | 0.029 | 0.083 | 3.687 | 0.044 | 0.524 |
| 1341.8360 | 1551.5909 | 16.122 | 0.090 | 0.398 | 0.128 | 3.542 | 0.054 | 0.414 |
| 1433.7395 | 1742.8458 | 16.120 | 0.098 | 0.733 | 0.096 | 2.364 | 0.037 | 0.401 |
| 1553.5609 | 1845.5713 | 16.122 | 0.099 | 0.841 | 0.134 | 2.064 | 0.036 | 0.274 |
| 1744.8375 | 1924.6267 | 16.137 | 0.074 | 0.862 | 0.186 | 2.067 | 0.055 | 0.309 |
| 1848.5785 | 2020.9232 | 16.132 | 0.048 | 0.763 | 0.248 | 2.516 | 0.077 | 0.335 |
| 1926.6210 | 2093.7241 | 16.120 | 0.043 | 0.525 | 0.227 | 3.272 | 0.071 | 0.334 |
| 2025.8887 | 2167.8788 | 16.122 | 0.047 | 0.245 | 0.217 | 4.169 | 0.066 | 0.344 |
| 2093.7841 | 2223.7505 | 16.113 | 0.043 | 0.157 | 0.225 | 4.459 | 0.062 | 0.319 |
| 2168.5507 | 2294.5823 | 16.113 | 0.044 | 0.557 | 0.195 | 3.862 | 0.058 | 0.299 |
| 2224.7489 | 2446.7581 | 16.121 | 0.050 | 0.506 | 0.161 | 4.723 | 0.067 | 0.447 |
| 2297.5690 | 2546.5336 | 16.125 | 0.057 | -0.012 | 0.158 | 0.336 | 0.056 | 0.368 |
| 2448.7357 | 2622.5676 | 16.120 | 0.050 | -0.250 | 0.083 | 1.267 | 0.061 | 0.748 |
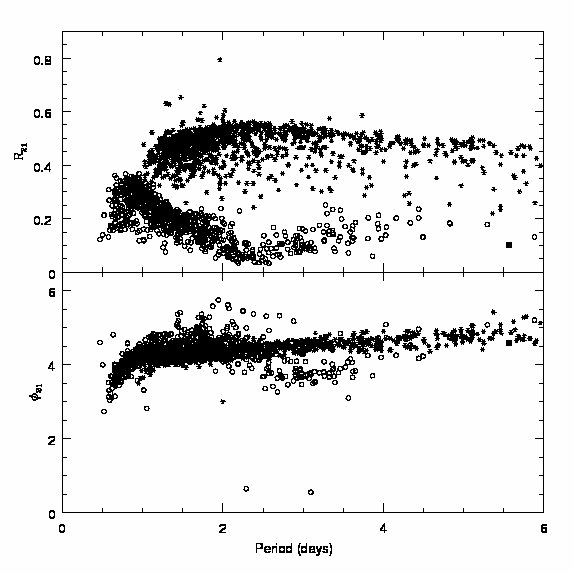
Figure 5 illustrates how the fit is situated in the graphs of both and versus period where the OGLE SMC Cepheids are displayed. From these graphs it appears that sm0060n13842 behaves in a similar way to a first overtone pulsator located in the uppermost tail of period distribution of these objects (which is supported by the shape of the fit in Fig. 4). We note that the Fourier coefficients of the OGLE pulsators were measured using band data, while those for sm0060n13842 were deduced from the data. We checked however, using a sample of about 1500 Cepheids cross-identified in the SMC between OGLE and EROS-2 databases, that there is a correlation with a slope of unity and a low dispersion between the OGLE and EROS-2 Fourier coefficients. From Table 1, the Wesenheit index = - 1.55 (Udalski et al. 1999) is equal to 13.33. This places sm0060n13842 at the edge of the box defining first overtone Cepheids in Fig. 2 of the paper (representing the PL relation) by Udalski et al. (1999), though in a region where few fundamental-mode objects lie.
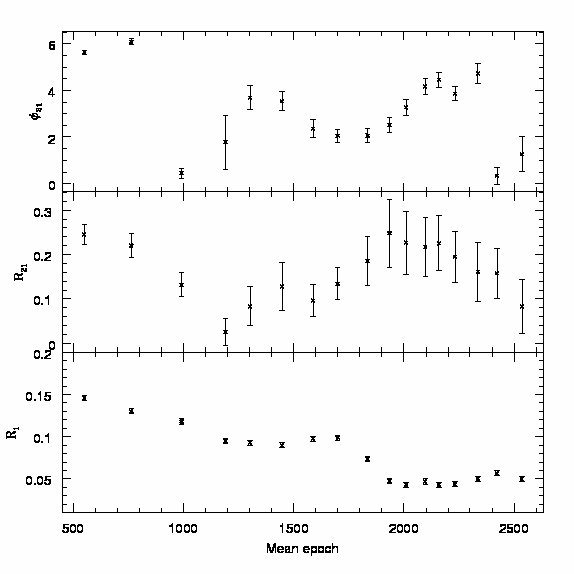
It is evident from Fig. 4 that there is significant scatter in the folded light curve. At least in part, this is because the analysis described above is an approximation that is required to process the data in a classical way. We examined the possibility that Fourier coefficients varied with time. We attempted to construct a light curve for which the long-term variation was corrected, but not the variable amplitude. We used a sliding window by defining blocks of 100 points every 50 measurements, with an epoch beginning at and an epoch ending at , as listed in Table 2. This table indicates the Fourier coefficients that correspond to fits obtained for each block of data with the same period of 5.5675 days, which quantifies the pulsation evolution of sm0060n13842. This analysis indicates that the coefficient decreases continuously with time down to a plateau, while both and vary with large amplitude, as shown in Fig. 6. We note that also shows significant variation, which contributes to the scatter observed in the top panel of Fig. 4.
4 Spectroscopic analysis
Low-resolution spectroscopic data were acquired using the EFOSC instrument on the ESO 3.60 m telescope. We first estimated the radial velocity (RV) by using the cross-correlation of the spectrum with a synthetic spectrum template. We obtained a RV of 104 km s-1. Harris & Zaritsky (2006) conducted a spectroscopic survey of the SMC and measured a smooth RV distribution which was fit well by a plane. Using these data, we deduced a central RV of 145.3 km s-1 at RA = 00:54:29 and DEC = -72:55:23, with a gradient of 5.00.7 km s-1 deg-1 East and -10.51.4 km s-1 deg-1 North. The dispersion was 26 km s-1. Our object is located -0.22° East, 1.17° North from this central point. Hence, the predicted SMC RV, at the position of sm0010n13842, is 132.9 km s-1 with a 1 dispersion of 26 km s-1. Thus, the observed RV is consistent, within a marging of error of 1 , with this predicted value. This is supported by Fig. 9 of Harris & Zaritsky (2006), which indicates that our observed RV is typical of SMC red giants.
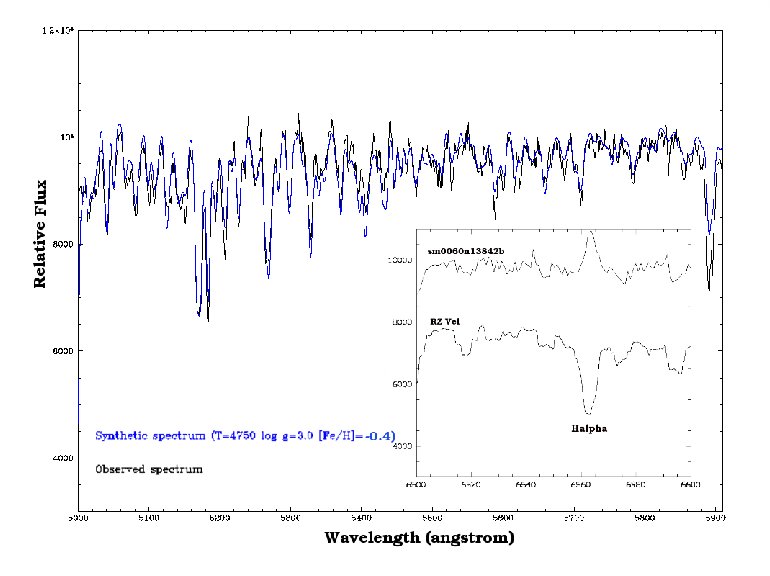
As a second step, we estimated the metallicity. The critical parameter to obtain an accurate determination of metallicity is the temperature. The colour is a good indicator of the temperature of a star. From Table 1, we have =1.15, which gives a temperature of using the synthetic colours derived from the Kurucz models (Kurucz 1993). Inspection of the spectrum shows that the hydrogen line H contains emission (see Fig. 7). We are therefore unable to use this line to check the temperature measured from the photometric data.
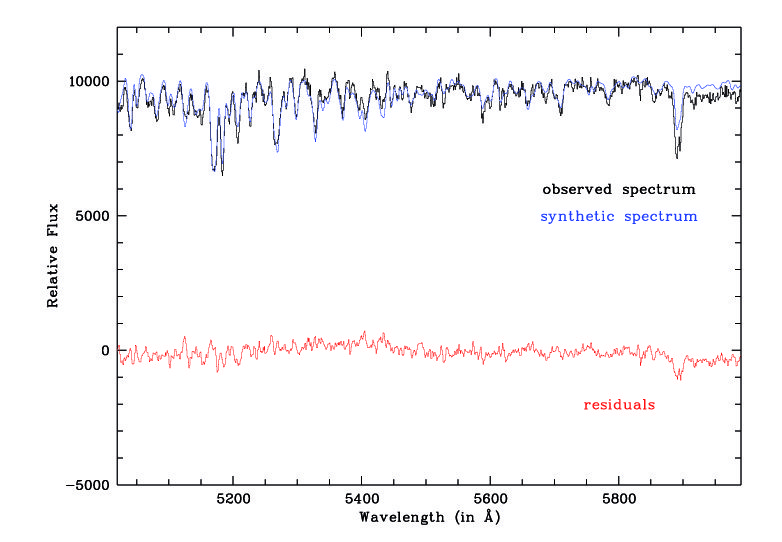
We assumed a surface gravity log g = 3.00, which is typical of Cepheids at this period. The metallicity is relatively insensitive to this parameter. A decrease of +1 dex in the gravity would decrease the metallicity by 0.15 dex. We estimated the metallicity by comparing the observed spectrum with a computed, synthetic spectrum (using SYNTHE) until the most appropriate match was obtained. We also used the strong lines of the Mg triplet (located in the 5100-5200 Å region) to estimate the overabundance of elements. The models were computed using the Kurucz (1993) grid of models (with the option for overshooting on). Figure 7 shows the superposition of the observed spectrum with the “best-fit” spectrum. We finally obtained a metallicity [Fe/H]= -0.40.2 dex (with [/Fe] +0.3). This value is higher than the mean metallicity of the SMC, -0.68 dex (Luck et al. 1998). It would be important to confirm this estimate with the analysis of a higher S/N and higher resolution spectrum.
As mentioned above, it is interesting that the H line is detected in strong emission, while the H line is missing. This emission was observed in beat Cepheids by Barrell (1978), who noted that it could be correlated with the maximum light. To test this hypothesis, we searched for a second period in the light curve, shown on Fig. 4, by subtracting the Fourier model (given in the first row of Table 2) from the light curve, and reapplying the AoV method. We detected only the first (and no second) period to an accuracy of day. Our object is therefore not a beat Cepheid. Schmidt et al. (2004) studied the H emission of Galactic Cepheids and concluded that this emission can help discriminate between type I and II Cepheids in the period range 11-34 days. In the intermediate range from 3 to 8 days, they also observed that no H emission was found but weak emission can occur for type II Cepheids with periods below 3 days. Additional spectroscopic data for sm0060n13842 of the entire pulsation cycle would be required to confirm these findings.
5 The question of blending
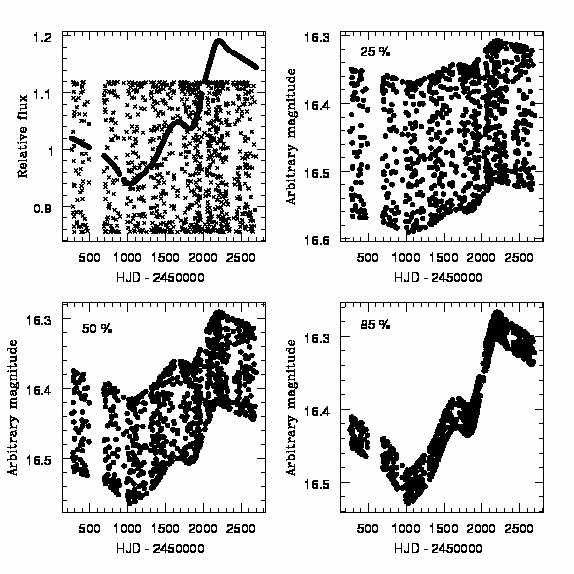
When about a hundred million of stars are monitored in crowded fields, as in the case of the EROS-2 collaboration experiment, it is unsurprising to observe some light curves with unusual behaviour due to the blending of multiple variable stars. We ask how a (long-term) variable star blended with a (classical) Cepheid could produce the peculiar light curve presented in Fig. 2. There are several arguments against this, the most important being that ascribingiveg the long-term variations to one star and the short-term variations to a constant-amplitude periodic star cannot produce the observed light curve. Such a blend would produce a flux as a function of time of the form , where is the slowly varying flux of the first star and and are the time-independent mean flux and amplitude of the periodic star of frequency . The constant contrasts with the observed time-dependent amplitude, which varies within an amplitude variation from 15% of a magnitude 16 star to an amplitude variation of 5% of a magnitude 16 star. The light curve of sm0060n13842 (Fig. 2) is considerably different from those of the simulated blends shown in Fig. 8, which provides the light curves of three reasonable choices of flux ratios for a hypothetical long-term variable and a Cepheid. The behaviour of sm0060n13842 cannot be reproduced because the test Cepheid has a constant amplitude variation in the small range of magnitude considered.
A second argument against the blending origin is that Antonello (2002) showed, by studying the effects of blending on the light curve shape of Cepheids (first overtone or fundamental mode), that the maximum variation in the Fourier parameter and were 0.02 and 0.4, respectively, for a blend that was twice as bright as the average luminosity of a Cepheid. These values are relatively small compared to our observed variation, which is ten times larger.
A final argument against blending is that the spectrum of Fig. 7 provides no indication of significant blending. We subtracted the Cepheid synthetic spectrum presented in Fig. 7 from the observed one. The result is shown in Fig. 9. The tiny feature close to 5900 Å originates in the Na D doublet. Since we assumed that [Na/Fe] = 0 in our computations, this small signal in the residuals could be explained by a non-solar Na/Fe ratio, or by a solar Na/Fe and contamination of the spectrum by interstellar Na absorption lines. The residuals presented in Fig. 9 are similar to noise at least 20 times dimmer than the signal. This implies that a hypothetic blended companion could be fainter by the same amount.
We note that one faint star was reported by Zaritsky et al. (2002) in the immediate vicinity (2.1″) of sm0060n13842, which was not found by the EROS starfinder. The star’s magnitudes are 19.93, 19.15 and 18.11, respectively, 2.9 magnitudes fainter than sm0060n13842. This faint star could contribute a maximum of 7% to the total flux, but studies completed about the behaviour of our photometric algorithm, in the case of blending, show that this value decreases linearly with the neighbour star distance. We estimate that the faint-star contribution to the sm0060n13842 flux should be approximately 2%, which corresponds to 0.02 mag. This is comparable to the EROS-2 photometric resolution at magnitude 16. If this star was variable, we would have detected a luminosity variation at its position on the subtraction images, produced by the differential photometry (see next section). We observed no such variation apart from the luminosity variation of sm0060n13842. We note that the faint neighbour had no influence on the EFOSC spectrum, since the data were taken in 1″ seeing.
In summary, the light curve of sm0060n13842 cannot be generated by blending a long-term variable with a constant-amplitude Cepheid. The curve can be reproduced only by a blend of a long-term variable with a variable-amplitude periodic star. Such an explanation apperas unlikely, since we would expect many more blends of long-term variable stars with constant-amplitude Cepheids and none has been found in the EROS-2 catalogue. We estimated that the probability of such an alignment of stars in the complete EROS-2 fields is less than 1%.
6 The question of proper motion
The NOMAD catalogue reports a proper motion measurement for sm0060n13842 of mas.yr-1 along right ascension and mas.yr-1 along declination. These small positive values are consistent with no proper motion at the 1.5 and 2.5 significance level for right ascension and declination, respectively. We used the EROS-2 images to measure these values where detectable.
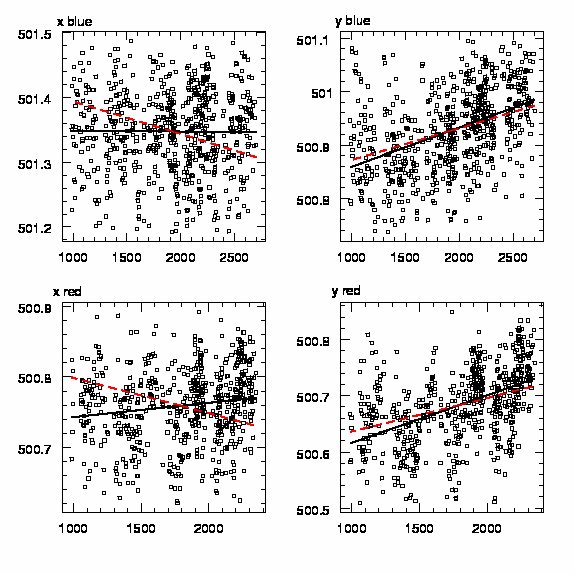
The ISIS image subtraction package (Alard 2000) was used to geometrically align a set of 1K x 1K sub-images centered on sm0060n13842. The template images, used to measure both colours, were compiled from 20 images corresponding to the highest quality seeing conditions. After substraction, the centroid coordinates of the peculiar variable object were measured in each image. These coordinate distributions were clipped at 2 significance level to be conservative and to reduce the sensitivity to systematic errors. Figure 10 shows, in both colours and both directions, the temporal evolution of the pixel coordinates of sm0060n13842 and the linear-regression lines (black solid lines) compared to the proper motion reported by the NOMAD catalogue (red dashed lines). Table 3 summarizes the measurements.
The slopes measured on both mosaics are in excellent agreement with each other. Our main signal is along the axis (i.e. right ascension). We did not extensively study all possible systematic effects on our astrometric data, but another method was used to verify this proper motion. It is based on a 1D PSF fit along both axes completed during the EROS-2 photometric process, when images were geometrically aligned to a reference image. The new proper-motion measurements for our object agree with the values listed in Table 3; an interesting result is produced the thousand bright stars surrounding sm0060n13842. With them, we estimated that a proper motion of about 17 mas.yr-1, along the right ascension, was significant only at 3 level. Therefore we point out that the uncertainty in our measurement is underestimated, and that a systematic error of up to mas.yr-1 should be added. The measured, mean proper motion is therefore mas.yr-1 along right ascension, and mas.yr-1 along declination. These values are consistent with the measurement reported in NOMAD, but do not confirm the highest NOMAD signal at a 2.5 significance level along the declination axis.
If the positive proper motion signal found along right ascension is confirmed, sm0060n13842 is a candidate for being a foreground Galactic star. Furthermore, we note that a proper motion towards the increasing direction of right ascension is as expected for a Galactic star in the direction of the SMC. More disturbing is the result obtained from the reduced proper motion (RPM). In Fig. 2 of Salim & Gould (2002), sm0060n13842 is located (with and RPM )222These values were calculated using magnitudes listed in Table 1. RPM = log, where is the proper motion expressed in ”yr-1 in the dense main-sequence star region. Therefore, the measured proper motion (value and direction) of our peculiar SMC Cepheid-like object is surprisingly consistent with those measured for nearby main-sequence stars.
| Coordinate | Slope | Proper motion |
|---|---|---|
| (10-5 pixel day-1) | (mas yr-1) | |
| blue | 0.12 0.53 | -0.3 1.2 |
| red | 1.92 0.55 | -4.2 1.2 |
| blue | 7.59 0.58 | 16.6 1.3 |
| red | 8.33 0.63 | 18.2 1.4 |
7 The post-AGB hypothesis
Since it is known that the post-AGB tracks cross the high-luminosity end of the Population II Cepheids instability strip (van Winckel 2003), we examine the facts that argue against sm0060n13842 being a post-AGB object. First, such stars often exhibit a near-IR excess. In the LMC, is in the range 2 - 4 for MSX sources (Wood & Cohen 2001) and in the range 6 - 8 for the Arecibo sample of OH/IR stars (Jiménez-Esteban et al. 2001). For the present case the mean, colour index is 0.825 from Table 1. In a similar way, no source was found in the IRAS catalogue in the vicinity of our object. However, these arguments should be interpreted with caution because of the low value of gas-dust ratio in the SMC. Second, it is recognized that the class of RV Tauri stars harbors post-AGB objects, although the shortest periods in this class are in the range of a few tens of days (Wallerstein 2002), far longer than the period of sm0060n13842. In addition, a pulsation model has been used (Wood, private communication) with the following parameters derived from the and data: ; = 4500 K. With that luminosity, a post-AGB star would have a mass of 0.52 , and a core mass very slightly smaller (0.517 for the derived ). Computing the periods for such a star, we find that P 65 days and P 20 days, which implies that both models ARE very unstable. This rules out the interpretation of a SMC post-AGB object.
8 Conclusion
The nature of sm0060n13842 remains uncertain, according to the different points discussed above:
-
•
The period of 5.5675 days, the apparent magnitude, and the Fourier coefficients indicate that sm0060n13842 behaves like a Cepheid located in the SMC. However, we have no clear indication from Figs. 3 and 5 that this star belongs to the class of either fundamental or first overtone pulsators. The Fourier coefficients show a temporal evolution that, to our knowledge, was not previously observed (we have excluded that these properties can be explained by the blending of a Cepheid and a longer timescale variable star).
-
•
Our simple spectroscopic analyses measures a radial velocity that is consistent with spectroscopic survey of the SMC completed by Harris & Zaritsky (2006). However, the derived metallicity is higher than typical values measured for the SMC.
-
•
The hypothesis of a blend is unlikely because the peculiar evolution in the amplitude with time cannot be explainded by a blend with a long-term variable. Moreover, the subtraction of a synthetic, Cepheid spectrum from the observed spectrum does not provide any significant residuals.
-
•
Considering the position of sm0060n13842 on EROS images, the possibility of a proper motion in right ascension cannot be ruled out. This is partially consistent with measurements reported in the NOMAD catalogue. A proper motion of 17 mas yr-1, at a distance of 60 kpc, produces a very high transverse velocity of 4800 km s-1, suggesting that the object was ejected from the SMC. If a contrario we assume that sm0060n13842 is a Galactic object, it is located on the main sequence. In such a case however, we would have to explain why its behavior is that of a Cepheid at the distance of the SMC.
This discussion indicates that sm0060n13842 is an extremely interesting object which should be reobserved more thoroughly, both photometrically and spectroscopically. In this respect, the OGLE-III project data should certainly provide invaluable information.
Acknowledgements.
We are grateful to the PLANET collaboration for access to the 1m54 Danish telescope at ESO during the August 2004 observation campaign. JPB, JBM and ASC acknowledge additional travel support from the LEA Astro-PF fund. JBM and PT thank V. Hill for valuable suggestions and the Collaboration thanks P. Wood for his post-AGB computations. This publication makes use of data products from the Two Micron All Sky Survey, which is a joint project of the University of Massachusetts and the Infrared Processing and Analysis Center/California Institute of Technology, funded by the National Aeronautics and Space Administration and the National Science Foundation. The DENIS project has been partly funded by the SCIENCE and the HCM plans of the European Commission under grants CT920791 and CT940627. It is supported by INSU, MEN and CNRS in France, by the State of Baden-Württemberg in Germany, by DGICYT in Spain, by CNR in Italy, by FFwFBWF in Austria, by FAPESP in Brazil, by OTKA grants F-4239 and F-013990 in Hungary, and by the ESO CSP in Brazil, and by the ESO C&EE grant A-04-046. This research has made use of the VizieR catalogue access tool, CDS, Strasbourg, France. This research has made use of the NASA/IPAC Extragalactic Database (NED) which is operated by the Jet Propulsion Laboratory, California Institute of Technology, under contract with the National Aeronautics and Space Administration.References
- Ansari (1996) Ansari, R. 1996, Vistas in Astronomy, 40, 519
- Antonello (2002) Antonello, E. 2002, A&A, 391, 795
- Barrell (1978) Barrell, S. L. 1978, ApJ, 226, L141
- Burki & Mayor (1980) Burki, G. & Mayor, M. 1980, A&A, 91, 115
- Burki et al. (1982) Burki, G., Mayor, M., & Benz, W. 1982, A&A, 109, 258
- Cioni et al. (2000) Cioni, M.-R., Loup, C., Habing, H. J., et al. 2000, A&AS, 144, 235
- Cutri et al. (2003) Cutri, R. M., Skrutskie, M. F., van Dyk, S., et al. 2003, VizieR Online Data Catalog, 2246, 0
- Deasy & Wayman (1985) Deasy, H. P. & Wayman, P. A. 1985, MNRAS, 212, 395
- Denis Consortium (2005) Denis Consortium, T. 2005, VizieR Online Data Catalog, 1, 2002
- Derue et al. (2001) Derue, F., Afonso, C., Alard, C., et al. 2001, A&A, 373, 126
- Derue et al. (2002) Derue, F., Marquette, J.-B., Lupone, S., et al. 2002, A&A, 389, 149
- Eddington & Plakidis (1929) Eddington, A. S. & Plakidis, S. 1929, MNRAS, 90, 65
- Gilliland & Fisher (1985) Gilliland, R. L. & Fisher, R. 1985, PASP, 97, 285
- Hamadache et al. (2006) Hamadache, C., Le Guillou, L., Tisserand, P., et al. 2006, A&A, 454, 185
- Harris & Zaritsky (2006) Harris, J. & Zaritsky, D. 2006, AJ, 131, 2514
- Hubble (1926) Hubble, E. P. 1926, ApJ, 63, 236
- Jiménez-Esteban et al. (2001) Jiménez-Esteban, F., Engels, D., & García-Lario, P. 2001, in Post-AGB Objects as a Phase of Stellar Evolution, ed. R. Szczerba & S. K. Górny, p. 49
- Koen (2001) Koen, C. 2001, MNRAS, 322, 97
- Kurucz (1993) Kurucz, R. 1993, ATLAS9 Stellar Atmosphere Programs and 2 km/s grid. Kurucz CD-ROM No. 13. Cambridge, Mass.: Smithsonian Astrophysical Observatory, 1993., 13
- Luck et al. (1998) Luck, R. E., Moffett, T. J., Barnes, III, T. G., & Gieren, W. P. 1998, AJ, 115, 605
- Macri et al. (2001) Macri, L. M., Sasselov, D. D., & Stanek, K. Z. 2001, ApJ, 550, L159
- Paczynski (1986) Paczynski, B. 1986, ApJ, 304, 1
- Percy & Colivas (1999) Percy, J. R. & Colivas, T. 1999, PASP, 111, 94
- Percy et al. (2003) Percy, J. R., Velocci, V., & Sterken, C. 2003, PASP, 115, 626
- Pietrukowicz (2001) Pietrukowicz, P. 2001, Acta Astronomica, 51, 247
- Pietrukowicz (2002) Pietrukowicz, P. 2002, Acta Astronomica, 52, 177
- Pietrukowicz (2003) Pietrukowicz, P. 2003, Acta Astronomica, 53, 63
- Saitou & Takeuti (1990) Saitou, M. & Takeuti, M. 1990, PASJ, 42, 341
- Salim & Gould (2002) Salim, S. & Gould, A. 2002, ApJ, 575, L83
- Schmidt et al. (2004) Schmidt, E. G., Johnston, D., Lee, K. M., et al. 2004, AJ, 128, 2988
- Schwarzenberg-Czerny (1989) Schwarzenberg-Czerny, A. 1989, MNRAS, 241, 153
- Schwarzenberg-Czerny (1996) Schwarzenberg-Czerny, A. 1996, ApJ, 460, L107
- Tisserand et al. (2007) Tisserand, P., Le Guillou, L., Afonso, C., et al. 2007, A&A, 469, 387
- Turner et al. (1999) Turner, D. G., Horsford, A. J., & MacMillan, J. D. 1999, Journal of the American Association of Variable Star Observers (JAAVSO), 27, 5
- Udalski et al. (1999) Udalski, A., Soszynski, I., Szymanski, M., et al. 1999, Acta Astronomica, 49, 437
- Van Hoolst & Waelkens (1995) Van Hoolst, T. & Waelkens, C. 1995, A&A, 295, 361
- van Winckel (2003) van Winckel, H. 2003, ARA&A, 41, 391
- Wallerstein (2002) Wallerstein, G. 2002, PASP, 114, 689
- Wood & Cohen (2001) Wood, P. R. & Cohen, M. 2001, in Post-AGB Objects as a Phase of Stellar Evolution, ed. R. Szczerba & S. K. Górny, p. 71
- Zaritsky et al. (2002) Zaritsky, D., Harris, J., Thompson, I. B., Grebel, E. K., & Massey, P. 2002, AJ, 123, 855